Transcription
A Data Clustering Algorithm for Mining PatternsFrom Event LogsRisto VaarandiCopyright 2003 IEEE.Reprinted from Proceedings of the 2003 IEEE Workshop on IP Operations and Management.(ISBN: 0-7803-8199-8)This material is posted here with permission from IEEE. Internal or personal use of this material ispermitted. However, permission to reprint/republish this material for advertising or promotional purposes orfor creating new collective works for resale or redistribution must be obtained from IEEE by writing topubs-permissions@ieee.org.By choosing to view this document, you agree to all provisions of the copyright laws protecting it.
A Data Clustering Algorithm for Mining PatternsFrom Event LogsRisto VaarandiDepartment of Computer EngineeringTallinn Technical UniversityTallinn, Estoniaristo.vaarandi@eyp.eeAbstract— Today, event logs contain vast amounts of datathat can easily overwhelm a human. Therefore, mining patternsfrom event logs is an important system management task. Thispaper presents a novel clustering algorithm for log file data setswhich helps one to detect frequent patterns from log files, tobuild log file profiles, and to identify anomalous log file lines.Keywords—system monitoring, data mining, data clusteringI.INTRODUCTIONEvent logging and log files are playing an increasinglyimportant role in system and network management. Over thepast two decades, the BSD syslog protocol [1] has become awidely accepted standard that is supported on many operatingsystems and is implemented in a wide range of systemdevices. Well-written system applications either use the syslogprotocol or produce log files in custom format, while manydevices like routers, switches, laser printers, etc. are able tolog their events to remote host using the syslog protocol.Normally, events are logged as single-line textual messages.Since log files are an excellent source for determining thehealth status of the system, many sites have built a centralizedlogging and log file monitoring infrastructure. Because of theimportance of log files as the source of system healthinformation, a number of tools have been developed formonitoring log files, e.g., Swatch [2], Logsurfer [3], andSEC [4].Log file monitoring techniques can be categorized intofault detection and anomaly detection. In the case of faultdetection, the domain expert creates a database of faultmessage patterns. If a line is appended to a log file thatmatches a pattern, the log file monitor takes a certain action.This commonly used approach has one serious flaw - onlythose faults that are already known to the domain expert canbe detected. If a previously unknown fault condition occurs,the log file monitor simply ignores the corresponding messagein the log file, since there is no match for it in the patterndatabase. Also, it is often difficult to find a person withsufficient knowledge about the system. In the case of anomalydetection, a system profile is created which reflects normalsystem activity. If messages are logged that do not fit theprofile, an alarm is raised. With this approach, previouslyunknown fault conditions are detected, but on the other hand,creating the system profile by hand is time-consuming anderror-prone.This work is supported by the Union Bank of Estonia.In order to solve the knowledge acquisition problems,various methods have been employed, with data miningmethods being one of the most popular choices [5, 6, 7, 8, 9].In most research papers, the focus has been on miningfrequent patterns from event logs. This helps one to findpatterns that characterize the normal behavior of the system,and facilitates the creation of the system profile. However, aspointed out in [8], the mining of infrequent patterns is equallyimportant, since this might reveal anomalous events thatrepresent unexpected behavior of the system, e.g., previouslyunknown fault conditions. Recent research papers have mainlyproposed the mining of temporal patterns from event logs withvarious association rule algorithms [5, 6, 7, 8, 9]. Thesealgorithms assume that the event log has been normalized, i.e.,all events in the event log have a common format. Typically,each event is assumed to have at least the following attributes:timestamp of event occurrence, the event type, and the name ofthe node which issued the event (though the node name isoften encoded in the event type). Association rule algorithmshave been often used for detecting temporal associationsbetween event types [5, 6, 7, 8, 9], e.g., if events of type A andB occur within 5 seconds, they will be followed by an event oftype C within 60 seconds (each detected temporal associationhas a certain frequency and confidence).Although association rule algorithms are powerful, theyoften can’t be directly applied to log files, because log filelines do not have a common format. Furthermore, log file linesseldom have all the attributes that are needed by theassociation rule algorithms. For example, the widely usedsyslog protocol does not impose strict requirements on the logmessage format [1]. A typical syslog message has just thetimestamp, hostname, and program name attributes that arefollowed by a free-form message string, but only the messagestring part is mandatory [1]. A detailed discussion of theshortcomings of the syslog protocol can be found in [1, 10].One important attribute that log file lines often lack is theevent type. Fortunately, it is possible to derive event typesfrom log file lines, since very often the events of the sametype correspond to a certain line pattern. For example, thelinesRouter myrouter1 interface 192.168.13.1 downRouter myrouter2 interface 10.10.10.12 downRouter myrouter5 interface 192.168.22.5 down
represent the event type “interface down”, and correspondto the line pattern Router * interface * down. Linepatterns could be identified by manually reviewing log files,but this is feasible for small log files only.One appealing choice for solving this problem is theemployment of data clustering algorithms. Clusteringalgorithms [11, 12] aim at dividing the set of objects intogroups (clusters), where objects in each cluster are similar toeach other (and as dissimilar as possible to objects from otherclusters). Objects that do not fit well to any of the clustersdetected by the algorithm are considered to form a specialcluster of outliers. When log file lines are viewed as objects,clustering algorithms are a natural choice, because linepatterns form natural clusters - lines that match a certainpattern are all similar to each other, and generally dissimilar tolines that match other patterns. After the clusters (event types)have been identified, association rule algorithms can beapplied for detecting temporal associations between eventtypes.However, note that log file data clustering is not merely apreprocessing step. A clustering algorithm could identifymany line patterns that reflect normal system activity and thatcan be immediately included in the system profile, since theuser does not wish to analyze them further with the associationrule algorithms. Furthermore, the cluster of outliers that isformed by the clustering algorithm contains infrequent linesthat could represent previously unknown fault conditions, orother unexpected behavior of the system that deserves closerinvestigation.Although data clustering algorithms provide the user avaluable insight into event logs, they have received littleattention in the context of system and network management.In this paper, we discuss existing data clustering algorithms,and propose a new clustering algorithm for mining linepatterns from log files. We also present an experimentalclustering tool called SLCT (Simple Logfile Clustering Tool).The rest of this paper is organized as follows: section 2discusses related work on data clustering, section 3 presents anew clustering algorithm for log file data sets, section 4describes SLCT, and section 5 concludes the paper.II. RELATED WORKClustering methods have been researched extensively overthe past decades, and many algorithms have been developed[11, 12]. The clustering problem is often defined as follows:given a set of points with n attributes in the data space Rn, finda partition of points into clusters so that points within eachcluster are close (similar) to each other. In order to determine,how close (similar) two points x and y are to each other, adistance function d(x, y) is employed. Many algorithms use acertain variant of Lp norm (p 1, 2, .) for the distancefunction:d p ( x, y ) pn i 1 xi y ipToday, there are two major challenges for traditionalclustering methods that were originally designed for clusteringnumerical data in low-dimensional spaces (where usually n iswell below 10).Firstly, quite many data sets consist of points withcategorical attributes, where the domain of an attribute is afinite and unordered set of values [13, 14]. As an example,consider a categorical data set with attributescar-manufacturer, model, type, and color, and data points('Honda', 'Civic', 'hatchback', 'green') and ('Ford', 'Focus','sedan', 'red'). Also, it is quite common for categorical datathat different points can have different number of attributes.Therefore, it is not obvious how to measure the distancebetween data points. Though several popular distancefunctions for categorical data exist (such as the Jaccardcoefficient [12, 13]), the choice of the right function is oftennot an easy task. Note that log file lines can be viewed aspoints from a categorical data set, since each line can bedivided into words, with the n-th word serving as a value forthe n-th attribute. For example, the log file line Connectionfrom 192.168.1.1 could be represented by the data point('Connection', 'from', '192.168.1.1'). We will use thisrepresentation of log file data in the remainder of this paper.Secondly, quite many data sets today are highdimensional, where data points can easily have tens ofattributes. Unfortunately, traditional clustering methods havebeen found not to work well when they are applied to highdimensional data. As the number of dimensions n increases, itis often the case that for every pair of points there existdimensions where these points are far apart from each other,which makes the detection of any clusters almost impossible(according to some sources, this problem starts to be severewhen n 15) [12, 15, 16]. Furthermore, traditional clusteringmethods are often unable to detect natural clusters that exist insubspaces of the original high-dimensional space [15, 16]. Forinstance, data points (1333, 1, 1, 99, 25, 2033, 1044), (12, 1, 1,724, 667, 36, 2307), and (501, 1, 1, 1822, 1749, 808, 9838) arenot seen as a cluster by many traditional methods, since in theoriginal data space they are not very close to each other. Onthe other hand, they form a very dense cluster in the secondand third dimension of the space.The dimensionality problems described above are alsorelevant to the clustering of log file data, since log file data istypically high-dimensional (i.e., there are usually more thanjust 3-4 words on every line), and most of the line patternscorrespond to clusters in subspaces. For example, the lineslog: connection from 192.168.1.1log: RSA key generation completelog: Password authentication for john accepted.form a natural cluster in the first dimension of the dataspace, and correspond to the line pattern log: *.During past few years, several algorithms have beendeveloped for clustering high-dimensional data, like CLIQUE,MAFIA, CACTUS, and PROCLUS. The CLIQUE [15] andMAFIA [17] algorithms closely remind the Apriori algorithmfor mining frequent itemsets [18]: they start with identifyingall clusters in 1-dimensional subspaces, and after they haveidentified clusters C1,.,Cm in (k-1)-dimensional subspaces,
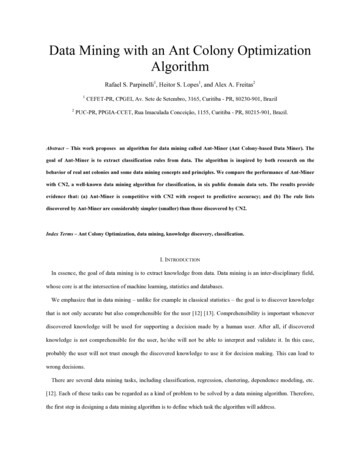
they form cluster candidates for k-dimensional subspaces fromC1,.,Cm, and then check which of those candidates are actualclusters. Those algorithms are effective in discovering clustersin subspaces, because they do not attempt to measure distancebetween individual points, which is often meaningless in ahigh-dimensional data space. Instead, their approach is densitybased, where a clustering algorithm tries to identify denseregions in the data space, and forms clusters from thoseregions. Unfortunately, the CLIQUE and MAFIA algorithmssuffer from the fact that Apriori-like candidate generation andtesting involves exponential complexity and high runtimeoverhead [19, 20] – in order to produce a frequent m-itemset,the algorithm must first produce 2m – 2 subsets of that mitemset. The CACTUS algorithm [14] first makes a pass overthe data and builds a data summary, then generates clustercandidates during the second pass using the data summary,and finally determines the set of actual clusters. AlthoughCACTUS makes only two passes over the data and istherefore fast, it is susceptible to the phenomenon of chaining(long strings of points are assigned to the same cluster) [11],which is undesirable if one wants to discover patterns from logfiles. The PROCLUS algorithm [16] uses the K-medoidmethod for detecting K clusters in subspaces of the originalspace. However, in the case of log file data the number ofclusters can rarely be predicted accurately, and therefore it isnot obvious what is the right value for K.Though several clustering algorithms exist for highdimensional data spaces, they are not very suitable forclustering log file lines, largely because they don't take intoaccount the nature of log file data. In the next section, we willfirst discuss the properties of log file data, and then we willpresent a fast clustering algorithm that relies on theseproperties.TABLE I.Data setData set sizeTotal number ofdifferent wordsThe number ofwords occurringonceThe number ofwords occurring 5times or lessThe number ofwords occurring10 times or lessThe number ofwords occurring20 times or lessThe number ofwords occurring atleast once per10,000 linesThe number ofwords occurring atleast once per1,000 linesIII.CLUSTERING LOG FILE DATAA. The Nature of Log File DataThe nature of the data to be clustered plays a key role whenchoosing the right algorithm for clustering. Most of theclustering algorithms have been designed for generic data setssuch as market basket data, where no specific assumptionsabout the nature of data are made. However, when we inspectthe content of typical log files at the word level, there are twoimportant properties that distinguish log file data from ageneric data set. During our experiments that revealed theseproperties, we used six logfile data sets from various domains:HP OpenView event log file, mail server log file (the serverwas running sendmail, ipopd, and imapd daemons), Squidcache server log file, Internet banking server log file, file andprint server log file, and Win2000 domain controller log file.Although it is impossible to verify that the properties we havediscovered characterize every logfile ever created on earth, westill believe that they are common to a wide range of logfiledata sets.Firstly, majority of the words occur only a few times in thedata set. Table 1 presents the results of an experiment forestimating the occurrence times of words in log file data. Theresults show that a majority of words were very infrequent,and a significant fraction of words appeared just once in thedata set (one might argue that most of the words occurringonce are timestamps, but when timestamps were removedfrom data sets, we observed no significant differences in theexperiment results). Also, only a small fraction of words wererelatively frequent, i.e., they occurred at least once per every10,000 or 1,000 lines. Similar phenomena have been observedfor World Wide Web data, where during an experiment nearly50% of the words were found to occur once only [21].OCCURRENCE TIMES OF WORDS IN LOG FILE DATAMail server log file(Linux)Cache server logfile ingserverlogfile(Solaris)File and print serverlog file (Win2000)Domain controllerlog file (Win2000)1025.3 MB,7,657,148 lines1088.9 MB,8,189,780 lines696.9 MB,1,835,679 lines2872.4 MB,14,733,696 lines2451.6 MB,7,935,958 lines1043.9 MB,4,891,883 22,6176274761,242304817293
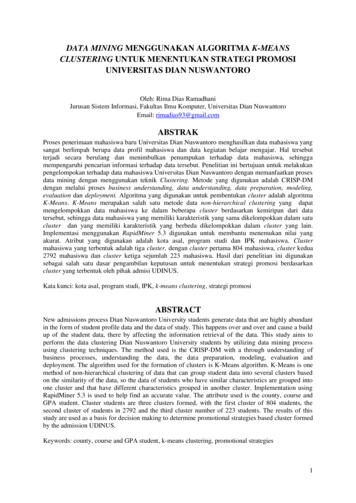
Secondly, we discovered that there were many strongcorrelations between words that occurred frequently. As wefound, this effect is caused by the fact that a message isgenerally formatted according to a certain format string beforeit is logged, e.g.,sprintf(message, "Connection from %s port %d", ipaddress,portnumber);When events of the same type are logged many times,constant parts of the format string will become frequent wordswhich occur together many times in the data set. In the nextsubsection we will present a clustering algorithm that relies onthe special properties of log file data.B. The clustering algorithmOur aim was to design an algorithm which would be fastand make only a few passes over the data, and which woulddetect clusters that are present in subspaces of the original dataspace. The algorithm relies on the special properties of log filedata discussed in the previous subsection, and uses the densitybased approach for clustering.The data space is assumed to contain data points withcategorical attributes, where each point represents a line froma log file data set. The attributes of each data point are thewords from the corresponding log file line. The data space hasn dimensions, where n is the maximum number of words perline in the data set. A region S is a subset of the data space,where certain attributes i1,.,ik (1 k n) of all points thatbelong to S have identical values v1,.,vk: x S, xi1 v1, .,xik vk. We call the set {(i1,v1),.,(ik,vk)} the set of fixedattributes of region S. If k 1 (i.e., there is just one fixedattribute), the region is called 1-region. A dense region is aregion that contains at least N points, where N is the supportthreshold value given by the user.The algorithm consists of three steps like the CACTUSalgorithm [14] – it first makes a pass over the data and buildsa data summary, and then makes another pass to build clustercandidates, using the summary information collected before.As a final step, clusters are selected from the set of candidates.During the first step of the algorithm (data summarization),the algorithm identifies all dense 1-regions. Note that this taskis equivalent to the mining of frequent words from the data set(the word position in the line is taken into account during themining). A word is considered frequent if it occurs at least Ntimes in the data set, where N is the user-specified supportthreshold value.After dense 1-regions (frequent words) have been identified,the algorithm builds all cluster candidates during one pass.The cluster candidates are kept in the candidate table, which isinitially empty. The data set is processed line by line, andwhen a line is found to belong to one or more dense 1-regions(i.e., one or more frequent words have been discovered on theline), a cluster candidate is formed. If the cluster candidate isnot present in the candidate table, it will be inserted into thetable with the support value 1, otherwise its support value willbe incremented. In both cases, the line is assigned to thecluster candidate. The cluster candidate is formed in thefollowing way: if the line belongs to m dense 1-regions thathave fixed attributes (i1,v1),.,(im,vm), then the clustercandidate is a region with the set of fixed attributes{(i1,v1),.,(im,vm)}. For example, if the line is Connection from192.168.1.1, and there exist a dense 1-region with the fixedattribute (1, 'Connection') and another dense 1-region with thefixed attribute (2, 'from'), then a region with the set of fixedattributes {(1, 'Connection'), (2, 'from')} becomes the clustercandidate.During the final step of the algorithm, the candidate table isinspected, and all regions with support values equal or greaterthan the support threshold value (i.e., regions that areguaranteed to be dense) are reported by the algorithm asclusters. Because of the definition of a region, each clustercorresponds to a certain line pattern, e.g., the cluster with theset of fixed attributes {(1, 'Password'), (2, 'authentication'),(3, 'for'), (5, 'accepted')} corresponds to the line patternPasswordauthentication for * accepted.Thus, the algorithm can report clusters in a concise way byjust printing out line patterns, without reporting individuallines that belong to each cluster. The CLIQUE algorithmreports clusters in a similar manner [15].The first step of the algorithm reminds very closely thepopular Apriori algorithm for mining frequent itemsets [18],since frequent words can be viewed as frequent 1-itemsets.Then, however, our algorithm takes a rather differentapproach, generating all cluster candidates at once. There areseveral reasons for that. Firstly, Apriori algorithm is expensivein terms of runtime [19, 20], since the candidate generationand testing involves exponential complexity. Secondly, sinceone of the properties of log file data is that there are manystrong correlations between frequent words, it makes littlesense to test a potentially huge number of frequent wordcombinations that are generated by Apriori, while only arelatively small number of combinations are present in thedata set. It is much more reasonable to identify the existingcombinations during a single pass over the data, and verifyafter the pass which of them correspond to clusters.It should be noted that since Apriori uses level-wisecandidate generation, it is able to detect patterns that ouralgorithm does not report. E.g., if words A, B, C, and D arefrequent, and the only combinations of them in the data set areA B C and A B D, then our algorithm will not inspect thepattern A B, although it could have the required support. Onthe other hand, by restricting the search our algorithm avoidsreporting all subsets of a frequent itemset that can easilyoverwhelm the user, but rather aims at detecting maximalfrequent itemsets only (several pattern-mining algorithms likeMax-Miner [19] use the similar approach).In order to compare the runtimes of our algorithm andApriori-based algorithm, we implemented both algorithms inPerl and tested them against three small log file data sets.Table 2 presents the results of our tests that were conducted on1,5GHz Pentium4 workstation with 256MB of memory andRedhat 8.0 Linux as operating system (the sizes of log files A,B, and C were 180KB, 1814KB, and 4005KB, respectively).The results obtained show that our clustering algorithm issuperior to the Apriori-based clustering scheme in terms ofruntime cost. The results also indicate that Apriori-basedclustering schemes are appropriate only for small log file datasets and high support thresholds.
TABLE II.Our algorithm for ASupport threshold50%1 secondTHE RUNTIME COMPARISON OF OUR ALGORITHM AND APRIORI-BASED ALGORITHMSupport threshold25%1 secondSupport threshold10%1 secondSupport threshold 5%Support threshold 1%2 seconds2 secondsApriori for A2 seconds16 seconds96 seconds145 seconds5650 secondsOur algorithm for B5 seconds5 seconds5 seconds6 seconds6 secondsApriori for B9 seconds28 seconds115 seconds206 seconds2770 secondsOur algorithm for C10 seconds10 seconds12 seconds12 seconds13 secondsApriori for C182 seconds182 seconds18950 seconds29062 seconds427791 secondsAlthough our algorithm makes just two passes over the dataand is therefore fast, it could consume a lot of memory whenapplied to a larger data set. In the next subsection we willdiscuss the memory cost issues in more detail.C. The Memory Cost of The AlgorithmIn terms of memory cost, the most expensive part of thealgorithm is the first step when the data summary is built.During the data summarization, the algorithm seeks forfrequent words in the data set, by splitting each line intowords. For each word, the algorithm checks whether the wordis present in the word table (or vocabulary), and if it isn't, itwill be inserted into the vocabulary with its occurrencecounter set to 1. If the word is present in the vocabulary, itsoccurrence counter will be incremented.If the vocabulary is built for a large data set, it is likely toconsume a lot of memory. When vocabularies were built fordata sets from Table 1, we discovered that they consumedhundreds of megabytes of memory, with the largestvocabulary occupying 653 MB (the tests were made on SunFire V480 server with 4 GB of memory, and each vocabularywas implemented as a move-to-front hash table which is anefficient data structure for accumulating words [21]). As thesize of the data set grows to tens or hundreds of gigabytes, thesituation is very likely to deteriorate further, and thevocabulary could not fit into the main memory anymore.On the other hand, one of the properties of log file data isthat a majority of the words are very infrequent. Therefore,storing those very infrequent words to memory is a waste ofspace. Unfortunately, it is impossible to predict during thevocabulary construction which words will finally beinfrequent.In order to cope with this problem, we use the followingtechnique - we first estimate which words need not to bestored in memory, and then create the vocabulary withoutirrelevant words in it. Before the data pass is made forbuilding the vocabulary, the algorithm makes an extra passover the data and builds a word summary vector. The wordsummary vector is made up of m counters (numbered from 0to m-1) with each counter initialized to zero. During the passover the data, a fast string hashing function is applied to eachword. The function returns integer values from 0 to m-1, andeach time the value i is calculated for a word, the i-th counterin the vector will be incremented. Since efficient stringhashing functions are uniform [22], i.e., the probability of anarbitrary string hashing to a given value i is 1/m, then eachcounter in the vector will correspond roughly to W / m words,where W is the number of different words in the data set. Ifwords w1,.,wk are all words that hash to the value i, and thewords w1,.,wk occur t1,.,tk times, respectively, then the valueof the i-th counter in the vector equals to the sum t1 . tk.After the summary vector has been constructed, thealgorithm starts building the vocabulary, but only those wordswill be inserted into the vocabulary for which their countervalues are equal or greater than the support threshold valuegiven by the user. Words that do not fulfill this criterion can'tbe frequent, because their occurrence times are guaranteed tobe below the support threshold.Given that a majority of the words are very infrequent, thissimple technique is quite powerful. If the vector is largeenough, a majority of the counters in the vector will have veryinfrequent words associated with them, and therefore manycounter values will never cross the support threshold.In order to measure the effectiveness of the word summaryvector technique, we made a number of experiments with datasets from Table 1. We used the support thresholds of 1%,0.1%, and 0.01% together with the vectors of 5,000, 20,000,and 100,000 counters, respectively (each counter consumed 4bytes of memory). The experiments suggest that theemployment of the word summary vector dramatically reducesvocabulary sizes, and large amounts of memory will be saved.During the experiments, vocabulary sizes decreased9.93-99.36 times, and 32.74 times as an average. On the otherhand, the memory requirements for storing the vectors wererelatively small - the largest vector we used during theexperiments occupied less than 400 KB of memory.If the user has specified a very low support threshold, therecould be a large number of cluster candidates with very smallsupport values, and the candidate table could consume asignificant amount of memory. In order to avoid this, thesummary vector technique can also be applied to clustercandidates – before the candidate table is built, the algorithmmakes an extra pass over the data and builds a summaryvector for candidates, which is later used to reduce the numberof candidates inserted into the candidate table.IV. SIMPLE LOGFILE CLUSTERING TOOLIn order to implement the log file clustering algorithmdescribed in the previous section, an experimental tool calledSLCT (Simple Logfile Clustering Tool) has been developed.SLCT has been written in C and has been primarily used onRedhat 8.0 Linux and Solaris8, but it should compile and workon most modern UNIX platforms.
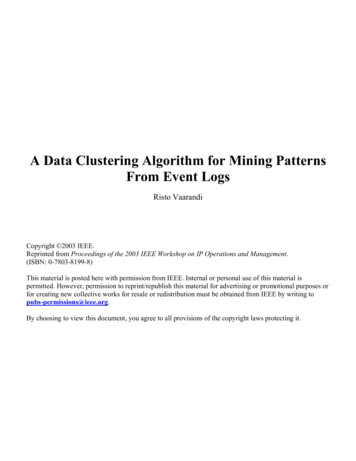
SLCT uses move-to-front hash tables for implementing thevocabulary and the candidate table. Experiments with largevocabularies have demonstrated that move-to-front hash tableis an efficient data structure with very low data access times,even when the hash table is full and many words areconnected to each hash table slot [21]. Since the speed of thehashing function has a critical importance for the efficiency ofthe hash table, SLCT employs the fast and efficient Shift-AddXor string hashing algorithm [22]. This algorithm is not onlyused for hash table operations, but also for building summaryvectors.SLCT is given a list of log files and a support threshold asinput, and after it has detected a clustering on input data, itreports clusters in a concise way by printing out line patternsthat correspond to clusters, e.g.,Dec 18 * myhost.mydomain * connect fromDec 18 * myhost.mydomain * log: Connection from * portDec 18 * myhost.mydomain * log: slct-0.01/slct -o outliers -r -s 8% myhost.mydomain-logDec 18 * myhost.mydomain sshd[*]: connect from 172.26.242.178Support: 262Dec 18 * myhost.mydomain sshd[*]: log: Connection from172.26.242.178 port *S
Although data clustering algorithms provide the user a valuable insight into event logs, they have received little attention in the context of system and network management. In this paper, we discuss existing data clustering algorithms, and propose a new clustering algorithm for mining line patterns from log files. We also present an experimental