Transcription
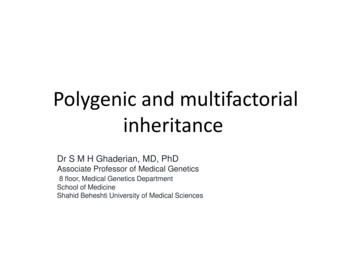
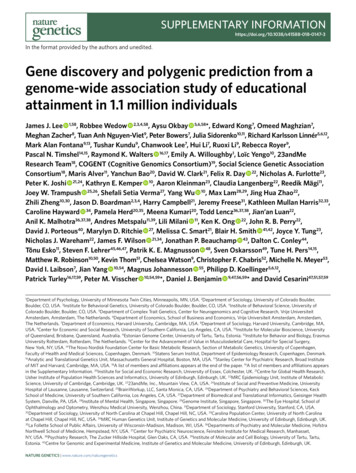
ArticleThe Polygenic and Monogenic Basis of Blood Traitsand DiseasesGraphical AbstractAuthorsDragana Vuckovic, Erik L. Bao,Parsa Akbari, ., Guillaume Lettre,Vijay G. Sankaran, Nicole SoranzoBCXPopulation-level GWAS29 blood cellphenotypesOmnigenic/Infinitesimalmodel evaluationFunctional variantinterpretationStatistical fine-mappingCell state chromatinmappingPolygenic modificationof blood disease riskCorrespondencens6@sanger.ac.uk (N.S.),sankaran@broadinstitute.org (V.G.S.)In BriefAnalysis of blood cell traits in the UKBiobank and other cohorts illuminates thefull genetic architecture of hematopoieticphenotypes, with evidence supportingthe omnigenic model for complex traitsand linking polygenic burden withmonogenic blood diseases.C/AHighlightsdLargest genome-wide association study of blood cell traitsto datedEmpiric assessments of omnigenic and infinitesimal modelsof polygenic variationdFunctional insights into how genetic variants impact humanhematopoiesisdAssessment of the effect of polygenic trait scores uponblood diseasesVuckovic et al., 2020, Cell 182, 1214–1231September 3, 2020 ª 2020 The Authors. Published by Elsevier Inc.https://doi.org/10.1016/j.cell.2020.08.008ll
llOPEN ACCESSArticleThe Polygenic and Monogenic Basisof Blood Traits and DiseasesDragana Vuckovic,1,2,101 Erik L. Bao,4,5,6,101 Parsa Akbari,7,2,8,1,101 Caleb A. Lareau,4,5,101 Abdou Mousas,9 Tao Jiang,7,10Ming-Huei Chen,11,12 Laura M. Raffield,13 Manuel Tardaguila,1 Jennifer E. Huffman,14 Scott C. Ritchie,15,16,7,17,10Karyn Megy,18,19,20 Hannes Ponstingl,1 Christopher J. Penkett,19,18 Patrick K. Albers,1 Emilie M. Wigdor,1Saori Sakaue,21,22 Arden Moscati,23 Regina Manansala,24 Ken Sin Lo,9 Huijun Qian,25 Masato Akiyama,22,26Traci M. Bartz,27 Yoav Ben-Shlomo,28 Andrew Beswick,29 Jette Bork-Jensen,30 Erwin P. Bottinger,31,23Jennifer A. Brody,32 Frank J.A. van Rooij,33 Kumaraswamy N. Chitrala,34 Peter W.F. Wilson,35 Hélène Choquet,36(Author list continued on next page)1HumanGenetics, Wellcome Sanger Institute, Hinxton, CB10 1SA, UKInstitute for Health Research Blood and Transplant Research Unit (NIHR BTRU) in Donor Health and Genomics, University ofCambridge, Cambridge, CB1 8RN, UK3Department of Epidemiology, University of Washington, Seattle, WA, 98109, USA4Division of Hematology/Oncology, Boston Children’s Hospital and Department of Pediatric Oncology, Dana-Farber Cancer Institute, HarvardMedical School, Boston, MA, 02115, USA5Broad Institute of MIT and Harvard, Cambridge, MA, 02142, USA6Harvard-MIT Health Sciences and Technology, Harvard Medical School, Boston, MA, 02142, USA7Department of Public Health and Primary Care, British Heart Foundation Cardiovascular Epidemiology Unit, University of Cambridge,Cambridge, CB1 8RN, UK8MRC Biostatistics Unit, University of Cambridge, Cambridge, CB2 0SR, UK9Montreal Heart Institute, Montreal, Quebec, H1T 1C8, Canada10National Institute for Health Research Cambridge Biomedical Research Centre, University of Cambridge and Cambridge UniversityHospitals, Cambridge, CB2 0QQ, UK11The Framingham Heart Study, National Heart, Lung and Blood Institute, Framingham, MA, 01702, USA12Population Sciences Branch, Division of Intramural Research, National Heart, Lung and Blood Institute, Framingham, MA, 01702, USA13Department of Genetics, University of North Carolina, Chapel Hill, NC, 27599, USA14Center for Population Genomics, Massachusetts Veterans Epidemiology Research and Information Center (MAVERIC), VA BostonHealthcare System, Boston, MA, 02130, USA15Department of Public Health and Primary Care, Cambridge Baker Systems Genomics Initiative, University of Cambridge, Cambridge, CB18RN, UK2National(Affiliations continued on next page)SUMMARYBlood cells play essential roles in human health, underpinning physiological processes such as immunity, oxygen transport, and clotting, which when perturbed cause a significant global health burden. Here we integratedata from UK Biobank and a large-scale international collaborative effort, including data for 563,085 Europeanancestry participants, and discover 5,106 new genetic variants independently associated with 29 blood cellphenotypes covering a range of variation impacting hematopoiesis. We holistically characterize the genetic architecture of hematopoiesis, assess the relevance of the omnigenic model to blood cell phenotypes, delineaterelevant hematopoietic cell states influenced by regulatory genetic variants and gene networks, identify novelsplice-altering variants mediating the associations, and assess the polygenic prediction potential for bloodtraits and clinical disorders at the interface of complex and Mendelian genetics. These results show the powerof large-scale blood cell trait GWAS to interrogate clinically meaningful variants across a wide allelic spectrumof human variation.INTRODUCTIONA major aspiration in human genetics is to understand how genetic variation impacts complex traits and diseases. Recentgenome-wide association studies (GWAS) have identified thousands of genetic variants associated with complex phenotypesand provided insights into their genetic architecture. This hasled to the recognition that complex trait heritability is polygenic,1214 Cell 182, 1214–1231, September 3, 2020 ª 2020 The Authors. Published by Elsevier Inc.This is an open access article under the CC BY license (http://creativecommons.org/licenses/by/4.0/).
llArticleOPEN ACCESSJohn Danesh,7,37,2,1,10,38 Emanuele Di Angelantonio,7,37,2,1,10,38 Niki Dimou,39,40 Jingzhong Ding,41 Paul Elliott,42,43,44,45,46Tõnu Esko,5 Michele K. Evans,34 Stephan B. Felix,47,48 James S. Floyd,32,49 Linda Broer,50 Niels Grarup,30Michael H. Guo,5,51 Qi Guo,7 Andreas Greinacher,52 Jeff Haessler,53 Torben Hansen,30 Joanna M.M. Howson,7,10,54Wei Huang,55 Eric Jorgenson,36 Tim Kacprowski,56,57,48 Mika Kähönen,58,59 Yoichiro Kamatani,22,60 Masahiro Kanai,22,61Savita Karthikeyan,7 Fotios Koskeridis,40 Leslie A. Lange,62 Terho Lehtimäki,63,64 Allan Linneberg,65,66 Yongmei Liu,67Leo-Pekka Lyytikäinen,63,64 Ani Manichaikul,68 Koichi Matsuda,69 Karen L. Mohlke,13 Nina Mononen,63,64Yoshinori Murakami,70 Girish N. Nadkarni,23 Kjell Nikus,71,72 Nathan Pankratz,73 Oluf Pedersen,30 Michael Preuss,23Bruce M. Psaty,74,32,75,76 Olli T. Raitakari,77,78,79 Stephen S. Rich,68 Benjamin A.T. Rodriguez,11,12 Jonathan D. Rosen,8016CambridgeBaker Systems Genomics Initiative, Baker Heart and Diabetes Institute, Melbourne, Victoria, VIC 3004, AustraliaHeart Foundation Centre of Excellence, Division of Cardiovascular Medicine, Addenbrooke’s Hospital, Cambridge, CB2 0QQ, UK18Department of Haematology, University of Cambridge, Cambridge, CB2 0PT, UK19National Institute for Health Research (NIHR) BioResource, Cambridge University Hospitals, Cambridge, CB2 0PT, UK20National Health Service (NHS) Blood and Transplant, Cambridge Biomedical Campus, Cambridge, CB2 0PT, UK21Department of Statistical Genetics, Osaka University Graduate School of Medicine, Suita, Osaka, 565-0871, Japan22Laboratory for Statistical Analysis, RIKEN Center for Integrative Medical Sciences, Yokohama, Kanagawa, 230-0045, Japan23Icahn School of Medicine at Mount Sinai, The Charles Bronfman Institute for Personalized Medicine, New York, NY, 10029, USA24Zilber School of Public Health, University of Wisconsin-Milwaukee, Milwaukee, WI, 53201, USA25Department of Statistics and Operation Research, University of North Carolina, Chapel Hill, NC, 27599, USA26Department of Ocular Pathology and Imaging Science, Graduate School of Medical Sciences, Kyushu University, Fukuoka, 812-8581,Japan27Department of Biostatistics, University of Washington, Seattle, WA, 98101, USA28Population Health Sciences, Bristol Medical School, University of Bristol, Bristol, BS8 1QU, UK29Translational Health Sciences, Musculoskeletal Research Unit, Bristol Medical School, University of Bristol, Bristol, BS10 5NB, UK30Novo Nordisk Foundation Center for Basic Metabolic Research, Faculty of Health and Medical Sciences, University of Copenhagen,Copenhagen, 2200, Denmark31Hasso-Plattner-Institut, Universität Potsdam, Potsdam, 14469, Germany32Department of Medicine, University of Washington, Seattle, WA, 98101, USA33Department of Epidemiology, Erasmus University Medical Center Rotterdam, Rotterdam, 3015 GE, the Netherlands34Laboratory of Epidemiology and Population Science, National Institute on Aging/NIH, Baltimore, MD, 21224, USA35Atlanta VA Medical Center, Decatur, GA, 30033, USA36Division of Research, Kaiser Permanente Northern California, Oakland, CA, 94612, USA37Health Data Research UK Cambridge, Wellcome Genome Campus and University of Cambridge, Cambridge, CB10 1SA, UK38British Heart Foundation Centre of Research Excellence, University of Cambridge, Cambridge, CB1 8RN, UK39Section of Nutrition and Metabolism, International Agency for Research on Cancer, Lyon, 69008, France40Department of Hygiene and Epidemiology, University of Ioannina Medical School, Ioannina, 45110, Greece41Department of Internal Medicine, Section of Gerontology and Geriatric Medicine, Wake Forest School of Medicine, Winston-Salem, NC,27101, USA42Department of Epidemiology and Biostatistics, Imperial College London, London, W2 1PG, UK43Imperial Biomedical Research Centre, Imperial College London and Imperial College NHS Healthcare Trust, London, W2 1NY, UK44Medical Research Council Centre for Environment and Health, Imperial College London, London, W2 1PG, UK45UK Dementia Research Institute, Imperial College London, London, WC1E 6BT, UK46Health Data Research UK London, London, W2 1PG, UK47Department of Internal Medicine B, University Medicine Greifswald, Greifswald, 17475, Germany48German Center for Cardiovascular Research (DZHK), Partner Site Greifswald, Greifswald, 17475, Germany49Department of Epidemiology, University of Washington, Seattle, WA, 98101, USA50Department of Internal Medicine, Erasmus University Medical Center Rotterdam, Rotterdam, 3015 GE, the Netherlands51Department of Neurology, University of Pennsylvania, Philadelphia, PA, 19104, USA52Institute for Immunology and Transfusion Medicine, University Medicine Greifswald, Greifswald, 17475, Germany53Division of Public Health Sciences, Fred Hutchinson Cancer Research Center, Seattle, WA, 98101, USA54Novo Nordisk Research Centre Oxford, Oxford, OX3 7FZ, UK55Department of Genetics, Shanghai-MOST Key Laboratory of Health and Disease Genomics, Chinese National Human Genome Center andShanghai Industrial Technology Institute (SITI), Shanghai, 201203, China56Interfaculty Institute of Genetics and Functional Genomics, University Medicine Greifswald, Greifswald, 17475, Germany57Chair of Experimental Bioinformatics, Research Group Computational Systems Medicine, Technical University of Munich,Freising-Weihenstephan, 85354, Germany58Department of Clinical Physiology, Tampere University Hospital, Tampere, 33521, Finland59Department of Clinical Physiology, Finnish Cardiovascular Research Center - Tampere, Faculty of Medicine and Health Technology,Tampere University, Tampere, 33014, Finland17Britishresulting from the cumulative effects of many genetic locithroughout the genome, each of modest effect size (Visscheret al., 2017; Timpson et al., 2018).Hematopoiesis is a valuable paradigm for studying complextrait genetic architecture, since blood cell phenotypes arecommonly measured in large population-based studies and theCell 182, 1214–1231, September 3, 2020 1215
llOPEN ACCESSArticleJerome I. Rotter,81 Petra Schubert,82 Cassandra N. Spracklen,13,83 Praveen Surendran,7,38,84,85 Hua Tang,86Jean-Claude Tardif,9,87 Mohsen Ghanbari,33,88 Uwe Völker,56,48 Henry Völzke,89,48 Nicholas A. Watkins,20Stefan Weiss,56,48 VA Million Veteran Program100, Na Cai,1 Kousik Kundu,1,18 Stephen B. Watt,1 Klaudia Walter,1Alan B. Zonderman,34 Kelly Cho,82,91,92 Yun Li,80,13,93 Ruth J.F. Loos,23 Julian C. Knight,94 Michel Georges,95Oliver Stegle,96 Evangelos Evangelou,42,40 Yukinori Okada,21,97 David J. Roberts,98,99 Michael Inouye,15,16,7,38,10,37,90Andrew D. Johnson,11,12 Paul L. Auer,24 William J. Astle,8,2,20 Alexander P. Reiner,3 Adam S. Butterworth,7,37,2,1,10,38Willem H. Ouwehand,18,20,1,2,38 Guillaume Lettre,9,87 Vijay G. Sankaran,4,5,102,* and Nicole Soranzo1,2,17,18,102,103,*60Laboratoryof Complex Trait Genomics, Department of Computational Biology and Medical Sciences, Graduate School of FrontierSciences, The University of Tokyo, Tokyo, 108-8639, Japan61Analytic and Translational Genetics Unit, Massachusetts General Hospital, Boston, MA, 02114, USA62Department of Medicine, University of Colorado Denver, Anschutz Medical Campus, Aurora, CO, 80045, USA63Department of Clinical Chemistry, Fimlab Laboratories, Tampere, 33520, Finland64Department of Clinical Chemistry, Finnish Cardiovascular Research Center - Tampere, Faculty of Medicine and Health Technology,Tampere University, Tampere, 33014, Finland65Center for Clinical Research and Prevention, Bispebjerg and Frederiksberg Hospital, Frederiksberg, 2000, Denmark66Department of Clinical Medicine, Faculty of Health and Medical Sciences, University of Copenhagen, Copenhagen, 2200, Denmark67Department of Medicine, Division of Cardiology, Duke Molecular Physiology Institute, Duke University Medical Center, Durham, NC, 27701, USA68Center for Public Health Genomics, University of Virginia, Charlottesville, VA, 22903, USA69Department of Computational Biology and Medical Sciences, Graduate school of Frontier Sciences, The University of Tokyo, Tokyo, 108-8639,Japan70Division of Molecular Pathology, The Institute of Medical Science, The University of Tokyo, Tokyo, 108-8639, Japan71Department of Cardiology, Heart Center, Tampere University Hospital, Tampere, 33521, Finland72Department of Cardiology, Finnish Cardiovascular Research Center - Tampere, Faculty of Medicine and Health Technology, TampereUniversity, Tampere, 33014, Finland73Department of Laboratory Medicine and Pathology, University of Minnesota, Minneapolis, MN, 55455, USA74Departments of Epidemiology, University of Washington, Seattle, WA, 98101, USA75Department of Health Services, University of Washington, Seattle, WA, 98101, USA76Kaiser Permanente Washington Health Research Institute, Seattle, WA, 98101, USA77Centre for Population Health Research, University of Turku and Turku University Hospital, Turku, 20521, Finland78Research Centre of Applied and Preventive Cardiovascular Medicine, University of Turku, Turku, 20521, Finland79Department of Clinical Physiology and Nuclear Medicine, Turku University Hospital, Turku, 20521, Finland80Department of Biostatistics, University of North Carolina, Chapel Hill, NC, 27599, USA81Department of Pediatrics, The Institute for Translational Genomics and Population Sciences, The Lundquist Institute for Biomedical Innovation(formerly Los Angeles Biomedical Research Institute) at Harbor-UCLA Medical Center, Torrance, CA, 90502, USA82Massachusetts Veterans Epidemiology Research and Information Center (MAVERIC), VA Boston Healthcare System, Boston, MA, 02130, USA83Department of Biostatistics and Epidemiology, University of Massachusetts-Amherst, Amherst, MA, 01002, USA84Health Data Research UK Cambridge, Wellcome Sanger Institute, Hinxton, CB10 1SA, UK85Department of Public Health and Primary Care, Rutherford Fund Fellow, University of Cambridge, Cambridge, CB1 8RN, UK86Department of Genetics, Stanford University School of Medicine, Stanford, CA, 94305, USA87Department of Medicine, Faculty of Medicine, Université de Montréal, Montreal, Quebec, H3T 1J4, Canada88Department of Genetics, School of Medicine, Mashhad University of Medical Sciences, Mashhad, 9177948564, Iran89Institute for Community Medicine, University Medicine Greifswald, Greifswald, 17475, Germany90The Alan Turing Institute, London, NW1 2DB, UK91Department of Medicine, Division on Aging, Brigham and Women’s Hospital, Boston, MA, 02115, USA92Department of Medicine, Harvard Medical School, Boston, MA, 02115, USA93Department of Computer Science, University of North Carolina, Chapel Hill, NC, 27599, USA94Wellcome Centre for Human Genetics, University of Oxford, Oxford, OX3 7BN, UK95Unit of Animal Genomics, GIGA-R & Faculty of Veterinary Medicine, University of Liège, Liège, B-4000, Belgium96European Bioinformatics Institute, European Molecular Biology Laboratory, Hinxton, CB10 1SA, UK97Laboratory of Statistical Immunology, Osaka University Graduate School of Medicine, Suita, Osaka, 565-0871, Japan98BRC Haematology Theme and Radcliffe Department of Medicine, University of Oxford, John Radcliffe Hospital, Oxford, OX3 9DU, UK99NHSBT Blood and Transplant - Oxford Center, John Radcliffe Hospital, Oxford, OX3 9BQ, UK100A list of members and their affiliations appears in the Extended Acknowledgments and Author Contributions101These authors contributed equally102These authors contributed equally103Lead Contact*Correspondence: sankaran@broadinstitute.org (V.G.S.), ns6@sanger.ac.uk oduction of blood cells is a highly regulated, hierarchical, andintrinsic process that can be readily studied (Bao et al., 2019; Tardaguila and Soranzo, 2019). While there have been advances in1216 Cell 182, 1214–1231, September 3, 2020understanding genetic loci associated with blood cell production,the spectrum of human genetic variation impacting hematopoiesisremains incompletely defined.
llArticleMost variants contributing to complex trait heritability are noncoding and located in genomic regulatory regions within relevantcell types. The availability of epigenomic and transcriptomic profiles for hematopoietic stem and progenitor and lineagecommitted cells enable mechanistic dissection of the roles thatdifferent classes of genes have in hematopoiesis. Prior studiesof blood cell traits have suggested that master transcription factors (TFs) may be impacted by genetic variation (Ulirsch et al.,2019), and it is likely that further studies may uncover additionalroles for, and variation of, key hematopoietic regulators. Anotherpriority is to advance understanding of network connectivity between trait-associated genes and variants, and this understanding can be informed by theoretical models. Recently, an ‘‘omnigenic’’ model has been proposed in which two types of genes(‘‘core’’ versus ‘‘peripheral’’) differentially contribute to complextrait heritability (Boyle et al., 2017; Liu et al., 2019). However, theextent to which the omnigenic model applies to various complextraits and diseases remains unclear and controversial (Wrayet al., 2018).Finally, although rare variants with large effects generally donot individually contribute substantially to overall complex traitvariance, they can often highlight important biologic mechanisms and contribute to rare hematologic disorders, many ofwhich are characterized by variable penetrance or expressivity.In addition, polygenic contributions of many variants with smalleffects can yield disease risk odds ratios comparable to or largerthan that of known monogenic variants (Oetjens et al., 2019).Therefore, large population-based datasets can help to both reclassify the pathogenicity and penetrance of disease-associatedvariants, as well as understand the contribution of polygenic variation to the risk of blood diseases or as modifiers of rare variantsthat contribute to presumed monogenic blood disorders.RESULTSGenetic Variants Associated with Blood CountPhenotypesWe leveraged the power of the UK Biobank cohort to perform agenome-wide discovery analysis in N 408,112 participants ofEuropean ancestry, investigating 29 blood cell phenotypes (Table S1). In parallel, we also performed tests for genetic associations with a subset of 15 phenotypes available in an additional154,973 European ancestry participants from the Blood CellConsortium (BCX) (Figure 1A, Table S2). A separate analysis ofnon-European participants is reported in a companion paper(Chen et al., 2020). Overall, this discovery effort identified16,643 autosomal and 257 X-linked conditionally independent(Method Details) trait-variant associations from the first stagediscovery and an additional 141 from the BCX meta-analysis (Tables S3 and S4). The 16,900 associations were assigned to 7,122genomic loci (5,106 not described before) using a linkagedisequilibrium (LD) clumping approach (Astle et al., 2016).Each locus was represented by a unique tag variant (betweentag pairwise LD r2 % 0.8), and for simplicity, throughout the paper we use the term ‘‘sentinel variant’’ to refer to either a clumptag variant or a trait-specific conditionally independent signal.Overall, we nearly tripled the number of loci reported prior tothis study (Astle et al., 2016). We assessed replication ratesOPEN ACCESSacross three exemplar phenotypes (platelet count [PLT],lymphocyte count, and red blood cell count) for 210 variantson chromosome 1 in the Million Veteran Program (MVP, N 271,280). We found that nearly all of them had directionallyconcordant effect size estimates (Pearson’s R2 0.94; Figure S1A), and 196 (93%) variants replicated at a nominal significance threshold (p 0.05). The non-replicating ones exhibitedsimilar effect sizes as in the discovery cohort but lacked powerdue to MVP having less than half the sample size of the discoverycohort (Figure S1A, zoom-in panel). Using a Bayesian methodthat accounts for multiple independent signals (Benner et al.,2016) (Method Details, Figure 1B), we fine-mapped 3,100 (19%of 16,643 autosomal) associations to a single putative causativevariant ( 95% posterior probability [PPFM]) (Table S5), and morethan half of the associated signals (n 9,149, 55%) to fewer than10 variants (Figure 1C). As expected, rare signals are more likelyto be fine-mapped to smaller credible sets (Figure 1C). We assigned sentinels to genes using a stringent variant effect predictor (VEP) worst-consequence annotation (McLaren et al., 2016)to obtain a distribution of functional categories. Overall, 8,866sentinels (83%) were annotated to a gene using this approach,of which 69% were intronic, 24% were in regulatory regions,and 7% were in protein-coding regions (5.5% non-synonymousand 1.5% synonymous; Figure 1D). The credible set size distribution (number of variants per credible set) was consistentacross traits (Figure 1E).Genetic Architecture and Network Connectivity of BloodCell TraitsHematopoiesis is a finely tuned process involving coordinatedexpression of hundreds of genes, and it is likely that a subsetof the variants associated with peripheral blood cell countsand indices acts upon master regulators of this process. To identify whether genes discovered by GWAS identify networks ofcoregulated genes, we accessed a published coexpressionnetwork of 7,509 protein-coding genes expressed in wholeblood (Nath et al., 2017) (Figures 2A and 2B; Method Details). Under the stringent VEP worst-consequence criteria used earlier,25% of network genes (n 1,874 genes) were annotated to aGWAS signal. A more permissive VEP any-consequence criteriaannotated an additional 2.5% (27.5%, n 2,070) genes. When allgenes in the fine-mapping regions were considered ( 250-kbwindow), 78% of network genes could be linked to a GWAS locus, and 88% of sentinels were in proximity ( 250 kb) to anetwork gene, suggesting that genes linked to association signals are likely to be coregulated. Where possible, gene assignments were also validated using colocalization (Giambartolomeiet al., 2018) with (expression quantitative trait loci) cis-eQTLsderived from six trait-matched blood cell types (platelets n 424; CD19 B cells, CD8 T cells, CD4 T cells and CD15 neutrophils n 300; CD14 monocytes n 1,490). Across 667 colocalizing cis-eQTLs, eGenes matched VEP worst-consequencegenes in 65% of the cases (Figure S1B) and were contained infine-mapping regions in 97% of the cases (Kreuzhuber, 2019).Biological networks are organized hierarchically (Ravasz et al.,2002; Ravasz and Barabási, 2003; Carlson et al., 2006). Therecently proposed ‘‘omnigenic’’ model (Boyle et al., 2017; Liuet al., 2019) postulates that a small number of genes at the centerCell 182, 1214–1231, September 3, 2020 1217
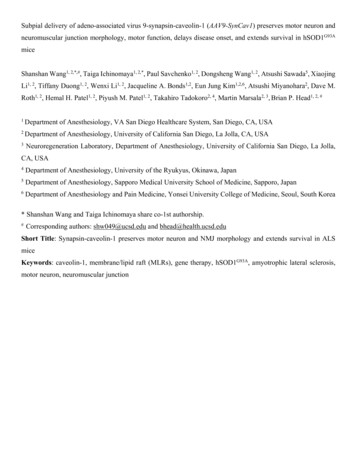
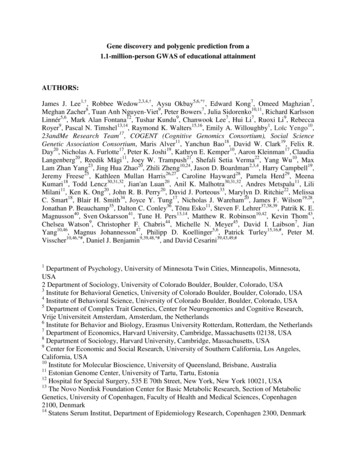
llOPEN ACCESSAArticleDEBCFigure 1. GWAS Study Design and Results(A–E) (A) Study design, (B) illustration for fine-mapping (FM) strategy showing how the FM blocks and the relevant number of causative signals were defined, (C)distribution of FM results by MAF, (D) distribution of FM results by sentinel annotation and MAF, and (E) FM 95% credible set size distribution for each sentinel,across all traits: different colors indicate different cell type groups.(or ‘‘core’’) of the network are directly implicated in diseases orphenotypes of interest, but the variants in these genes contributeonly a small proportion of the overall trait heritability. Most of thetrait heritability is attributable to a much larger number of ‘‘peripheral’’ gene variants with small effect sizes that contribute tosubtler physiological perturbations of phenotypes throughtrans-regulatory effects on core genes. We thus sought to empirically test the main assumptions of the omnigenic model,compared to a more continuous ‘‘infinitesimal’’ model of diseaseheritability (Wray et al., 2018) in order to inform its utility for disease gene discovery. We accessed a manually curated list ofgenes causative for stem cell and myeloid disorders (SMD, 206genes); bleeding, thrombotic, and platelet disorders (BPD, 104genes); and bone-marrow failure (BMF) syndromes (80 genes;Table S7) (Turro et al., 2020). GWAS loci for blood cell indicestended to be strongly enriched in and near Mendelian blood disorder genes (by 2.1-fold, p 1.9310 22), a phenomenon alreadydescribed for many complex traits (Gieger et al., 2011; Durand1218 Cell 182, 1214–1231, September 3, 2020and Rappold, 2013; Flannick et al., 2016). We then askedwhether these Mendelian genes had properties expected ofcore genes.A first assumption of the model is that core genes arestrongly enriched at the center of biological networks (Figure 2C). Overall, we observed strong enrichments of bothGWAS (fold enrichment [FE] 1.86, permutation p 10 4)and Mendelian (i.e., core, FE 3.86, p 10 4) genes in thefull blood coexpression network (Nath et al., 2017) comparedto permuted sets of protein-coding genes of similar size (Figure 2D; Table S6). Importantly, Mendelian genes had moreconnections in the coexpression network compared to other(non-Mendelian) genes, consistent with a centrality scenario(valid for coexpression cut-offs at 0.4–0.8, p ranging from4310 4 to 0.02, Wilcoxon test; Figure 2E). Finally, the expression of Mendelian genes was more correlated with other Mendelian genes (median coexpression coefficient 0.11) thanrandom sets of genes (median 0.095, p 0.007 permutation
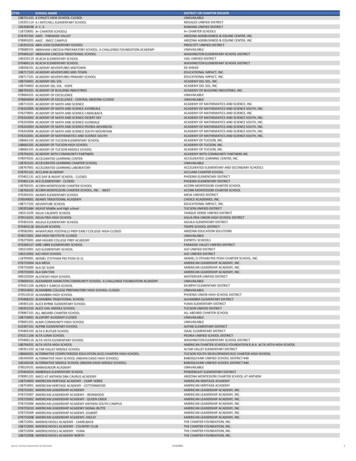
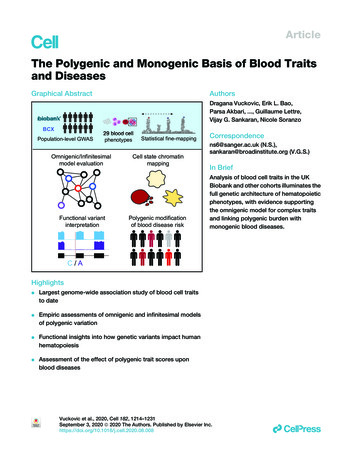
llOPEN ACCESSArticleACEBDFFigure 2. Network Connectivity(A–B) Coexpression network in whole blood. For illustrative purposes, a subset of highly coexpressed genes is shown (correlation 0.7). Edges are omitted forclarity, and the node size summarizes the number and strength of coexpression links. Blue dots represent genes detected by GWAS, violet dots are Mendeliangenes, and red dots show the intersection. Grey dots are genes in the coexpression network that do not belong to any of the previous categories. GWAS genesare defined by two different variant annotation approaches: VEP all consequences (A) and 500kb FM regions (B).(C) Diagram showing the hypothesized genetic architecture of healthy blood traits. At the core of the underlying molecular network is the set of Mendelian geneswhich cause blood disorders when mutated. Peripherally to the core lie regulatory genes which affect the phenotype through core genes. Cis and trans-eQTLscan give insights about cell-type specificity and can identify master regulators, i.e., genes that trans-regulate several core genes simultaneously.(D) Enrichment of sets of genes in the coexpression network at different correlation cut-offs. Whiskers indicate 95% CI for the fold enrichment estimate.(E) Proportion of network genes among Mendelian, GWAS, or other genes with 1 edge, or average number of edges, at different correlation cut-offs.(F) Example of a sub-network containing 3 Mendelian genes involved in platelets (GP9, ITGA2B, GP1BB). As in (A), blue dots are GWAS genes, red dots are GWASand previously known Mendelian genes, and gray dots are other coexpressed genes.test). A second assumption is that variants assigned to coregenes have larger effect sizes than peripheral genes. Whencompared to variants of comparable minor allele frequency(MAF) assigned to other genes, variants assigned to Mendelian genes (including previously unreported ones) showedsignificantly higher absolute effect sizes across all functionalcategories tested (fold change ranging from 1.87- to 2.73fold increase; Figure S1C). Third, core genes should bemore phenotype-specific as opposed to peripheral associations which act as regulators and could be shared acrossdifferent phenotypes. We show by quartile-quartile (Q-Q)plot enrichments that this pattern holds true for Mendelianversus peripheral blood traits associations in a selection ofeight non-blood related traits (Figure S2).The model also predicts that peripheral variants explain a largeproportion of trait heritability through trans-regulation of coregenes (Liu et al., 2019). To test this hypothesis, we accessed alarge set of recently reported blood trans-eQTLs (Võsa et al.,2018). Mendelian genes were strongly enriched as targets oftrans-eQTLs, compared to other GWAS genes (2.11-fold, Wilcoxon test, p 4.7310 5), after matching for expression levelsand trans-eQTL Z-scores to account for differences in detectionpower, with the caveat that there may be other unaccounted factors involved. At a correlation cut-off of 0.8, a coexpression subnetwork of 26 GWAS-associated genes was centered on threeknown Mendelian genes causative for spherocytosis (SLC4A1,EPB42) and congenital anemia (K
Yoshinori Murakami,70 Girish N. Nadkarni,23 Kjell Nikus,71,72 Nathan Pankratz,73 Oluf Pedersen,30 Michael Preuss,23 . Stefan Weiss,56,48 VA Million Veteran Program100, . Department of Computational Biology and Medical Sciences, Graduate School of Frontier Sciences, The University of Tokyo, Tokyo, 108-8639, Japan .