Transcription
Gene discovery and polygenic prediction from a1.1-million-person GWAS of educational attainmentAUTHORS:James J. Lee1,†, Robbee Wedow2,3,4,†, Aysu Okbay5,6,*†, Edward Kong7, Omeed Maghzian7,Meghan Zacher8, Tuan Anh Nguyen-Viet9, Peter Bowers7, Julia Sidorenko10,11, Richard KarlssonLinnér5,6, Mark Alan Fontana12, Tushar Kundu9, Chanwook Lee7, Hui Li7, Ruoxi Li9, RebeccaRoyer9, Pascal N. Timshel13,14, Raymond K. Walters15,16, Emily A. Willoughby1, Loïc Yengo10,23andMe Research Team17, COGENT (Cognitive Genomics Consortium), Social ScienceGenetic Association Consortium, Maris Alver11, Yanchun Bao18, David W. Clark19, Felix R.Day20, Nicholas A. Furlotte17, Peter K. Joshi19, Kathryn E. Kemper10, Aaron Kleinman17, ClaudiaLangenberg20, Reedik Mägi11, Joey W. Trampush21, Shefali Setia Verma22, Yang Wu10, MaxLam Zhan Yang23, Jing Hua Zhao20, Zhili Zheng10,24, Jason D. Boardman2,3,4, Harry Campbell19,Jeremy Freese25, Kathleen Mullan Harris26,27, Caroline Hayward28, Pamela Herd29, MeenaKumari18, Todd Lencz30,31,32, Jian'an Luan20, Anil K. Malhotra30,31,32, Andres Metspalu11, LiliMilani11, Ken K. Ong20, John R. B. Perry20, David J. Porteous33, Marylyn D. Ritchie22, MelissaC. Smart18, Blair H. Smith34, Joyce Y. Tung17, Nicholas J. Wareham20, James F. Wilson19,28,Jonathan P. Beauchamp35, Dalton C. Conley36, Tõnu Esko11, Steven F. Lehrer37,38,39, Patrik K. E.Magnusson40, Sven Oskarsson41, Tune H. Pers13,14, Matthew R. Robinson10,42, Kevin Thom43,Chelsea Watson9, Christopher F. Chabris44, Michelle N. Meyer45, David I. Laibson7, JianYang10,46, Magnus Johannesson47, Philipp D. Koellinger5,6, Patrick Turley15,16,#, Peter M.Visscher10,46,*#, Daniel J. Benjamin9,39,48,*#, and David Cesarini39,43,49,#1Department of Psychology, University of Minnesota Twin Cities, Minneapolis, Minnesota,USA2 Department of Sociology, University of Colorado Boulder, Boulder, Colorado, USA3Institute for Behavioral Genetics, University of Colorado Boulder, Boulder, Colorado, USA4Institute of Behavioral Science, University of Colorado Boulder, Boulder, Colorado, USA5Department of Complex Trait Genetics, Center for Neurogenomics and Cognitive Research,Vrije Universiteit Amsterdam, Amsterdam, the Netherlands6Institute for Behavior and Biology, Erasmus University Rotterdam, Rotterdam, the Netherlands7Department of Economics, Harvard University, Cambridge, Massachusetts 02138, USA8Department of Sociology, Harvard University, Cambridge, Massachusetts, USA9Center for Economic and Social Research, University of Southern California, Los Angeles,California, USA10Institute for Molecular Bioscience, University of Queensland, Brisbane, Australia11Estonian Genome Center, University of Tartu, Tartu, Estonia12Hospital for Special Surgery, 535 E 70th Street, New York, New York 10021, USA13The Novo Nordisk Foundation Center for Basic Metabolic Research, Section of MetabolicGenetics, University of Copenhagen, Faculty of Health and Medical Sciences, Copenhagen2100, Denmark14Statens Serum Institut, Department of Epidemiology Research, Copenhagen 2300, Denmark
15Analytic and Translational Genetics Unit, Massachusetts General Hospital, Boston,Massachusetts, USA16Stanley Center for Psychiatric Research, Broad Institute of MIT and Harvard, Cambridge,Massachusetts, USA1723andMe, Inc., Mountain View, California 94043, USA18Institute for Social and Economic Research, University of Essex, Colchester, UK19Centre for Global Health Research, Usher Institute of Population Health Sciences andInformatics, University of Edinburgh, Edinburgh, Scotland20MRC Epidemiology Unit, Institute of Metabolic Science, University of Cambridge,Cambridge, UK21BrainWorkup, LLC, Santa Monica, California, USA22Biomedical and Translational Informatics, Geisinger Health System, Lewisburg, Pennsylvania,USA23Institute of Mental Health, Singapore, Singapore24The Eye Hospital, School of Ophthalmology & Optometry, Wenzhou Medical University,Wenzhou, Zhejiang, China25Department of Sociology, Stanford University, Stanford, California, USA26Department of Sociology, University of North Carolina at Chapel Hill, Chapel Hill, NorthCarolina, USA27Carolina Population Center, University of North Carolina at Chapel Hill, Chapel Hill, NorthCarolina, USA28MRC Human Genetics Unit, Institute of Genetics and Molecular Medicine, University ofEdinburgh, Edinburgh, Scotland29La Follette School of Public Affairs, University of Wisconsin-Madison, Madison, Wisconsin,USA30Departments of Psychiatry and Molecular Medicine, Hofstra Northwell School of Medicine,Hempstead, New York, USA31Center for Psychiatric Neuroscience, Feinstein Institute for Medical Research, Manhasset,New York, USA32Psychiatry Research, The Zucker Hillside Hospital, Glen Oaks, California, USA33Centre for Genomic and Experimental Medicine, Institute of Genetics and MolecularMedicine, University of Edinburgh, Edinburgh, Scotland34Division of Population Health Sciences, Ninewells Hospital and Medical School, University ofDundee, Dundee, Scotland35Department of Economics, University of Toronto, Toronto, Ontario, Canada36Department of Sociology, Princeton University, Princeton, New Jersey, USA37Department of Policy Studies, Queen’s University, Kingston, Ontario, Canada38Department of Economics, New York University Shanghai, Pudong, Shanghai, China39National Bureau of Economic Research, Cambridge, MA, USA40Department of Medical Epidemiology and Biostatistics, Karolinska Institutet, Stockholm,Sweden41Department of Government, Uppsala University, Uppsala, Sweden42Department of Computational Biology, University of Lausanne, Lausanne, Switzerland43Department of Economics, New York University, New York, New York, USA44Autism and Developmental Medicine Institute, Geisinger Health System, Lewisburg,Pennsylvania, USA
45Center for Translational Bioethics and Health Care Policy, Geisinger Health System, Danville,Pennsylvania, USA46Queensland Brain Institute, University of Queensland, Brisbane, Australia47Department of Economics, Stockholm School of Economics, Stockholm, Sweden48Department of Economics, University of Southern California, Los Angeles, California, USA49Center for Experimental Social Science, New York University, New York, New York, USA† These authors contributed equally.# These authors jointly directed the work.* Correspondence to Daniel Benjamin, daniel.benjamin@gmail.com, Aysu Okbay,a.okbay@vu.nl, and Peter Visscher, p.visscher@imb.uq.edu.au.ABSTRACTWe conduct a large-scale genetic association analysis of educational attainment in a sample of 1.1 million individuals and identify 1,271 independent genome-wide significant loci. For theloci taken together, we find evidence of heterogeneous effects across environments. The lociimplicate genes involved in brain-development processes and neuron-to-neuron communication.In a separate analysis of the X chromosome, we identify 10 loci and estimate a SNP heritabilityof 0.3% in both men and women, consistent with partial dosage compensation. A joint (multiphenotype) analysis of educational attainment and three related cognitive phenotypes generatespolygenic scores that explain 11-13% of the variance in educational attainment and 7-10% of thevariance in cognitive performance. This prediction accuracy substantially increases the utility ofpolygenic scores as tools in research.
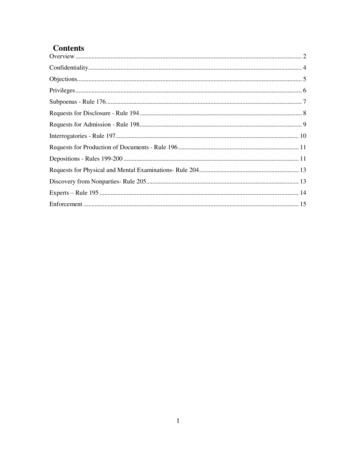
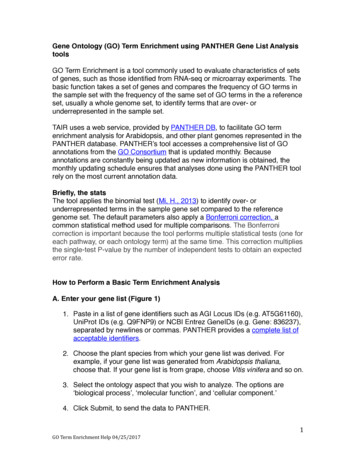
INTRODUCTIONEducational attainment (EA) is an important correlate of many social, economic, andhealth outcomes1,2. The largest GWAS of EA conducted to date identified 74 loci in a discoverysample of 293,723 individuals and reported that a 10-million-SNP polygenic score explained3.2% of the variance in independent samples3. Here, we report results from (i) a meta-analysisof EA based on a much larger sample of 1,131,881 individuals and (ii) joint (multi-trait) analysesof EA and three genetically correlated phenotypes: cognitive (test) performance (N 257,841),self-reported math ability (N 564,698), and hardest math class completed (N 430,445).RESULTSMain GWAS ResultsIn our primary GWAS, we study EA, which is measured as number of years of schoolingcompleted (EduYears). All association analyses were performed at the cohort level in samplesrestricted to European-descent individuals. We applied a uniform set of quality-controlprocedures to all cohort-level results. Our final sample-size-weighted meta-analysis producedassociation statistics for 10 million SNPs from phase 3 of the 1000 Genomes Project4.The quantile-quantile plot of the meta-analysis (Supplementary Figure 1.1) exhibitssubstantial inflation (λGC 2.04). According to our LD Score regression5 estimates, only a smallshare ( 5%) of this inflation is attributable to bias (Supplementary Figure 1.2). We used theestimated LD Score intercept (1.11) to generate inflation-adjusted test statistics. Fig. 1 shows theManhattan plot of the resulting P values. Overall, our meta-analysis identified 1,271approximately independent (pairwise R2 0.1) SNPs at genome-wide significance (P 5 10-8).Adjusted for winner’s curse, the median effect size for these SNPs corresponds to 1.7 weeks ofschooling per allele; at the 5th and 95th percentiles, 1.1 and 2.6 weeks, respectively.We examined the replicability of 162 single-SNP associations (P 5 10-8) from thecombined discovery and replication sample (N 405,073) of the largest previous study3. In thesubsample of our data (N 726,808) that did not contribute to the earlier study’s analyses, theSNPs replicate at a rate that closely matches theoretical projections that account for samplingvariation and winner’s curse (Supplementary Figure 1.4).To probe the robustness of our meta-analysis findings, we compared results from withinfamily association analyses conducted in four sibling cohorts to those from a meta-analysis thatexcluded the siblings. Our sample of 22,135 sibling pairs is too small to allow well-poweredwithin-family association analyses of single SNPs but large enough for joint analyses of the leadSNPs. We find greater sign concordance than expected if GWAS results were driven primarilyby stratification bias (Supplementary Figure 2.1; see Supplementary Note for a more detaileddiscussion).
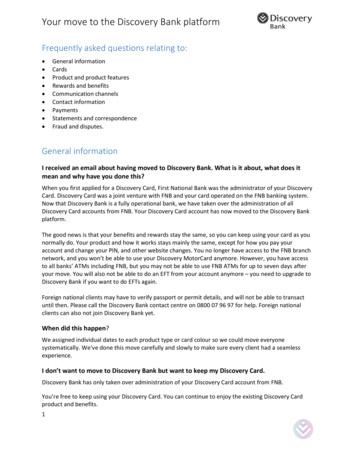
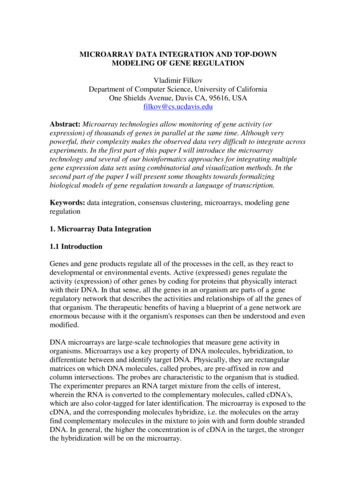
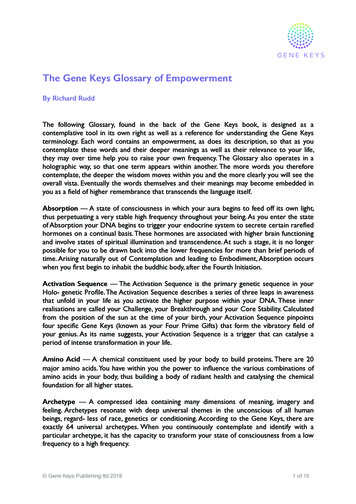
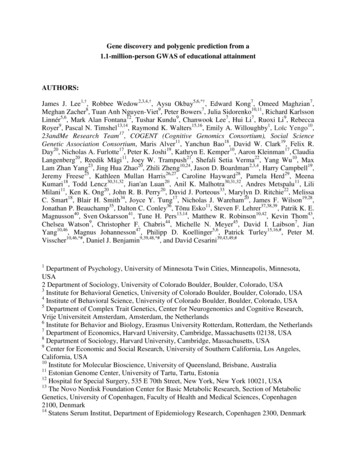
Because educational institutions vary across places and time, the effects of specific SNPsmay vary across environments. Consistent with such heterogeneity, we find that the inversevariance-weighted mean genetic correlation of EduYears across pairs of cohorts in our sample is0.72 (SE 0.14), which is statistically distinguishable from one (P value 0.03). Moreover, forthe lead SNPs, we reject the joint null hypothesis of homogeneous cohort-level effects (P value 9.7 10-12; Supplementary Figure 1.3).We supplemented our autosomal analyses with association analyses of SNPs on the Xchromosome. We first conducted separate association analyses of males (N 152,608) andfemales (N 176,750) in the UK Biobank, finding a male-female genetic correlation close tounity. We also find nearly identical SNP heritability estimates for men and women, which isconsistent with partial dosage compensation (i.e., on average the per-allele effect sizes aresmaller in women) and implies that any contribution of common variants on the X chromosometo sex differences in the normal-range variance of cognitive phenotypes6 is quantitativelynegligible. Next, we conducted a large (N 694,894) meta-analysis of summary statistics frommixed-sex analyses (Supplementary Figure 4.1). We identify 10 genome-wide significant lociand estimate SNP heritability due to the X chromosome of 0.3%. This heritability is lower thanthat expected for an autosome of similar length (Supplementary Figure 4.2, SupplementaryTable 4.3).Biological AnnotationFor biological annotation, we focus on the results from the autosomal meta-analysis ofEduYears. Across an extensive set of analyses (see Supplementary Figure 5.1 for a flowchart),all major conclusions from the largest previous GWAS of EA3 continue to hold but arestatistically stronger. For example, we applied the bioinformatics tool DEPICT7 and found that,relative to other genes, genes near our lead SNPs are overwhelmingly enriched for expression inthe central nervous system (Fig. 2A).There are also many novel findings associated with the large number of genes newlyimplicated by our analyses: At the standard false discovery rate (FDR) threshold of 5%, thebioinformatics tool DEPICT7 prioritizes 1,838 genes, a tenfold increase relative to the DEPICTresults from an earlier GWAS of EduYears3. In what follows, we distinguish between the 1,703“newly prioritized” genes and the 135 “previously prioritized” genes. The SOM contains anextensive analysis of many of the newly prioritized genes and their brain-related functions. Herewe highlight two especially noteworthy regularities. First, whereas previously prioritized genesexhibited especially high expression in the brain prenatally, newly prioritized genes showelevated levels of expression both pre- and postnatally (Fig. 2B). Many of the newly prioritizedgenes encode proteins that carry out online brain functions such as neurotransmitter secretion,the activation of ion channels and metabotropic pathways, and synaptic plasticity. For a numberof newly prioritized genes, Fig. 3 illustrates the crucial roles in cellular neurophysiology8 playedby their protein products in the postnatal brain.
Second, even though glial cells are at least as numerous as neurons in the human brain9,gene sets related to glial cells (astrocytes, myelination, and positive regulation of gliogenesis) areabsent from those identified as positively enriched (Supplementary Table 5.5). Furthermore,using stratified LD Score regression10, we estimated relatively weak enrichment of genes highlyexpressed in glial cells: 1.08-fold for astrocytes (P 0.07) and 1.09-fold for oligodendrocytes (P 0.06) versus 1.33-fold for neurons (P 2.89 10-11). Because myelination increases the speedwith which signals are transmitted along axons11, the absence of enrichment of genes related toglial cells may weigh against the hypothesis that differences across people in cognition aredriven by differences in transmission speed.The results also raise a number of possible targets for functional studies. Among SNPswithin 50 kb of lead SNPs, 127 of them are identified by the fine-mapping tool CAVIARBF12 aslikely causal SNPs (posterior probability 0.9). Eight of these are non-synonymous, and one ofthese (rs61734410) is located in CACNA1H, which encodes the pore-forming subunit of avoltage-gated calcium channel that has been implicated in the trafficking of NMDA-typeglutamate receptors13.Polygenic PredictionPolygenic predictors derived from earlier GWAS have proven to be a valuable tool forresearchers, especially in the social sciences14,15. We constructed polygenic scores for Europeanancestry individuals in two prediction cohorts: the National Longitudinal Study of Adolescent toAdult Health (Add Health, N 4,775), a representative sample of American adolescents; and theHealth and Retirement Study (HRS, N 8,609), a representative sample of Americans over age50. We measure prediction accuracy by the “incremental R2”: the gain in coefficient ofdetermination (R2) when the score is added as a covariate to a regression of the phenotype on aset of baseline controls (sex, age, and 10 principal components of the genetic relatedness matrix).All scores are based on results from a meta-analysis that excluded the prediction cohorts.Our first four scores were constructed from sets of LD-pruned SNPs associated with EduYears atvarious P-value thresholds: 5 10-8, 5 10-5, 5 10-3, and 1 (i.e., all SNPs). In both cohorts, thepredictive power is greater for scores constructed with less stringent thresholds (SupplementaryFigure 6.3). The (sample-size weighted) mean incremental R2 increases from 3.2% at P 5 10-8to 9.4% at P 1. Our fifth score was generated from HapMap3 SNPs using the softwareLDpred16. Rather than dropping SNPs in LD with each other, LDpred weights each SNP by (anapproximation to) its conditional effect, given other SNPs. This score had the greatestincremental R2: 11.4%. Hereafter, we focus on the LDpred score.To put the predictive power of this score in perspective, Fig. 4A shows the mean collegecompletion rate by polygenic-score quintile. The difference between the bottom and top quintilesin Add Health and HRS is, respectively, 45 and 36 percentage points (see SupplementaryFigure 6.4 for analogous analyses of high school completion and grade retention). Fig. 4B
compares the incremental R2 of the score to that of standard demographic variables. The score isa better predictor of EduYears than household income and a worse predictor than mother’s orfather’s education. Controlling for all the demographic variables jointly, the score’s incrementalR2 is 4.6% (Supplementary Figure 6.7). We also found that the score has substantial predictivepower for a variety of other cognitive phenotypes measured in the prediction cohorts(Supplementary Figure 6.1). For example, it explains 9.2% of the variance in overall gradepoint average in Add Health.Related Cognitive Phenotypes and MTAGWe also performed genome-wide association analyses of three complementaryphenotypes: cognitive performance (CP, N 257,841), self-reported math ability (Math Ability,N 564,698), and highest math class taken (Highest Math, N 430,445). For cognitiveperformance, we meta-analyzed published results from the COGENT Consortium17 with resultsbased on new analyses of the UKB. For the two math phenotypes, we studied new genome-wideanalyses in samples of research participants from 23andMe. All analyses and quality-controlprocedures were harmonized to ensure comparability with the EduYears GWAS. We identified225, 618, and 365 genome-wide significant loci with CP, Math Ability, and Highest Math,respectively (Supplementary Figures 1.5-1.7, Supplementary Tables 1.8-1.10).We conducted a multi-trait analysis of EduYears and our supplementary phenotypes tofurther improve prediction accuracy. These phenotypes are well suited to joint analysis becausetheir pairwise genetic correlations are high, in all cases exceeding 0.5 (Supplementary Table1.11). We applied a recently developed method, Multi-Trait Analysis of GWAS, or MTAG18, tosummary statistics from the four phenotypes (again excluding the prediction cohorts). MTAGallows for sample overlap across the phenotypes and generates phenotype-specific associationstatistics. For all four phenotypes, MTAG increases the number of loci identified at genomewide significance (Supplementary Figures 1.8-1.12, Supplementary Table 1.14). Forexample, MTAG identifies 661 loci associated with CP, and a host of follow-up analyses suggestthat the false discovery rate is low.Polygenic scores constructed from MTAG results are expected theoretically tooutperform corresponding scores based on GWAS results under general conditions. Fig. 4Cshows the incremental R2 for the polygenic scores based on GWAS and MTAG associationstatistics (but otherwise constructed using identical methods) when the target phenotype is eitherEduYears (left panel) or CP (right panel). For EduYears, relative to the GWAS score, the MTAGscore improves predictive power from 12.7% to 13.0% in Add Health and from 10.6% to 11.2%in the HRS. To measure prediction accuracy for cognitive performance, we used a thirdvalidation cohort, the Wisconsin Longitudinal Study (WLS), because it contains a measure withexcellent retest reliability and psychometric properties similar to those used in our discoveryGWAS of cognitive performance. In the WLS, the MTAG score predicts 9.7% of the variance inCP, a substantial improvement over the 7.0% predicted by the GWAS score—and approximately
double the prediction accuracy reported in three recent GWASs of cognitive performance19–21. InAdd Health, where our measure of cognitive performance is the respondent’s score on a test ofverbal cognition, the incremental R2s of the GWAS and MTAG scores are 5.1% and 6.9%,respectively.DISCUSSIONFor social science, the polygenic scores are the most important results of this paper. Withtheir levels of predictive power—11-13% and 7-10% of the variance of EA and cognitiveperformance, respectively—they will be useful across at least three types of applications. First, itis now possible to conduct well-powered studies of the mechanisms by which genetic factorsaffect EA by examining associations between the scores and high-quality measures ofendophenotypes in samples as small as those from laboratory experiments. Second, the polygenicscores can now generate non-trivial gains in statistical power when used as control variables inrandomized-controlled trials of expensive interventions that aim to improve academic andcognitive outcomes [see the calculations in the SOM of Rietveld et al.22]. Third, genetic effectson educational attainment and cognitive performance have repeatedly been found to vary acrossenvironmental contexts23,24, and the polygenic scores provide a new and powerful tool forresearchers interested in exploring such gene-environment interactions.CODE AVAILABILITY:All software used to perform these analyses are available online.URLs:Social Science Genetic Association Consortium (SSGAC) WLEDGMENTS:This research was carried out under the auspices of the Social Science Genetic AssociationConsortium (SSGAC). The research has also been conducted using the UK Biobank Resourceunder application numbers 11425 and 12512. This study was supported by funding from theRagnar Söderberg Foundation (E9/11, E24/15), the Swedish Research Council (421-2013-1061),The Jan Wallander and Tom Hedelius Foundation, an ERC Consolidator Grant (647648 EdGe),the Pershing Square Fund for Research onf the Foundations of Human Behavior, and theNIA/NIH through grants P01-AG005842, P01-AG005842-20S2, P30-AG012810, and T32AG000186-23 to NBER, and R01-AG042568 to USC. A full list of acknowledgments isprovided in the Supplementary Note.
CONTRIBUTOR LIST FOR THE 23andMe RESEARCH TEAM: Michelle Agee, BabakAlipanahi, Adam Auton, Robert K. Bell, Katarzyna Bryc, Sarah L. Elson, Pierre Fontanillas,Nicholas A. Furlotte, David A. Hinds, Bethann S. Hromatka, Karen E. Huber, Aaron Kleinman,Nadia K. Litterman, Matthew H. McIntyre, Joanna L. Mountain, Carrie A.M. Northover, J. FahSathirapongsasuti, Olga V. Sazonova, Janie F. Shelton, Suyash Shringarpure, Chao Tian, JoyceY. Tung, Vladimir Vacic, Catherine H. Wilson, and Steven J. Pitts.AUTHOR CONTRIBUTIONS: D.J.B., D.C., P.T., and P.M.V. designed and oversaw thestudy. A.O. was the study’s lead analyst, responsible for quality control and meta-analyses.Analysts who assisted A.O. in major ways include: E.K. (quality control), O.M. (COJO, MTAG,quality-control), T.A.N-V. (figure preparation), H.L. (quality control), C.L. (quality control), J.S.(UKB association analyses), and R.K.L. (UKB association analyses). P.B. and E.K. conductedthe within-family association analyses. The cross-cohort heritability and genetic-correlationanalyses were conducted by R.W. and M.Z. The analyses of the X chromosome in UK Biobankwere conducted by J.S.; A.O. ran the meta-analysis. J.J.L. organized and oversaw thebioinformatics analyses, with assistance from T.E., E.K., K.T., T.H.P., and P.N.T. Polygenicprediction analyses were designed and conducted by A.O., K.T., and R.W. Besides thecontributions explicitly listed above, T.K., R.L., and R.R. conducted additional analyses forseveral subsections. C.W. helped with coordinating among the participating cohorts. J.P.B.,D.C.C., T.E., M.J., J.J.L., P.D.K., D.I.L., S.F.L., S.O., M.R.R., K.T., and J.Y. provided helpfuladvice and feedback on various aspects of the study design. All authors contributed to andcritically reviewed the manuscript. E.K., J.J.L., and R.W. made especially major contributions tothe writing and editing.COMPETING FINANCIAL INTERESTS: The authors declare no competing financialinterests.REFERENCES1.Conti, G., Heckman, J. & Urzua, S. The Education-Health Gradient. Am. Econ. Rev. 100,234–238 (2010).2.Cutler, D. M. & Lleras-Muney, A. in Making Americans Healthier: Social and EconomicPolicy as Health Policy (eds. House, J., Schoeni, R., Kaplan, G. & Pollack, H.) (RussellSage Foundation, 2008).3.Okbay, A. et al. Genome-wide association study identifies 74 loci associated witheducational attainment. Nature 533, 539–542 (2016).
4.The 1000 Genomes Project Consortium. A global reference for human genetic variation.Nature 526, 68–74 (2015).5.Bulik-Sullivan, B. K. et al. LD Score regression distinguishes confounding frompolygenicity in genome-wide association studies. Nat. Genet. 47, 291–295 (2015).6.Johnson, W., Carothers, A. & Deary, I. J. Sex Differences in Variability in GeneralIntelligence: A New Look at the Old Question. Perspect. Psychol. Sci. 3, 518–531 (2008).7.Pers, T. H. et al. Biological interpretation of genome-wide association studies usingpredicted gene functions. Nat. Commun. 6, 5890 (2015).8.Fain, G. L. Molecular and Cellular Physiology of Neurons. (Harvard University Press).doi:10.1017/CBO9781107415324.0049.Azevedo, F. A. C. et al. Equal numbers of neuronal and nonneuronal cells make thehuman brain an isometrically scaled-up primate brain. J. Comp. Neurol. 513, 532–541(2009).10.Finucane, H. K. et al. Partitioning heritability by functional category using GWASsummary statistics. Nat. Genet. 47, 1228–1235 (2015).11.Reed, T. E. & Jensen, A. R. Arm nerve conduction velocity (NCV), brain NCV, reactiontime, and intelligence. Intelligence 15, 33–47 (1991).12.Chen, W., McDonnell, S. K., Thibodeau, S. N., Tillmans, L. S. & Schaid, D. J.Incorporating functional annotations for fine-mapping causal variants in a Bayesianframework using summary statistics. Genetics 204, 933–958 (2016).13.Wang, G. et al. CaV3.2 calcium channels control NMDA receptor-mediated transmission:a new mechanism for absence epilepsy. Genes Dev. 29, 1535–51 (2015).14.Domingue, B. W., Belsky, D. W., Conley, D., Harris, K. M. & Boardman, J. D. PolygenicInfluence on Educational Attainment: Polygenic Influence on Educational Attainment:New evidence from The National Longitudinal Study of Adolescent to Adult Health.AERA Open 1, 1–13 (2015).15.Belsky, D. W. et al. The Genetics of Success. Psychol. Sci. 27, 957–972 (2016).16.Vilhjálmsson, B. J. et al. Modeling linkage disequilibrium increases accuracy ofpolygenicrisk scores. Am. J. Hum. Genet. 97, 576–592 (2015).17.Trampush, J. W. et al. GWAS meta-analysis reveals novel loci and genetic correlates forgeneral cognitive function: a report from the COGENT consortium. Mol. Psychiatry 22,336–345 (2017).18.Turley, P. et al. MTAG: Multi-Trait Analysis of GWAS. Nat. Genet. in press, (2017).19.Sniekers, S. et al. Genome-wide association meta-analysis of 78,308 individuals identifiesnew loci and genes influencing human intelligence. Nat Genet 49, 1107–1112 (2017).20.Davies, G. et al. Ninety-nine independent genetic loci influencing general cognitivefunction include genes associated with brain health and structure (N 280,360). bioRxiv(2017). at 6511 21.Savage, J. E. et al. GWAS meta-analysis (N 279,930) identifies new genes and functional
links to intelligence. bioRxiv (2017). at 84853.1 22.Rietveld, C. A. et al. GWAS of 126,559 individuals identifies genetic variants associatedwith educational attainment. Science. 340, 1467–1471 (2013).23.Branigan, A. R. et al. Variation in the Heritability of Educational Attainment: AnInternational Meta-Analysis. Soc. Forces 92, 109–140 (2013).24.Heath, A. C. et al. Education policy and the heritability of educational attainment. Nature314, 734–736 (1985).25.Kang, H. J. et al. Spatio-temporal transcriptome of the human brain. Nature 478, 483–489(2011).
Fig. 1. Manhattan Plot for GWAS of EduYears (N 1,131,881). P values and the mean 𝜒𝜒 2shown in figure are based on inflation-adjusted test statistics. The x-axis is chromosomalposition, and the y-axis is the significance on a –log10 scale. The dashed line marks the thresholdfor genome-wide significance (P 5 10-8).
Fig. 2. Tissue-specific expression of genes in DEPICT-defined loci. (A) We took microarray measurements from the GeneExpression Omnibus7 and determined whether the genes overlapping EduYears-associated loci are significantly overexpressed(relative to genes in random sets of loci) in each of 180 tissues/cell types. These types are grouped in the figure by Medical SubjectHeadings (MeSH) first-level term. The y-axis is the one-sided P value from DEPICT on a –log10 scale. The 28 dark bars correspondto tissues/cell types in which the genes are significantly overexpressed (FDR 0.01), including all 22 classified as part of the centralnervous system (see Supplementary Table 5.1 for identifiers of all tissues/cell types). (B) Whereas genes prioritized by DEPICT in aprevious analysis based on a smaller sample3 tend to be more strongly expressed in the brain prenatally (red curve), the 1,703 newlyprioritized genes show a flat trajectory of expression across development (blue curve). Both groups of DEPICT-prioritized genes showelevated levels of expression relative to protein-coding genes that are not prioritized (gray curve). Analyses were based on RNA-seqdata from the BrainSpan Developmental Transcriptome25. Error bars represents 95% confidence intervals.(A)(B)
Fig. 3. Roles of selected newly prioritized genes involved in neuronal communication. The59 genes listed in the figure were selected as follows. We began with the 30 gene-set clusters inSupplementary Figure 5.2 and dropped those that include gene sets that were implicated in aprevious study of EduYears [Supplementary Table 4.5.1 of Okbay et al.3]. Of the 8 clusters thatremained, we retained the 4 related to neuronal communication (“DAG and IP3 signaling,”“associative learning,” “post NMDA recept
Estonian Genome Center, University of Tartu, Tartu, Estonia . 12. Hospital for Special Surgery, 535 E 70th Street, New York, New York 10021, USA . 13. The Novo Nordisk Foundation Center for Basic Metabolic Research, Section of Metabolic Genetics, University of Copenhagen, Faculty of Health and Medical Sciences, Copenhagen 2100, Denmark . 14