Transcription
Polygenic and multifactorialinheritanceDr S M H Ghaderian, MD, PhDAssociate Professor of Medical Genetics8 floor, Medical Genetics DepartmentSchool of MedicineShahid Beheshti University of Medical Sciences
Introduction Many disorders demonstrate familial clustering that does not conform to any recognizedpattern of Mendelian inheritance. As it is likely that many factors, both genetic and environmental, are involved in causingthese disorders, they are generally referred to as showing multifactorial inheritance. According to this theory, individuals are affected if they lie at the wrong end of thedistribution curve. This concept of a normal distribution generated by many genes, known as polygenes,each acting in an additive fashion, is plausible for physiological characteristics such asheight and possibly blood pressure.
Sequencing of the human genome has shown that the 3 billion base pairs are 99.9%identical in every person. This also means that individuals are, on average, 0.1% different genetically from everyother person on the planet. And within this 0.1% lies the mystery of why some people are more susceptible to aparticular illness, or more likely to be healthy, than other members of the population.
Disorders which show multifactorial inheritanceCongenital malformationsCleft lip/palateCongenital dislocation of the hipCongenital heart defectsNeural tube defectsPyloric stenosisTalipesAcquired diseases of childhood and adult lifeAsthmaAutismDiabetes mellitusEpilepsyGlaucomaHypertensionInflammatory bowel disease (Crohn disease and ulcerative colitis)Ischaemic heart diseaseIschaemic strokeManic depressionMultiple sclerosisParkinson diseasePsoriasisRheumatoid arthritisSchizophrenia
POLYGENIC INHERITANCE AND THE NORMALDISTRIBUTION Before considering the impact of recent research in detail, it is necessary to outlinebriefly the scientific basis of what is known as polygenic or quantitative inheritance. 'Additive' implies that the effects of the genes are cumulative, i.e. no one gene isdominant or recessive to another. Several human characteristics show a continuous distribution in the general populationthat closely resembles a normal distribution. This takes the form of a symmetrical bell-shaped curve distributed evenly about amean.
The spread of the distribution about the mean is determined by the standard deviation. Approximately 68%, 95% and 99.7% of observations fall within the mean plus or minusone, two or three standard deviations, respectively. For example, hypertension (high blood pressure) and diabetes affect roughly 23% and5% of the American population, respectively. Epilepsy, schizophrenia, and bipolar disorder, all of which are brain disorders, eachaffect approximately 1% of the population. Multiple sclerosis and autism have frequencies of about 0.1%.
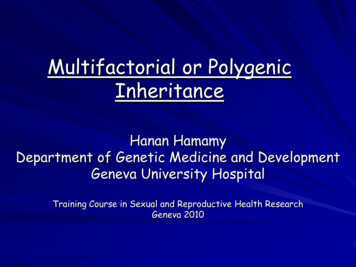
The normal (gaussian) distribution
A, The distribution of height in a population, assuming that height is controlled by a single locus with genotypes AA, Aa, and aa.B, The distribution of height, assuming that height is controlled by two loci. There are now five distinct phenotypes instead of three, and thedistribution begins to look more like the normal distribution.C, Distribution of height, assuming that multiple factors, each with a small effect, contribute to the trait (the multifactorial model).
Further support for this concept comes from the study of familial correlations forcharacteristics such as height and, to a lesser extent, intelligence. Correlation is a statistical measure of the degree of association of variablephenomena, or, in more simple terms, a measure of the degree of resemblance orrelationship between two parameters. As first-degree relatives share, on average, 50% of their genes, it would be reasonableto predict that, if a parameter such as height were polygenic, the correlation betweenfirst-degree relatives such as siblings would be 0.5. Several studies have shown that the sib-sib correlation for height is indeed close to 0.5. In reality, human characteristics such as height and intelligence are also influenced byenvironment, and possibly also by genes that are not additive in that they exert adominant effect.
These factors probably account for the observed tendency of offspring to show what isknown as 'regression to the mean‘. This is demonstrated by tall or intelligent parents (the two are not mutually exclusive!)having children whose average height or intelligence is slightly lower than the average ormid-parental value. Similarly, parents who are very short or of low intelligence tend to have children whoseaverage height or intelligence is lower than the general population average, but higherthan the average value of the parents. If a trait were to show true polygenic inheritance with no external influences, themeasurements in offspring would be distributed evenly around the mean of their parents'values.
Degrees of relationshipRelationshipFirst degreeProportion of genes shared1/2ParentsSiblingsChildrenSecond degree1/4Uncles and auntsNephews and niecesGrandparentsGrandchildrenHalf-siblingsThird degreeFirst cousinsGreat-grandparentsGreat-grandchildren1/8
MULTIFACTORIAL INHERITANCE - THELIABILITY/THRESHOLD MODEL Efforts have been made to extend the polygenic theory for the inheritance ofquantitative or continuous traits to try to account for discontinuous multifactorialdisorders. According to the liability/threshold model, all of the factors that influence thedevelopment of a multifactorial disorder, whether genetic or environmental, can beconsidered as a single entity known as liability.
The liabilities of all individuals in a population form a continuous variable, which has anormal distribution in both the general population and relatives of affected individuals. However, the curves for these relatives will be shifted to the right, and the extent towhich they are shifted is directly related to the closeness of their relationship to theaffected index case.
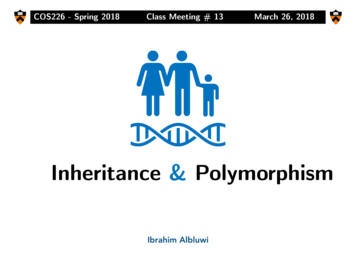
Hypothetical liability curves in the general population and in relatives for ahereditary disorder in which the genetic predisposition is multifactorial
1. CONSEQUENCES OF THELIABILITY/THRESHOLD MODELPart of the attraction of this model - and it should be emphasized once again that this isa hypothesis rather than proven fact - is that it provides a simple explanation for theobserved patterns of familial risks in conditions such as cleft lip/palate, pyloric stenosisand spina bifida.For example:1. The incidence of the condition is greatest among relatives of the most severelyaffected patients, presumably because they are the most extreme deviants along theliability curve. For example, in cleft lip/palate the proportion of affected first-degree relatives(parents, siblings and offspring) is 6% if the index patient has bilateral cleft lip andpalate, but only 2% if the index patient has a unilateral cleft lip.
Recurrence Risks (%) for Pyloric Stenosis, Subdivided by Gender of Affected Probands and Relatives Adapted from Carter CO. Genetics of common single malformations. Br Med Bull. 1976;32:21–26.
2. The risk is greatest among close relatives of the index case and decreases rapidly inmore distant relatives. For example, in spina bifida the risks to first-, second- and third-degree relatives ofthe index case are approximately 4%, 1% and less than 0.5%, respectively.3. If there is more than one affected close relative, the risks for other relatives areincreased. In spina bifida, if one sibling is affected the risk to the next sibling (if folic acid is nottaken by the mother periconceptionally) is approximately 4%; if two siblings areaffected, the risk to a subsequent sibling is approximately 10%.
4. If the condition is more common in individuals of a particular sex, then relatives of anaffected individual of the less frequently affected sex will be at higher risk thanrelatives of an affected individual of the more frequently affected sex. This is illustrated by the condition pyloric stenosis. Pyloric stenosis shows a male to female ratio of 5 : 1. The proportions of affected offspring of male index patients are 5.5% for sons and2.4% for daughters, whereas the risks to the offspring of female index patients are19.4% for sons and 7.3% for daughters.
The probable explanation for these different risks is that in order for a female to beaffected she has to lie at the extreme of the liability curve, so that her close relativeswill also have a very high liability for developing the condition. As males are more susceptible to developing the disorder, risks in male offspring arehigher than in female offspring regardless of the sex of the affected parent.5. The risk of recurrence for first-degree relatives (i.e. siblings and offspring)approximates to the square root of the general population incidence. Thus, if the incidence is 1 in 1000, the sibling and offspring risk will equalapproximately 1 in 32, or 3%.
If the prevalence of the disease in a population is f (which varies between zero andone), the risk for offspring and siblings of probands is approximately. This does not hold true for single-gene traits, because their recurrence risks arelargely independent of population prevalence. It is not an absolute rule for multifactorial traits either, but many such diseases dotend to conform to this prediction.
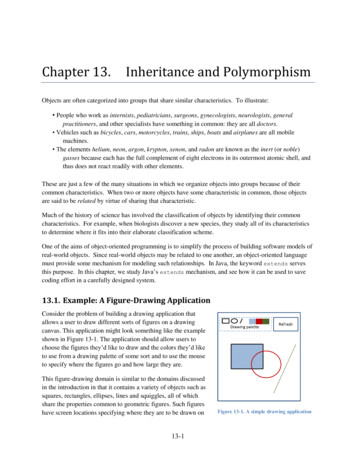
Severe (A) and mild (B) forms of cleft lip/palate
Recurrence Risks for First-, Second-, and Third-Degree Relatives of Probands
The distribution of height, assuming the presence of a major gene (genotypes AA, Aa, and aa) combined with a multifactorial background.The multifactorial background causes variation in height among individuals of each genotype.If the distributions of each of the three genotypes were superimposed, then the overall distribution of height would be approximately normal,as shown by the dotted line.
Nature and Nurture: Disentangling theEffects of Genes and Environment Family members share genes and a common environment. Family resemblance in traits such as blood pressure therefore reflects both geneticand environmental commonality (“nature” and “nurture,” respectively). For centuries, people have debated the relative importance of these two types offactors. It is a mistake, of course, to view them as mutually exclusive. Few traits are influenced only by genes or only by environment. Most are influenced by both. Determining the relative influence of genetic and environmental factors can lead to abetter understanding of disease etiology.
It can also help in the planning of public health strategies. A disease in which hereditary influence is relatively small, such as lung cancer, maybe prevented most effectively through emphasis on lifestyle changes (avoidance oftobacco). When a disease has a relatively larger hereditary component, as in breast cancer,examination of family history should be emphasized in addition to lifestylemodification.
2. HERITABILITY Although it is not possible to assess an individual's liability for a particular disorder, itis possible to estimate what proportion of the etiology can be ascribed to genetic factorsas opposed to environmental factors. This is referred to as heritability, which can be defined as the proportion of the totalphenotypic variance of a condition that is caused by additive genetic variance. In statistical terms, variance equals the square of the standard deviation. Heritability is often depicted using the symbol h2 and is expressed either as aproportion of 1 or as a percentage value. Estimates of the heritability of a condition or trait provide an indication of the relativeimportance of genetic factors in its causation, so that the greater the value for theheritability the greater the role of genetic factors.
This ratio of sib risk to population incidence is known as λs. For example, in type 1 diabetes, where the UK population incidence is 0.4% and therisk to siblings is 6%, λs is 15. For type 2 diabetes in Europe, λs is estimated at a more modest 3.5 (35% sibling risk;10% population risk). Correlations and concordance rates in MZ and DZ twins can be used to measure theheritability of multifactorial traits. Essentially, heritability is the percentage of population variation in a trait that is due togenes (statistically, it is the proportion of the total variance of a trait that is caused bygenes).
Heritability is estimated from the degree of resemblance between relatives expressedin the form of a correlation coefficient, which is calculated using statistics of the normaldistribution. In practice it is desirable to try to derive heritability estimates using different types ofrelatives, and to measure the disease incidence in relatives reared together and livingapart so as to try to disentangle the possible effects of common environmental factors. The degree of familial clustering shown by a multifactorial disorder can be estimatedby measuring the ratio of the risk to siblings of affected individuals compared with thegeneral population incidence.
A simple formula for estimating heritability (h2) from twin correlations or concordancerates is as follows: where cMZ is the concordance rate (or intraclass correlation) for MZ twins and cDZ isthe concordance rate (or intraclass correlation) for DZ twins. As this formula illustrates, traits that are largely determined by genes result in aheritability estimate that approaches 1.0 (i.e., c MZ approaches 1.0, and cDZapproaches 0.5). As the difference between MZ and DZ concordance rates becomes smaller,heritability approaches zero. Correlations and concordance rates in other types of relatives (e.g., between parentsand offspring) can also be used to measure heritability.
Concordance Rates in Twins for Selected Traits and Diseases
Estimates of heritability of various disordersDisorderSchizophreniaAsthmaCleft lip cleft palatePyloric stenosisAnkylosing spondylitisClub footCoronary artery diseaseHypertension (essential)Congenital dislocation ofthe hipAnencephaly and spinabifidaPeptic ulcerCongenital heart diseaseFrequency 600.36040.53735
IDENTIFYING GENES THAT CAUSEMULTIFACTORIAL DISORDERSo Multifactorial disorders are common and make a major contribution to humanmorbidity and mortality.o It is therefore not surprising that vigorous efforts are being made to try to identifygenes that contribute to their etiology.o A number of strategies have been used to search for disease susceptibility genes.
Strategy to find disease susceptibility genes for type 2 diabetes mellitus (T2DM). Candidate genes may be selected fromhuman models (e.g. monogenic forms of diabetes), knowledge of biology (insulin secretion or action), positional cloning oranimal models. The candidate gene is screened to find variants, which are then tested for association with T2DM bygenotyping cohorts of subjects with T2DM and controls. (Modified from Gloyn A L 2003 The search for type 2 diabetesgenes. Ageing Res Rev 2: 111-127, with permission.)
1. LINKAGE ANALYSIS Linkage analysis has proved extremely valuable in mapping single-gene disorders bystudying the co-segregation of genetic markers with the disease. However, this type of approach is much more difficult in multifactorial disorders, forthe following reasons:1. If a multifactorial disorder has a true polygenic underlying genetic susceptibility, intheory it is unlikely that alleles at a single locus will make a major contribution. It is extremely difficult mathematically to develop strategies for detecting linkage ofadditive 'polygenes', each of which makes only a small contribution to the phenotype.2. Many multifactorial diseases show a variable age of onset so that the genetic statusof unaffected family members cannot be known with certainty.
3. Most families in which a multifactorial disease is, or has been, present have only oneor two living affected members so that the number of 'informative meioses' availablefor study is usually very small.4. Some apparent multifactorial disorders, such as coronary artery disease andschizophrenia, are probably etiologically heterogeneous, with different genetic andenvironmental mechanisms involved in different subtypes that cannot be easilydistinguished at the phenotypic level. This makes analysis of linkage results very difficult.
Despite these limitations, progress is being made towards identifying susceptibility lociusing modifications of the approaches utilized for mapping single gene loci. It has been recognized for some time that one of the best approaches would be toundertake disease association studies and linkage analysis utilizing a so-called 'ideal'population. Such a population would be relatively large yet historically isolated and thereforegenetically homogeneous, with extensive medical records dating back for manygenerations, a large tissue bank, good medical services and a cooperative willingcitizenship. The 270 000 citizens of Iceland have been deemed to represent such an idealpopulation, and a genomics company, known as DeCODE Genetics, has been granted alicence to set up a national medical database and undertake genetic research.
Similar initiatives are likely in other populations; recently, for example, the Center forArab Genomic Studies (CAGS) has been established in Dubai. Although on the one hand these initiatives have raised serious concern about the issueof informed consent, on the other hand they could lead to the relatively rapid isolation ofgenes that make a significant contribution to human morbidity and mortality.
a. Affected sibling-pair analysis Standard linkage analysis requires information regarding the mode of inheritance,gene frequencies and penetrance. For multifactorial disorders this information is not usually available. One solution to this problem is to use a model-free method of linkage analysis thatseeks to identify alleles or chromosome regions shared by affected individuals. A common approach is to look for regions of the genome that are 'identical by descent'(IBD) in affected sibling pairs.
If affected siblings inherit a particular allele more or less often than would be expectedby chance, this indicates that the allele or its locus is involved in some way in causingthe disease. Consider a set of parents with alleles AB (father) and CD (mother) at a particularlocus. The probability that any two of their children will have both alleles in common is 1 in 4. The probability that they will have one allele in common is 1 in 2, and the probabilitythat they will have no alleles in common is 1 in 4. If siblings who are affected with a particular disease show deviation from this 1 : 2 : 1ratio for a particular variant, this implies that there is a causal relationship between thelocus and the disease.
The probability that siblings will have 2, 1 or 0 parental alleles in common. Significantdeviation from the 1: 2 : 1 ratio indicates that the locus is causally related to thedisease
Many genome-wide scans have been performed for various disorders and, although anumber of loci have been mapped, the number of disease susceptibility genes identifiedby this approach is disappointingly small. One reason, probably, is the complex nature of multifactorial disease, with numerousgenes of modest effect interacting with one another and the environment. Some studies are simply underpowered and recent efforts have concentrated on largecollections of carefully phenotyped affected sibling pairs.
b.Linkage disequilibrium mapping Once a chromosome region that appears to confer susceptibility has been identified,the next step is to reduce the genetic interval by 'fine mapping'. The most powerful method uses linkage disequilibrium (LD) mapping to constructhaplotypes by genotyping SNPs within the region. Historical cross-over points reduce the genetic interval by defining LD 'blocks'. Candidate genes within the region are then sequenced to find DNA variants that canbe tested for association with the disease.
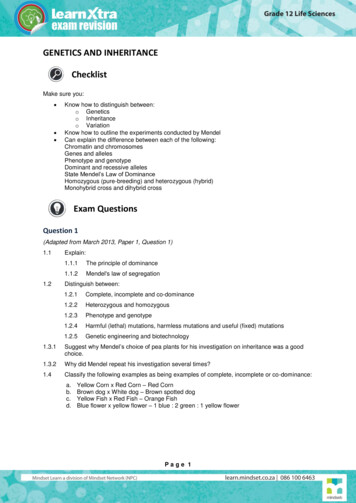
The LD structure of glucokinase. r2 values between the 84 SNPs across a 116-kbregion are presented. An r2 value of 1 indicates that two SNPs are linked. Thereare two blocks of LD within the glucokinase gene (outlined in red).
Calculation of odds ratio for a disease associationPatientsAllele 1aAllele 2bControlscdOdds ratio a/c b/d ad/bc
Transmission disequilibrium testo One way to overcome population stratification problems is to use family-basedcontrols.o The transmission disequilibrium test (TDT) requires a collection of trios that consist ofan affected proband and both parents (regardless of affection status).o Parents who are heterozygous for the marker allele in question are selected and thenumber of times this allele is transmitted to their affected offspring is compared to thenumber of times the other allele is transmitted.o Overtransmission of the marker allele strengthens the evidence for association, butdefinitive evidence that a variant is a predisposing allele usually requires functionalstudies.
2. ASSOCIATION STUDIES The study of disease associations is undertaken by comparing the incidence of aparticular variant in affected patients with the incidence in a carefully matched controlgroup. This approach is often described as a 'case-control' study. If the incidences in the two groups differ significantly, this provides evidence for apositive or negative association. The polymorphic system that has frequently been studied is the HLA (humanleukocyte antigen) histocompatibility complex on chromosome 6. One of the strongest known HLA associations is that between ankylosing spondylitisand the B27 allele.
This is present in approximately 90% of all patients and in only 5% of controls. The strength of an HLA association is indicated by the ratio of the risk of developingthe disease in those with the antigen to the risk of developing the disease in thosewithout the antigen. This is known as the odds ratio and it gives an indication of how much morefrequently the disease occurs in individuals with a specific marker than in those withoutthat marker.
One of the major difficulties with disease associations is to establish how they shouldbest be interpreted. In particular it is important to try to rule out a chance or spurious observation byensuring as far as possible that the proposed association is biologically plausible andthat the patient and control groups are closely matched. If evidence for a strong association is forthcoming, this suggests that the alleleencoded by the marker locus is directly involved in causing the disease (i.e. asusceptibility locus) or that the marker locus is in linkage disequilibrium with a closelylinked susceptibility locus. When considering disease associations it is important to remember that theidentification of a susceptibility locus does not mean that the definitive disease gene hasbeen identified.
This is illustrated by the association of HLA-B27 with ankylosing spondylitis. Although this is one of the strongest disease associations known, only 1% of allindividuals with HLA-B27 develop ankylosing spondylitis, so that many other factors,genetic and/or environmental, must be involved in causing this condition. Positive results from association studies require replication in other cohorts. A common reason for false-positive association is population stratification, where thepopulation contains a number of subsets and both the disease and the allele happen tobe common within that subset. A famous example, reported in a study by Lander and Schork, showed that in a SanFrancisco population HLA-A1 is associated with the ability to eat with chopsticks. This association is simply explained by the fact that HLA-A1 is more commonamongst Chinese people than caucasians!
3. WHOLE-GENOME ASSOCIATION STUDIES In whole-genome association studies, researchers compare the entire genome in a casecontrol study, rather than looking at just one variant at a time. This powerful new method can therefore be used to identify new disease susceptibility genes. Technological advances mean that it is now possible simultaneously to test up to 500 000SNPs on a single microarray (a 500K 'SNP Chip'). In the UK, the Wellcome Trust has funded alarge project to perform whole-genome association studies in approximately 3000 controls and2000 patients affected with tuberculosis, coronary heart disease, type 1 diabetes, type 2diabetes, rheumatoid arthritis, Crohn disease and ulcerative colitis, bipolar disorder orhypertension ( http://www.wtccc.org.uk).
A. International HapMap Project(http://www.hapmap.org) Whilst it is estimated that there may be up to 10 million SNPs in the human genome,many SNPs are in linkage disequilibrium and are therefore co-inherited. Regions of linked SNPs are known as haplotypes. A single SNP can be chosen that 'tags' a haplotype; these are described as tag SNPs. The International HapMap Project is identifying haplotypes in different populationsand it is estimated that the total number of haplotype-tagging SNPs is between 300 000and 600 000 depending on the population studied.
This means that whole-genome association studies of approximately 500 000 tagSNPs can test for the majority of genetic variation in the human genome. The HapMap Project will provide a valuable resource to learn more about the geneticpredispositions that underlie common diseases such as cardiovascular disease,diabetes, cancer, autoimmune and psychiatric disorders.
Populations studied in the International HapMap ProjectTown/countryAncestry Samples analysedYorubaIbadan,30 trios (adult andNigeriaboth parents)Tokyo, Japan Japanese45 unrelatedindividualsBeijing, China Chinese45 unrelatedindividualsUSANorthern and30 trios (adult andwestern European both parents)
CONCLUSION The term multifactorial has been coined to describe the pattern of inheritancedisplayed by a large number of common disorders that show familial clustering and areprobably caused by the interaction of genetic and environmental factors. The genetic mechanisms underlying these disorders are not well understood. The liability/threshold model should be viewed as an attractive hypothesis rather thanas proven scientific fact. Research in molecular biology is beginning to unravel some of the mysteries ofmultifactorial inheritance. The past 10 years has seen the recruitment of large numbers of patients and controlsto create valuable DNA resources for study, and further collections are in progress.
For example, the UK Biobank Project ( http://www.ukbiobank.ac.uk) aims to collectDNA samples and information on the health and lifestyle of 500 000 volunteers agedbetween 40 and 69 years. Over the next 20-30 years, approved researchers will be able to use these resourcesto study the progression of illnesses such as cancer, heart disease, diabetes andAlzheimer disease. From this they hope to develop new and better ways of preventing, diagnosing andtreating such problems.
Technological developments in SNP typing, together with an increased understandingof genetic variation, mean that the next few years are likely to prove very exciting asthese new approaches are applied to polygenic disease. This emphasis on the underlying genetic contribution to multifactorial disorders shouldnot in any way detract from the importance of trying to identify major environmentalcausal factors. This is amply demonstrated by the beneficial effect of folic acid supplementation inpreventing neural tube defects.
ELEMENTS1. The concept of multifactorial inheritance has been proposed to account for thecommon congenital malformations and acquired disorders that show non-Mendelianfamilial aggregation. These disorders are thought to result from the interaction of genetic andenvironmental factors.2. Human characteristics such as height and intelligence, which show a normallydistributed continuous distribution in the general population, are probably caused bythe additive effects of many genes, i.e. polygenic inheritance.
3. According to the liability/threshold model for multi-factorial inheritance, thepopulation's genetic and environmental susceptibility, which is known as liability, isnormally distributed. Individuals are affected if their liability exceeds a threshold superimposed on theliability curve.4. Recurrence risks to relatives for multifactorial disorders are influenced by diseaseseverity, degree of relationship to the index case, number of affected close relativesand, if there is a higher incidence in one particular sex, the sex of the index case.5. Heritability is a measure of the proportion of the total variance of a character ordisease that is due to the genetic variance.
6. Loci that contribute to susceptibility for multifactorial disorders can be identified by(a) a search for disease associations with variants in candidate genes,(b) linkage analysis looking, for example, for chromosomal regions that are identical bydescent in affected sibling pairs(c) whole-genome association studies to compare genetic variation across the entiregenome in large case-control studies.
References1. Emerys Elements Of Medical Genetics 15th Edition 2017by Peter D Turnpenny2. Medical Genetics E-Book 6th Edition 2019by Lynn B. Jorde, John C. Carey, Michael J. Bamshad
POLYGENIC INHERITANCE AND THE NORMAL DISTRIBUTION Before considering the impact of recent research in detail, it is necessary to outline briefly the scientific basis of what is known as polygenic or quantitative inheritance. 'Additive' implies that the effects of the genes are cumulati