Transcription
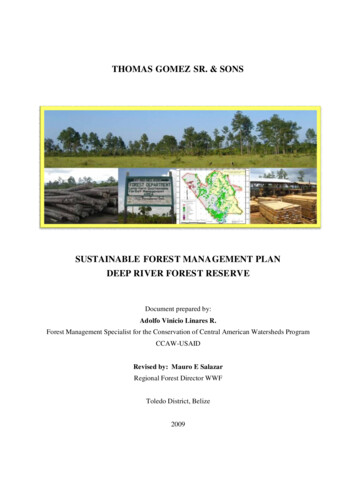
THE IMPACTS OF FOREST FIRES ONDRINKING WATER QUALITYbyDarla Deane GillA Thesis Presented in Partial Fulfillmentof the Requirement for the DegreeMaster of ScienceARIZONA STATE UNIVERISTYDecember 2004
THE IMPACTS OF FOREST FIRES ONDRINKING WATER QUALITYbyDarla Deane Gillhas been approvedNovember 2004APPROVED:, ChairSupervisory CommitteeACCEPTED:Department ChairDean, Division of Graduate Studies
ABSTRACTThe objective of this research was to determine the long-term effects ofcatastrophic forest fires on drinking water quality. The watersheds burned by theRodeo-Chediski fire in Arizona and the Hayman fire in Colorado were the focusof this research. Both fires occurred in watersheds that serve as a drinking watersource for a major metropolitan area.Concentration data and mass loading analyses were conducted utilizingpre- and post-fire water quality data. The results of the Rodeo-Chediski fire andHayman fire analysis were compared. In addition, an unburned watershed inArizona was analyzed and served as the reference watershed.The short- and long-term impacts on stream water that serves as adrinking water source were determined. Short-term effects consisted of elevatednutrient and particulate concentrations in the burned watersheds duringsubsequent storm events. The post-fire storm events also elevated the metalconcentrations in runoff water. However, the maximum contaminant level set bythe United States Environmental Protection Agency (EPA) for the metalsanalyzed was only exceeded by selenium.Long-term effects will originate from the mobilized particulate fractionsettling to the stream or lake bottom. The organic material and metals adsorbedto the particulates will be slowly dissolved, diffusing into the water. The dissolvedorganics will serve as an energy source for microorganisms that have the abilityto cause taste and odor problems in drinking water. While dissolved metals suchiii
as arsenic and selenium are regulated by the EPA due to negative human healtheffects.iv
ACKNOWLEDGEMENTSI would like to thank Dr. Paul Westerhoff for supervising the research, aswell as Dr. Jordan Peccia and Dr. Morteza Abbaszadegan for being on mycommittee. The Cities of Phoenix, Tempe, and Peoria, the Salt River Project,Central Arizona Project, and the United States Geological Survey providedfunding and/or assistance in conducting this research.I want to express my gratitude to my lab mates for all the effort they putforth to assist me in completing my research: Mario Esparza, Wontae Lee,Mohammad Badruzzman, Youngil Kim, Baiyang Chen, Aaron Dotson, AndyBaumgardner, Jorge Navarro, Steve Acquafredda, Joby Carlson, RenaudBordier, and Bo Song. Thank you to Erin Lyons, Erika Wilder, Brad Brown, JeffBrahs, Frank Wayne LaFaveIII, and Kevin Robertson for going to collect watersamples with me. Also, I appreciate the support I received from Dr. Dillner,Charity Coury, Jennifer Triplett, and my family. Thank you!v
TABLE OF CONTENTSPageLIST OF TABLES .xiLIST OF FIGURES . xivCHAPTER1 INTRODUCTION. 1Rodeo-Chediski Fire . 1Hayman Fire . 5Drought . 7Objective . 92 LITERATURE REVIEW. 12Stream Flow . 13Erosion and Suspended Sediment. 14Nutrients. 16Major Ions . 21Cations . 21Anions. 22Metals . 25Polycyclic Aromatic Hydrocarbons . 27Dioxins . 28Summary. 303 METHODS AND MATERIALS . 32vi
CHAPTERPageSampling Sites . 32Rodeo-Chediski Fire . 32Hayman Fire . 35Analytical Methods . 384 WATER QUALITY ON THE SALT RIVER POST RODEOCHEDISKI FOREST FIRE . 40Salt River Flow Rate Data. 40Salt River Concentration Data Analysis . 43Suspended sediment . 45Nutrients . 46Metals . 53Major ions . 70Verde River Flow Rate Data . 75Verde River Concentration Data Analysis . 76Suspended sediment . 76Nutrients . 77Discussion. 82Stream flow. 82Suspended sediment . 84Nutrients . 84Metals . 87vii
CHAPTERPageSummary. 885 LOADING ANALYSIS IN ARIZONA . 91Methods to Estimate Constituent Mass Loading . 91Simple method. 94Beale’s ratio estimator . 96Comparison of methods to estimate mass loading . 98Salt River Loading Analysis . 99Stream flow. 102Suspended sediment . 103Nutrients . 103Metals . 106Major Ions . 110Verde River Loading Analysis . 112Stream flow. 114Suspended sediment . 114Nutrients . 114Discussion. 118Stream Flow. 118Suspended Sediment . 118Nutrients . 119Metals . 120viii
CHAPTERPageMass loading ratio for nutrients and metals . 120Major Ions . 122Summary. 1236 CONCENTRATION DATA ANALYSIS IN COLORADO. 127Concentration Data Analysis . 127South Platte River above Cheesman Lake . 128Goose Creek. 136Cheesman Lake outlet. 143Below the confluence of the North Fork River and the SouthPlatte River . 150Sampling site comparison. 163Summary. 1727 SYNTHESIS. 174Stream Flow . 174Erosion and Suspended Sediment. 175Nutrients. 176Metals . 181Major Ions . 181Factor Affecting Fire Impacts on Drinking Water Utilities . 181Ecological Impacts of Forest Fires . 181Significance of Findings . 190ix
CHAPTERPage8 CONCLUSIONS. 192Future Recommendations . 195REFERENCES . 200APPENDIX A: LITERATURE REVIEW. 201APPENDIX B: ANNUAL MASS LOADING AND FLOW RATEFOR THE SALT RIVER AND VERDE RIVER . 215APPENDIX C: ADSORPTION OF BIS-PHENOL A BYCHARCOAL FROM A FOREST FIRE . 236x
LIST OF TABLESTablePage2.1 Comparison of pre- and post-fire changes in ions and nutrientsError! Bookmark not2.2 Maximum contaminant level and health effects of variousmetals . 263.1 Sample collection dates . 353.2 City of Denver sampling sites . 364.1 List of constituents analyzed for the Salt River . 444.2 Summary of nutrients and suspended sediment analyzed forthe Salt River . 494.3 Summary of trace metals analyzed for the Salt River . 594.4 List of constituents analyzed for the Verde River . 774.5 Total and dissolved C:N:P ratio for the Salt River . 875.1 Data for the Simple method . 945.2 Data for Beale's ratio estimator. 965.3 Summary of parameter values for Beale's ratio estimator . 975.4 The years of data collection on the Salt River above RooseveltLake at USGS gauging station 09498500. 1005.5 Time periods for mass loading calculations . 1025.6 Percent change in pre and post-fire nutrient, suspended sediment,and stream discharge mass loadings for the Salt River at USGSgauging station 09498500. 1045.7 Post-fire percent change in the long-term average annual massloading of metals Salt River at USGS gauging station09498500. 108xi
TablePage5.8 Post-fire percent change in the long-term average annual massloading of cations for the Salt River at USGS gauging station09498500. 1105.9 Post-fire percent change in the long-term average annual massloading of anions for the Salt River at USGS gauging station09498500. 1115.10 The years of data collection on the Salt River above RooseveltLake at USGS gauging station 09498500. 1135.11 Percent change in pre and post-fire nutrient, suspendedsediment, and stream discharge mass loadings for the VerdeRiver at USGS gauging station 09508500 . 1165.12 Dissolved to total mass loading ratio for trace metals, organiccarbon, phosphorus, and nitrogen . 1226.1 Constituents analyzed for each site . 1286.2 Metals with concentrations at or below the MRL. 1296.3 Total suspended sediment concentration comparison . 1666.4 Dissolved and total aluminum concentration comparison . 1666.5 Dissolved and total arsenic concentration comparison . 1676.6 Dissolved and total barium concentration comparison. 1686.7 Dissolved and total iron concentration comparison. 1696.8 Total lead concentration comparison . 1696.9 Dissolved and total manganese comparison . 1706.10 Dissolved and total zinc concentration comparison . 1716.11 Dissolved cadmium concentration comparison . 1717.1 Mass loading comparison of the Salt River and Verde River . 171xii
TablePage7.2 List of constituents analyzed for the Salt River and SouthPlatte River watershed. 182C.1 Standard deviation of samples ran in triplicate. 171xiii
LIST OF FIGURESFigurePage1.1 Salt River watershed in Arizona and USGS gauging station09498500 . 31.2 Map of the Verde River and Salt River Reservoir Systems andUSGS gauging station 09508500. 41.3 Hayman fire location map . 61.4 Palmer Drought Severity Index for the Salt River watershed . 81.5 Palmer Drought Severity Index for the South Platte Riverwatershed . 93.1 Map of Hayman fire sampling sites . 374.1 Salt River hydrograph 1914-2004 above Roosevelt Lake atUSGS gauging station 9498500. 424.2 Salt River hydrograph 2000-2004 above Roosevelt Lake atUSGS gauging station 09498500. 424.3 Suspended sediment concentration in the Salt River aboveRoosevelt Lake at USGS gauging station 09498500 . 464.4 Ammonia concentration in the Salt River above Roosevelt Lakeat USGS gauging station 09498500. 504.5 Nitrate plus nitrite concentration in the Salt River above RooseveltLake at USGS gauging station 09498500 . 504.6 Total nitrogen concentration in the Salt River above RooseveltLake at USGS gauging station 09498500 . 514.7 Dissolved organic carbon concentration in the Salt River aboveRoosevelt Lake at USGS gauging station 09498500 . 514.8 Total organic carbon in the Salt River above Roosevelt Lake atUSGS gauging station 09498500. 52ix
Figure . Page4.9 Dissolved phosphorus concentration in the Salt River aboveRoosevelt Lake at USGS gauging station 09498500 . 524.10 Total phosphorus concentration in the Salt River aboveRoosevelt Lake at USGS gauging station 09498500 . 534.11 Dissolved arsenic concentration in the Salt River aboveRoosevelt Lake at USGS gauging station 09498500 . 614.12 Total arsenic concentration in the Salt River above RooseveltLake at USGS gauging station 09498500 . 614.13 Dissolved barium concentration above Roosevelt Lake atUSGS gauging station 09498500. 624.14 Total barium concentration in the Salt River above RooseveltLake at USGS gauging station 09498500 . 624.15 Dissolved copper concentration in the Salt River above RooseveltLake at USGS gauging station 09498500 . 634.16 Total copper concentration in the Salt River above RooseveltLake at USGS gauging station 09498500 . 634.17 Dissolved iron concentration in the Salt River above RooseveltLake at USGS gauging station 09498500 . 644.18 Total iron concentration in the Salt River above Roosevelt Lake atUSGS gauging station 09498500. 644.19 Dissolved lead concentration in the Salt River above RooseveltLake at USGS gauging station 09498500 . 654.20 Total lead concentration in the Salt River above Roosevelt Lakeat USGS gauging station 09498500. 654.21 Dissolved manganese concentration in the Salt River aboveRoosevelt Lake at USGS gauging station 09498500 . 664.22 Total manganese concentration in the Salt River aboveRoosevelt Lake at USGS gauging station 09498500 . 66x
Figure . Page4.23 Dissolved mercury concentration in the Salt River aboveRoosevelt Lake at USGS gauging station 09498500 . 674.24 Total mercury concentration in the Salt River above RooseveltLake at USGS gauging station 09498500 . 674.25 Dissolved selenium concentration in the Salt River aboveRoosevelt Lake at USGS gauging station 09498500 . 6984.26 Total selenium concentration in the Salt River above RooseveltLake at USGS gauging station 09498500 . 6984.27 Dissolved zinc concentration in the Salt River above RooseveltLake at USGS gauging station 09498500 . 694.28 Total zinc concentration in the Salt River above RooseveltLake at USGS gauging station 09498500 . 694.29 Potassium concentration in the Salt River above RooseveltLake at USGS gauging station 09498500 . 714.30 Magnesium concentration in the Salt River above RooseveltLake at USGS gauging station 09498500 . 724.31 Calcium concentration in the Salt River above Roosevelt Lakeat USGS gauging station 09498500. 724.32 Sodium concentration in the Salt River above Roosevelt Lake atUSGS gauging station 09498500. 734.33 Bicarbonate concentration in the Salt River above RooseveltLake at USGS gauging station 09498500 . 744.34 Chloride concentration in the Salt River above Roosevelt Lakeat USGS gauging station 09498500. 744.35 Verde River hydrograph. 764.36 Suspended sediment concentration in the Verde River aboveHorseshoe Lake at USGS gauging station 09508500. 784.37 Ammonia concentration in the Verde River above HorseshoeLake at USGS gauging station 09508500 . 80xi
Figure . Page4.38 Total nitrogen concentration in the Verde River above HorseshoeLake at USGS gauging station 09508500 . 804.39 Dissolved organic carbon concentrations in the Verde River aboveHorseshoe Lake at USGS gauging station 09508500. 814.40 Total organic carbon concentrations in the Verde River aboveHorseshoe Lake at USGS gauging station 09508500. 814.41Total phosphorus concentrations in the Verde River aboveHorseshoe Lake at USGS gauging station 09508500. 824.42 Percentile ranking of stream flow in the Salt River andVerde River . 835.1 Beale's ratio estimator and Simple method comparison . 995.2 Pre- and post-fire loading of nutrients and suspended sedimentfor the Salt River at USGS gauging station 09498500 . 1055.3 Pre- and post-fire loading of total trace metals for the Salt River atUSGS gauging station 09498500. 1095.4 Pre- and post-fire loading of dissolved trace metals for the SaltRiver at USGS gauging station 09498500 . 1095.5 Pre- and post-fire loading of major cations for the Salt Riverat USGS gauging station 09498500. 1115.6 Pre- and post-fire loading of anions for the Salt River at USGSgauging station 09498500. 1125.7 Pre- and post-fire loading of nutrients and suspended sedimentfor the Verde River at USGS gauging station 09508500. 1176.1 Flow rate at Cheesman Lake inlet. 1306.2 Total suspended sediment concentration at CLI. 1316.3 Dissolved manganese concentration at CLI. 1366.4 Total manganese concentration at CLI . 136xii
Figure . Page6.5 Dissolved iron concentration at CLI . 1346.6 Total iron concentration at CLI. 1346.7 Dissolved aluminum concentration at CLI. 1356.8 Dissolved arsenic concentration at CLI. 1356.9 Flow rate at Goose Creek . 13776.10 Total suspended sediment concentration at GC . 1386.11 Dissolved manganese concentration at GC. 1416.12 Total Manganese concentration at GC . 14116.13 Dissolved iron concentration at GC. 1426.14 Total iron concentration at GC . 1426.15 Dissolved aluminum concentration at GC . 1436.16 Dissolved cadmium concentration at GC . 1436.17 Dissolved zinc concentration at GC . 1446.18 Flow rate at CLO. 1456.19 Total suspended sediment concentration at CLO . 1466.20 Dissolved iron concentration at CLO. 1496.21 Total iron concentration at CLO . 1496.22 Dissolved manganese concentration at CLO. 1506.23 Total manganese concentration at CLO . 1506.24 Dissolved aluminum concentration at CLO . 1516.25 Flow rate at the confluence of the North Fork and SouthPlatte River . 152xiii
Figure . Page6.26 Total suspended sediment concentration at NFSP . 1536.27 Dissolved aluminum concentration at NFSP. 1586.28 Total aluminum concentration at NFSP . 1586.29 Dissolved barium concentration at NFSP . 1596.30 Total barium concentration at NFSP . 1596.31 Total arsenic concentration at NFSP . 1606.32 Total lead concentration at NFSP . 1606.33 Dissolved zinc concentration at NFSP . 1616.34 Total zinc concentration at NFSP. 1616.35 Dissolved and total manganese concentration at NFSP . 1626.36 Dissolved iron concentration at NFSP . 1626.37 Suspended sediment and total iron concentration at NFSP. 1637.1 Normalized average annual loading of nutrients and suspendedsediment for the Salt River at USGS gauging station09498500 . 163807.2 Normalized average annual loading of nutrients and suspendedsediment for the Verde River at USGS gauging station09508500 . 163807.3 Saguaro Lake MIB concentrations . 163B.1 Annual suspended sediment mass loading and flow rate inthe Salt River at USGS gauging station 09498500 . 216B.2 Annual total organic carbon mass loading and flow rate inthe Salt River at USGS gauging station 09498500 . 217B.3 Annual dissolved organic carbon mass loading and flow rate inthe Salt River at USGS gauging station 09498500 . 217xiv
Figure . PageB.4 Annual total phosphorus mass loading and flow rate inthe Salt River at USGS gauging station 09498500 . 218B.5 Annual dissolved phosphorus mass loading and flow rate inthe Salt River at USGS gauging station 09498500 . 218B.6 Annual total nitrogen mass loading and flow rate inthe Salt River at USGS gauging station 09498500 . 219B.7 Annual ammonia mass loading and flow rate inthe Salt River at USGS gauging station 09498500 . 219B.8 Annual nitrate-nitrite mass loading and flow rate inthe Salt River at USGS gauging station 09498500 . 220B.9 Annual total manganese mass loading and flow rate inthe Salt River at USGS gauging station 09498500 . 221B.10 Annual dissolved manganese mass loading and flow rate inthe Salt River at USGS gauging station 09498500 . 221B.11 Annual total iron mass loading and flow rate inthe Salt River at USGS gauging station 09498500 . 222B.12 Annual dissolved iron mass loading and flow rate inthe Salt River at USGS gauging station 09498500 . 222B.13 Annual total copper mass loading and flow rate inthe Salt River at USGS gauging station 09498500 . 223B.14 Annual dissolved copper mass loading and flow rate inthe Salt River at USGS gauging station 09498500 . 223B.15 Annual total zinc mass loading and flow rate inthe Salt River at USGS gauging station 09498500 . 224B.16 Annual dissolved zinc mass loading and flow rate inthe Salt River at USGS gauging station 09498500 . 224B.17 Annual total barium mass loading and flow rate inthe Salt River at USGS gauging station 09498500 . 225xv
Figure . PageB.18 Annual dissolved barium mass loading and flow rate inthe Salt River at USGS gauging station 09498500 . 225B.19 Annual total arsenic mass loading and flow rate inthe Salt River at USGS gauging station 09498500 . 226B.20 Annual dissolved arsenic mass loading and flow rate inthe Salt River at USGS gauging station 09498500 . 226B.21 Annual total lead mass l
Rodeo-Chediski fire in Arizona and the Hayman fire in Colorado were the focus of this research. Both fires occurred in watersheds that serve as a drinking water source for a major metropolitan area. Concentration data and mass loading analyses were conducted utilizing pre- and post-fire water quality data. The results of the Rodeo-Chediski fire and


