Transcription
Global Warming’sIncreasingly Visible Impacts
Global Warming’s IncreasinglyVisible ImpactsAUTHORSDr. James WangDr. Bill Chameides
AcknowledgmentsWe would like to thank Dr. Michael Oppenheimer (Princeton Univ.), Dr. Tim Male,Annie Petsonk, Peter Goldmark and Melissa Carey for reviewing this report. EricaRowell, Allan Margolin and Elizabeth Thompson provided helpful comments andsuggestions. Lauren Sacks, Deepali Dhar, Valentin Bellassen and Alena Herklotzprovided valuable assistance with researching and drafting parts of the report. Thanksgo to Miriam Horn for the editing work, Bonnie Greenfield for the design and production, and Sarah Stevens, Jennifer Coleman and Tim Connor for assistance inobtaining images.Cover images: Ray Berkelsman, CRC Reef, Townsville (bleached corals), BryanDahlberg/FEMA News Photo (wildfire), U.S. Fish and Wildlife Service (Arctic fox)Our missionEnvironmental Defense is dedicated to protecting the environmental rights of allpeople, including the right to clean air, clean water, healthy food and flourishingecosystems. Guided by science, we work to create practical solutions that win lastingpolitical, economic and social support because they are nonpartisan, cost-effectiveand fair. 2005 Environmental DefenseThe complete report is available online at www.environmentaldefense.org.
ContentsSigns of global warming in the United States, region by regionivExecutive summaryvIntroduction1Part I: Extreme events3Killer heat wavesTorrential rains and floodingDroughtForests and wildfires3457Part II: Sea level rise and coastal flooding10Part III: Snow, land ice and sea ice13Shrinking snowpackVanishing glaciersPolar ice disintegrationMelting permafrost and damage to infrastructure13131617Part IV: Ecological impacts19Damage to coral reefsShifting species ranges and yearly cyclesDeclining Arctic animal populationsDeclining amphibian populations19202022Part V: Outbreaks of vector-borne diseases24Conclusion26References27iii
Signs of global warming in the United States, region by regionSoutheast/South-Central/Caribbean IslandsSierra Nevada peaks 3 weeks earlier.Part III, “Shrinking snowpack,” page 13. South Cascade Glacier in Washingtonat smallest size ever in the last 6,000years. Part III, “Vanishing glaciers,”page 13. Decline in populations of mountainamphibians in Pacific Northwest.Part IV, “Declining amphibian populations,” page 22. First large-scale coral bleaching eventever documented in Hawaii in 1996.Part IV, “Damage to coral reefs,” page 19. Smoke from record wildfires in Mexicotriggers health alert in Texas, 1998.Part I, “Forests and wildfires,” page 7. Loss of nearly 1 million acres ofwetlands in Louisiana due in part tosea-level rise. Part II, page 10. Coral bleaching in consecutive yearsobserved for the first time in FloridaKeys 1997–1998. Part IV, “Damage tocoral reefs,” page 19.Northeast/Mid-AtlanticAlaska Loss of large areas of wetlands inChesapeake Bay. Part II, page 10. World's largest recorded outbreak ofspruce bark beetles, 1990s. Part I,“Forests and wildfires,” page 7. Worst fire season in 2004; record levelsof unhealthful smoke particles. Part I“Forests and wildfires,” page 7. Shrinkage and thinning of sea iceaffecting traditional hunting. Part III,“Polar ice disintegration,” page 16. Damage to houses, roads, and villagesand disruption of mining activities bymelting permafrost. Part III, “Meltingpermafrost and damage to infrastructure,”page 17. Decline in caribou populations due toearlier spring. Part IV, “Declining Arcticanimal populations,” page 20.Midwest/Plains Deadly Chicago heat wave, 1995.Part I, “Killer Heat Waves,” page 3.Rocky Mountains/Southwest One of the worst droughts in 500 yearsin the West, 1999-2004. Part I,“Drought,” page 5. Worst wildfire season in 50 years inthe West, 2000. Part I, “Forests andwildfires,” page 7. 16% decline in snowpack in theRockies; Spring snow melt beginsnine days earlier. Part III, “Shrinkingsnowpack,” page 13. Dramatic shrinkage of glaciers inGlacier National Park. Part III,“Vanishing glaciers,” page 13. Outbreaks of hantavirus in the pastdecade linked to heavy rains. Part V,page 24.Nationwide Increase in frequency of intenseprecipitation events. Part I, “Torrentialrains and flooding,” page 4. Sea level rise averaging 4 to 8 inchesover 20th century. Part II, page 10. Migrations and shifts in yearly cyclesof plants and animals, including manybutterfly species. Part IV, “Shiftingspecies ranges and yearly cycles,” page 20.Pacific Coast/Hawaii/Pacific Islands 29% decline in snowpack in theCascades; streamflow throughoutiv
Executive summaryGlobal warming will not only be felt manydecades from now—it is already happening and its impacts are clearly visible. Thispaper gathers examples from the peerreviewed scientific literature of recentimpacts around the world. These includeincreases in extreme weather events, risingsea level, disappearing glaciers and polarice, damaged coral, changes in wildlifedistributions and health, and increasedactivity and abundance of disease vectors.Although a direct link to global warmingis difficult to establish for some of thesephenomena in isolation, the multitude ofchanges collectively provide clear evidenceof the immediate and growing danger thatglobal warming poses to the economy,human health, and the ecosystems uponwhich humans and other species depend.Since greenhouse gas pollution stays inthe atmosphere for decades or centuries,humanity may have no more than a decade left to begin stabilizing the climate toavert devastating and irreversible impacts.Such an achievement will require a concerted effort among all nations.The following are highlights of theglobal warming impacts described inthis report. For readers particularlyinterested in the United States, weinclude, preceding this Executive Summary, a listing of domestic impacts byregion. (For a comprehensive rebuttal ofskeptics’ claims regarding the science ofglobal warming, see our earlier report,The Latest Myths and Facts on GlobalWarming, available at http://www.undoit.org/what is gb myth.cfm.)In brief, this is what the scientificstudies show:Europe in July and August of 2003. Thatsummer was very likely the continent’shottest in 500 years. The relentless heatkilled at least 27,000 people, breakingall records worldwide for heat-inducedhuman fatalities. The heat and associateddrought and wildfires cost Europeaneconomies more than 14.7 billion(13 billion euros) in losses in the agriculture, forestry, and electric power sectors.Records have been shattered in otherparts of the world as well in recent years.In April-June 1998, 3,028 people diedin the most disastrous heat wave to everhit India. In 1995, a five-day heat wavecaused 525 deaths in Chicago, with the106 F (41 C) reading on July 13 thewarmest July temperature ever measured. Torrential rains and floodingAccording to the available data, globalwarming has increased the intensity ofprecipitation events over recent decades.In December 1999, for instance, Venezuela saw its highest monthly rainfall in100 years, with massive landslides andflooding that killed approximately 30,000people. On two days in the city of Maiquetia, rains fell with an intensity normally experienced just once in 1,000 years. Drought, forest pests, and wildfiresFrom 1998 to 2002, below-normalprecipitation and high temperaturesresulted in droughts covering wideswaths of North America, southernEurope, and southern and central Asia.Drought continued in some regionsthrough 2004, including the westernU.S., which endured the most severedrought in 80 years and one of the mostsevere in 500 years. The worldwidedrought has been linked to unusuallywarm waters in the Indian Ocean andwestern Pacific, which many scientists Killer heat wavesHuman-caused global warming mayhave already doubled the chance of“killer” heat waves like the one that hitv
basis for the four-and-a-half billiondollar U.S. ski industry. Over the past50 years, spring snowpack has diminished by 16% in the Rocky Mountainsand 29% in the Cascade Range, duemainly to rising temperatures. Furthermore, springtime snowmelt in thewestern U.S. now begins 9 days earlieron average, lowering stream levelsduring the dry summer months. It willbe extremely difficult to solve the problem of crippling, long-term water shortages in the West without addressingglobal warming.In almost every mountainous regionacross the world, glaciers are retreatingin response to the warming climate. Theshrinkage of glaciers is already creatingwater shortages, and threatening tourism in scenic parks. In one basin inGlacier National Park in Montana, forinstance, two-thirds of the ice has disappeared since 1850; with uncontrolledwarming, the remaining glaciers coulddisappear by 2030. In the EuropeanAlps, ice that had hidden and preservedthe remains of a Stone Age man meltedfor the first time in 5,000 years. Venezuela had six glaciers in 1972, but nowhas only two; these too will melt awayin the next ten years. In the PeruvianAndes, glacial retreat has acceleratedsevenfold over the past four decades.In Africa, 82 percent of the ice onMt. Kilimanjaro has disappeared since1912, with about one-third meltingin just the last dozen years. In Asia,glaciers are retreating at a record pace inthe Indian Himalaya, and two glaciersin New Guinea will be gone in a decade.believe to be caused in part by globalwarming.Insect pests are spreading to forestspreviously too cold for their survival;Alaska, for instance, had in the 1990sthe world’s largest recorded outbreak ofspruce bark beetles.Drought, heat, and insect attackspromote severe forest fires. In 2004,Alaska had its warmest and third driestsummer, resulting in its worst fire yearon record, with fires consuming an areaof forest the size of Maryland. All told,over the past 30 years, the area burnedannually by wildfires in the Arctic regionof western North America has doubled.In Russia, the area of forest burned annually more than doubled in the 1990scompared to the previous two decades. Rising sea levelSea-level rise is one of the most certainimpacts of global warming. During the20th century, sea levels around the worldrose by an average of 4 to 8 inches (10 to20 cm), ten times the average rate over thelast 3,000 years. That rise is projected tocontinue or accelerate further, with possible catastrophic increases of many metersif the ice sheets on Greenland and/orAntarctica collapse. Already, one-third ofthe marsh at Blackwater National Wildlife Refuge in the Chesapeake Bay hasbeen submerged under the sea, and theedges of mangrove forests in Bermuda arelined with recently drowned trees. If sealevel continues to rise, thousands of squaremiles of land in densely populated areassuch as the eastern U.S. and Bangladeshmay be lost, and flooding during stormsurges will worsen. Construction ofphysical barriers such as seawalls would beexpensive and in some cases unfeasible. Disintegrating polar ice andmelting permafrostSince 1950, the Antarctic Peninsulahas warmed by 4 F (2 C), four timesthe global average increase. In 2002,a Rhode Island-sized section of theLarsen B ice shelf, which sits offshore Shrinking snowpack andvanishing glaciersMountain snowpack constitutes a critical reservoir of fresh water, as well as thevi
record seriously damaged 16% of thereefs in the world and killed 1,000-yearold corals. Mass bleachings are usuallycaused by excessively high temperatures.Scientists therefore attribute the increasein bleaching events to the rise in averagesurface ocean temperatures in manytropical regions by almost 2 F (1 C)over the past century. Within the nextfew decades, continued warming couldcause mass bleachings to become anannual event, wiping out some reefspecies and ecosystems along with thefood, tourism income, and coastlineprotection they provide. Corals are alsodirectly threatened by increasing atmospheric concentrations of carbon dioxide,which is acidifying seawater and makingit more difficult for corals to build theircalcium carbonate skeletons.of the Peninsula, disintegrated in only35 days. The ice shelf acts as a dam forglaciers on land; its break-up is causinga worrisome speed-up of glacier flowinto the ocean, which could raise globalsea level.In 2003 the Ward Hunt Ice Shelf,the largest in the Arctic, broke in two,draining a unique freshwater lake thatwas home to a rare microbial ecosystem.Since the 1950s, the surface area of theArctic’s sea ice has shrunk by 10 to 15%in spring and summer, and the ice hasthinned by about 40% in late summerand early autumn. In a turn for theworse, the years 2002–2005 have allseen record or near-record low icecoverage. The Hudson Bay has beenparticularly hard hit, with the sea-iceseason shortened by three weeks. Thereduced time for hunting ice-dwellingseals is seriously damaging the health ofthe bay’s polar bears and causing themto have 15% fewer cubs. At present ratesof shrinkage, Arctic sea ice could soonpass a point of no return, disappearingcompletely each summer by the endof this century and pushing polar bearsto the brink of extinction everywhere.Shrinking and thinning ice has alsomade hunting of seals and other foodsources more challenging and accidentfilled for humans. Continued warmingcould destroy traditional societies.Because the permafrost on whichthey are built is melting, buildings androads in Alaska have been sinking andbreaking up. The 4,000 year-old Eskimovillage of Shishmaref has been so severelyeroded by ocean waves that the entirecommunity was forced to relocate. Shifting species ranges and yearlycyclesOf over 1,400 species analyzed, rangingfrom fish and mammals to grasses andtrees, over 80% are migrating to higherlatitudes or higher elevations andaltering their annual routines inresponse to global warming. Over time,this could cause disruptive ecologicaland economic changes, such as thedisappearance of entire fisheries.Amphibians have shown particularvulnerability: In mountains aroundthe globe, many species, including thegolden toad and most of the 70-oddspecies of harlequin frogs, have vanishedor declined because of diseases spurredby climatic changes. Disease outbreaksHigher temperatures accelerate thematuration of disease-causing agentsand the organisms that transmit them,especially mosquitoes and rodents.Higher temperatures can also lengthenthe season during which mosquitoes areactive, as has already been observed in Damage to coral reefsThe past 25 years have witnessed ahigher incidence around the world oflarge-scale coral “bleaching” events, whichcan lead to coral death. In 1997–98alone, the largest bleaching event onvii
tions—has also contributed to newoutbreaks of disease. In the past decade,heavy rains associated with El Niñoevents have caused explosive populationgrowth in the rodents that transmithantavirus, which can lead to severe andoften fatal illness in humans. As a consequence, record outbreaks of hantavirushave been occurring in the U.S.Canada. Warming has also been linkedto the recent spread of tropical diseases,including malaria, dengue fever andyellow fever, into high-altitude areas inColombia, Mexico, and Rwanda thathad never seen the diseases before.The increase in El Niño events sincethe mid-1970s—a change consistentwith global warming model predic-viii
IntroductionGlobal warming is no longer just a prediction—it is actually happening. It isundisputed that the average temperatureat the surface of the Earth has increasedover the past century by about 1 F(0.6 C), with both the air and theoceans warming.1 Since 1880, whenpeople in many locations first began tokeep temperature records, the 25 warmest years have all occurred within thelast 28 years.2 Scientists know withabsolute certainty that the observeddramatic increase in the atmosphericconcentrations of greenhouse gases sincepre-industrial times (to levels higherthan at any other time in at least thelast 420,000 years) has been caused byhuman activities, mostly the burningof fossil fuels (coal, oil, and natural gas),and to a lesser extent, deforestation.3The ability of greenhouse gases, suchas carbon dioxide, methane, and nitrousoxide, to trap heat at the Earth’s surfaceis also scientifically well understood.While it has not yet been preciselydetermined how much of the recentwarming was caused by human activities, the consensus among climatescientists is that most of the warmingover the past 50 years was probablycaused by human-produced greenhousegases. (See statements issued by theNational Academy of Sciences, theAmerican Meteorological Society, theAmerican Geophysical Union, theIntergovernmental Panel on ClimateChange, and the national academiesof eleven countries.)4 Recent precisemeasurements of the heat content ofthe world’s oceans, which show anincrease close to the amount expectedfrom warming by greenhouse gases,strengthen the consensus view.5,6Many among the public may havethe misconception that global warmingis a distant threat, with consequencesthat will only be felt many decades fromnow. The fact is, many widely accepted,peer-reviewed scientific studies havefound evidence that global warming hasalready had major impacts on ecosystems and societies across the world.Glaciers all around the world andArctic sea ice have been shrinking anddisappearing; sea level has been risingand flooding low-lying areas; lifethreatening heat waves, flooding rainstorms, droughts, and forest fires havebecome more intense and frequent overrecent decades; corals are “bleaching”and dying in response to higher oceantemperatures; and numerous animal andplant species are migrating away fromthe higher temperatures, toward thepoles and higher elevations. While adirect causal link to global warming hasbeen established for some observedchanges, such as sea-level rise andworldwide glacial retreat, such a linkis difficult to definitively establish forother changes, such as the increasedincidence of droughts or the migrationof a particular species. However, themultitude of changes collectively provides a consistent and clear body ofevidence of the immediate and growingdanger that global warming brings.Using the terminology of those taskedwith protecting public health, “the weightof the evidence,” or information compiled from all available studies, pointsstrongly to global warming as a forcebehind the observed changes. At riskare the health of the global economy,of human individuals and communities,and of the ecosystems upon which wedepend for food, clean water, otherresources, and spiritual sustenance.Carbon dioxide and other greenhousegases stay in the atmosphere for a1
Humanity mayhave only a narrowwindow of time left,perhaps a decadeor so, to begin thelong process ofstabilizing greenhouse gas concentrations at a levelthat can avertdevastating andirreversible impactsfrom climatechange.century or longer after being emitted.7The greenhouse gases we have alreadyadded to the atmosphere since theIndustrial Revolution have thereforecommitted the globe to a certainamount of continued warming over thecoming decades no matter what we dowith future emissions.8,9,10 Humanitymay have only a narrow window of timeleft, perhaps a decade or so, to begin thelong process of stabilizing greenhousegas concentrations at a level that canavert devastating and irreversible impacts from climate change.11,12This report summarizes some ofthe major impacts that global warminghas already had across the world,including some that have been observedsince the publication of major assessments by the Intergovernmental Panelon Climate Change (IPCC) and theNational Academy of Sciences in2001.13 Our goal is to provide policymakers, journalists, and the public withfacts so that they can make informeddecisions on the measures needed tostem the global-warming tide. We havemade every effort to ensure that thedocument is scientifically rigorous,noting where the link between aparticular phenomenon and globalwarming may not be fully establishedor where other causative factors maybe involved. We have relied almostexclusively on information from peerreviewed scientific publications andgovernment websites; the few exceptionsinclude a Munich Re company report, aNational Geographic article, and a BBCNews article.There are many more examples ofglobal warming impacts than can fitinto an easily digestible report like this.For more comprehensive information,the reader may want to refer to otherrecent reports, such as the 2004 ArcticClimate Impact Assessment; Status ofCoral Reefs of the World: 2004; the 2000National Assessment of Climate ChangeImpacts on the United States; and theIPCC Third Assessment Report.14 Fora comprehensive rebuttal of skeptics’claims regarding the science of globalwarming, see an earlier report of ours,The Latest Myths and Facts on GlobalWarming, available at http://www.undoit.org/what is gb myth.cfm. Occasionalupdates to the present report areplanned. Suggestions for improvementsand additions are welcome. Pleasesend suggestions to: Dr. James Wang,Environmental Defense, 257 ParkAvenue South, New York, NY 10010;jwang@environmentaldefense.org2
PART IExtreme eventsA warmed world,in other words, islike a loaded diethat comes up“Heat Wave” or“Intense Rainstorm”more often thanan unperturbedworld.It is difficult to blame a particularextreme weather event (such as aheat wave, flood-producing storm,or drought) on global warming, sinceweather fluctuates naturally. However,climate theory and models predictthat global warming will increase thefrequency and/or intensity of sometypes of extreme events. A warmedworld, in other words, is like a loadeddie that comes up “Heat Wave” or“Intense Rainstorm” more often thanan unperturbed world.15 Thus, scientistscan estimate the fraction of the riskof a particular kind of event for whichhumans are responsible. This section ofthe report presents examples of extremeevents observed during recent decadesthat are consistent with the effects ofglobal warming and may be harbingersof greater changes to come if we allowglobal warming to continue unabated.the number of deaths in excess of thetypical number during the summerperiod.) In France alone, over 14,000people died. In addition to the emotional trauma and medical costs, theheat and associated drought and wildfires cost European economies over 14.7 billion (13 billion euros)* in lossesin the agriculture, forestry, and electricpower sectors.21 Specific damagesincluded a 60% reduction in fodderproduction in France, an 18% decreasefor wine in Italy, an 11% fall in grainproduction for Europe as a whole,livestock deaths (for example, millionsof chickens died in France and Spain,reducing the flock by 15–20% inSpain),22 and cuts in power generationdue to shortages of river water for cooling the plants. France, Europe’s mainelectricity exporter, cut its power exportsby more than half to preserve an adequate domestic supply. By the 2040s, therisk of a similar heat wave could increase100-fold if civilization doesn’t restrainthe growth of greenhouse gases, withKiller heat wavesHuman-caused global warming mayhave already doubled the chance of“killer” heat waves like the one thatscorched Europe in July–August2003.16 Strong evidence indicates thatthe summer was the hottest in Europein at least the past 500 years.17 All-timehigh temperature records were brokenin many countries. In the United Kingdom, the mercury hit 100.6 F (38.1 C)at Gravesend-Broadness, Kent onAugust 10, exceeding 100 F for thefirst time in that country since recordsbegan.18 In Germany, an all-timerecord of 104.4 F (40.2 C) was seton August 8.19At least 27,000 people died as a resultof the relentless heat, breaking allrecords worldwide for heat-inducedhuman fatalities.20 (The figure refers toone out of every two years being hotterthan 2003 (as compared to the currentone out of every 200).23India was also hit in 2003 by a severeheat wave. Temperatures reached ashigh as 122 F (50 C) in May across theworst hit areas and over 1,200 peopledied.24 Just five years earlier, the mostdisastrous heat wave to ever hit Indiatook place during April–June of 1998,with an estimated 3,028 fatalities.25 Thetemperature rose as high as 113–121.6 F(45–49.8 C) in several Indian states.Disruptions to the electricity supply dueto excessive demand wreaked havoc on* We obtained the U.S. dollar value from thevalue in euros by applying the 2003 conversion rate.3
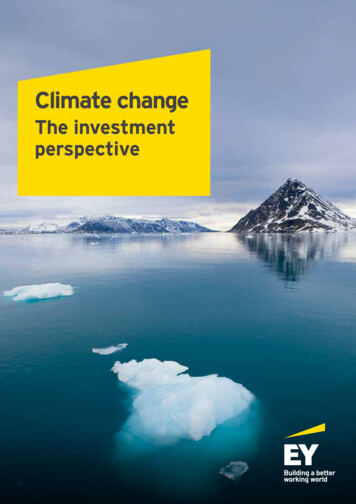
A ship on the river Rhine in Duesseldorf, Germany, July 25, 2003, during the extreme heat wave thatscorched Europe for much of the summer. Low water levels meant bigger ships could transport only30 to 50 percent of their normal cargo. (AP Photo/Martin Meissner)precipitation events occurred over thesecond half of the 20th century.30 Thisincrease is consistent with the predictedeffects of global warming, since highertemperatures speed up evaporation andincrease the amount of water vapor inthe air, leading to heavier downpours.Heavier rainfall in turn increases therisk of flooding.Another factor contributing to moreintense precipitation in some regions isthe increase in frequency and intensityof El Niño events since the mid-1970s.An El Niño is a phase of warmer-thanaverage waters in the eastern Pacificand weaker-than-average tropical tradewinds, usually lasting around a year andoccurring once every two to seven years.El Niños typically bring unusually heavyrains to the southern tier of the U.S. andPeru, while causing below-normal precipitation in the northwestern U.S.,northeastern Brazil, Southeast Asia,Australia, and southern Africa. Severalrecent El Niños may have been moreintense or long-lasting than any in thelast three centuries.31 Some climatesimulations have indicated that furtherhospital services and on refrigeratedsupplies of vaccines and medicines.26In the United States, Chicago experienced one of the worst weather-relateddisasters in Illinois history when a heatwave resulted in 525 deaths during a5-day period in July of 1995.27 The 106 F(41 C) reading on July 13 set a recordfor the warmest July temperature sincemeasurements began. The combinationof high humidity and high nighttimetemperatures meant little respite fromthe heat could be found, especially forsuch vulnerable populations as theelderly and people with low incomes.Studies indicate that the increase indeath rate from more frequent heatwaves in the future will probably outweigh any decrease in death rate dueto less severe winter cold in the U.S.,because cold-related mortality is morecomplex and not so strongly tied to theseverity of the cold.28,29Torrential rains and floodingAccording to the available data, asignificant increase in the intensity of4
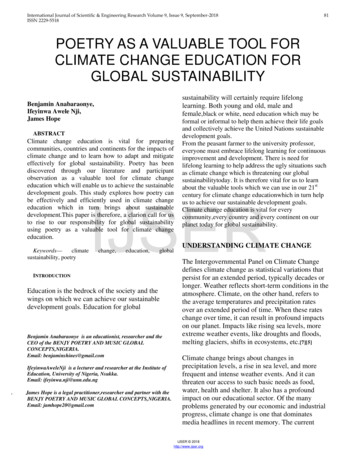
Devastation in coastal Venezuela caused by the December 1999 flows of mud and rocks. (LawsonSmith, U.S. Army Corps of Engineers)to October) and was not produced by ahurricane or other tropical cyclone. Theensuing flows of mud and boulders arethought to have been among the largestworldwide in at least a century. It isworth noting that the high death tollwas partly due to the building of largenumbers of homes on steep slopes proneto landslides and low-lying areas susceptible to floods. Discouraging developmentin these kinds of vulnerable locations, inaddition to reducing worldwide greenhouse gas pollution, would help mitigatefuture damages from global warming.warming of the planet will produce morefrequent and longer-lasting El Niños inthe future, thus causing extreme floodsand droughts to occur more often.One of many extreme flooding eventsthat may have been exacerbated byglobal warming occurred in December1999, when Venezuela experienced itshighest monthly rainfall in 100 years,with massive landslides and floodingthat killed approximately 30,000people.32 Total December rainfall in thecoastal city of Maiquetia, near Caracas,was almost 4 feet (1.2 m), more than5 times the previous December record.During one particularly intense period,2.8 inches (72 mm) of rain fell in onehour. Rainfall on two of those Decemberdays were “1,000-year events”—in otherwords, that daily amount of rainfall isexpected to occur in that location onaverage only once in 1,000 years. Rainfall amounts in the neighboring mountains are estimated to have been twice ashigh, or around 8 feet over the month.The rainfall was unusual not only forits intensity, but also because it occurredoutside of the normal rainy season (MayDroughtParadoxically, although flooding eventsare very likely to increase with globalwarming, droughts are also expected tobe more frequent and severe. Highertemperatures tend to increase the rateof evaporation; if precipitation doesn’tsoon replenish the lost moisture, soilsgrow drier. In drier soils, less solarenergy is used up in evaporating water,meaning more energy is available toraise the temperature of the soil and the5
decreasing the proportion of precipitation that falls as snow rather than rainin the mountains, and by acceleratingthe rate of snow melt in the spring.A reduced snowpack and earlier andquicker melts make for lower streamflows in the summer, when water canbe in short supply. (See “DisappearingSnowpack” in Part III.)Warmer ocean temperatures dueto global warming may also increasethe severity of droughts. The IndianOcean and the western Pacific wereexceptionally warm between 1998 and2002,* in part because of the overallwarming trend in the world’s oceans.37In the same period, unusually persistentatmospheric flow patterns resultedin below normal precipitation, hightemperatures, and drought conditionsacross wide swaths of North America,southern Europe, and southern andcentral Asia. Drought continuedthrough 2004 in some areas, includingthe western U.S., where according tostream flow records and tree ring studiesthe drought was the most severe inoverlying air, leading to even moredesiccating conditions; this kind of selfamplifying cycle can lead to a lengthyand severe drought.33 Dry soils can driveanother kind of self-amplifying cycle aswell: when there is l
the world’s largest recorded outbreak of spruce bark beetles. Drought, heat, and insect attacks promote severe forest fires. In 2004, Alaska had its warmest and third driest summer, resulting in its worst fire year on record, with fires consuming an area of forest the size of Ma