Transcription
LSI COMMERCIAL PULSE1ST QUARTER 2022A COMPREHENSIVE MARKET REPORT FOR THECOMMERCIAL INDUSTRY IN SOUTHWEST FLORIDAPRESENTED BYNELSON TAYLOR, MRICS, MSRE6810 International Center Blvd.Fort Myers, FL 33912www.LSIcompanies.com239.489.4066
Table of ContentsExecutive Summary . 4Macro-Economic OutlookGross Domestic Product .5Southwest Florida Taxable Sales .7Consumer Price Index .8LIBOR/10-Year Treasury .9Southwest Florida Population . 10Southwest Florida Housing Formation . 11Employment . 12Largest Employers . 15Location Quotient . 16CoStar Commercial Market TrendsCoStar Office . 18CoStar Retail . 21CoStar Industrial . 24Commercial Permit Activity ReportCollier County . 27Lee County Unincorporated . 28Village of Estero. 29Cape Coral. 29City of Fort Myers . 30City of Bonita Springs . 30Charlotte County . 31General Limiting Conditions. 32www.LSIcompanies.com info@LSIcompanies.com 239.489.4066 2020 LSI Companies, Inc. All Rights Reserved. Duplication of this report is prohibited.2
Executive SummaryCoStar Analytics tteTotalSquare .3%AskingRent 30.02 21.07 19.28 25.48 19.15 16.46 13.90 10.24 10.23The sudden and furious rise in assets prices over the last two years establish a mindset of investingthat was not based in reason but in irrational exuberance. As we move further into 2022, time willultimately determine the soundness of these investments made without solid reasoning forjustification. Since the start of 2022, the S&P 500 is down 15% as inflation, global conflict and quicklyrising interest rates are dimming the economic outlook. Real estate will be slower to react due toilliquid nature, with time needed to measure the impacts of economic change. However, it only takesreasoning to understand that rising debt costs and inflationary pressures on consumers willundoubtedly lead to softening economic conditions affecting real estate values. Time though, will bethe ultimate convert for those ignoring sound reasoning as over-zealous investments and projectsfail to find the next buyer willing to pay more.Between April of 2021 and March 2022, still stemming from the urban exit caused by Covid andbuyers flush with cash, Southwest Florida's new permit volume totaled approximately 26,800, up50% from the previous 12 months. Notably, single-family construction makes up 65% of the totalvolume of new permits, up over 40% from the previous 12 months. Locally, a rush to add inventoryis still on, but the lack of land and even more-so entitled land is driving up land values, with buildersdesperately seeking opportunities to maintain future pipelines. With affordability at an all-time high,consumers will be forced to maintain renter status. Look for developers of build for rent andapartment product to fill the void.Commercially we are rebounding and seeing record pricing with new industrial development to leadthe way in 2022. Housing formation and changing consumer habits to e-commerce delivery havecreated a buying wave of once long idle industrial land to deliver distribution and warehouseproducts to our area. Recently purchased industrial land, which sat idle for years, is expected toproduce an abundance of new deliveries in 20022. Office development is robust from the medicalsector with multiple projects slated; retail development is returning with mostly free-standingnational brands and planned large shopping centers. Developers are getting bullish with lowdevelopment yields and ultra-low terminal cap rates with headwinds present from supply chainshortages and pricing fluctuations. With excess cash in the market and inflation rising, the rush tobuy assets produces near-record pricing across stable industrial, retail, and office products. Watchfor flattening rent growth in late 2022 with an over-supply of new space allowing tenants to pushback on rental rates, which eventually will slow new commercial development.www.LSIcompanies.com info@LSIcompanies.com 239.489.4066 2020 LSI Companies, Inc. All Rights Reserved. Duplication of this report is prohibited.3
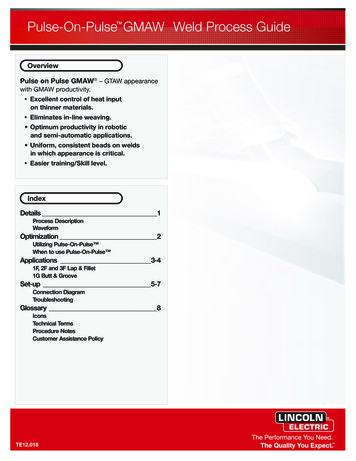
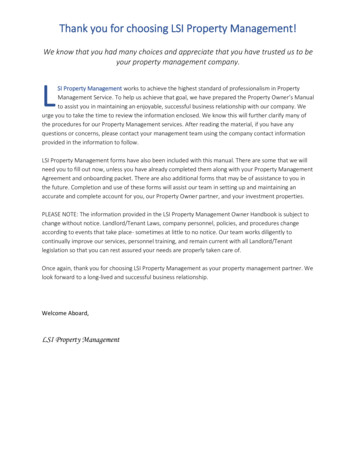
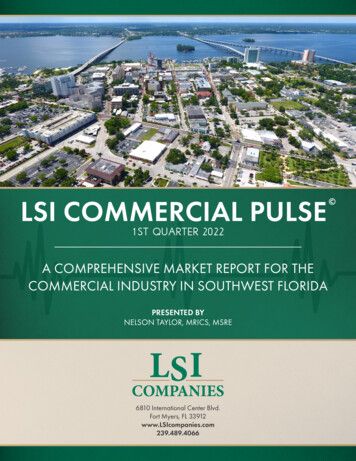
Macro-Economic OutlookGross Domestic ProductGross Domestic Product (GDP) is a measure of total economic output. Total GDP is comprised ofconsumption, business investment, government spending and net exports, with consumptionaccounting for approximately 70%. As a result of the pandemic, GDP in the first and second quarterof 2020 nationally shrank by 1.26% and 8.57%. However, growth rebounded in the third and fourthquarters with a 7.4% and 1.06% growth from the previous quarter. The pandemic has created wildswings in GDP as evidenced by the chart below. Inflationary pressures are starting to slow growth asevidenced by the negative Q1 2022 GDP numbers. Florida comprises approximately 5.0% of theoverall U.S. GDP, the fourth largest state economy in the country.U.S. & Florida Real GDP: Percent Change From Preceding QuarterChained 2012 .0%-5.0%-6.0%-7.0%-8.0%-9.0%-10.0%Source: Federal Reserve Bank of St. LouisU.S.Floridawww.LSIcompanies.com info@LSIcompanies.com 239.489.4066 2020 LSI Companies, Inc. All Rights Reserved. Duplication of this report is 2016Q22016Q12015Q42015Q32015Q2-2.0%2015Q10.0%-1.0%
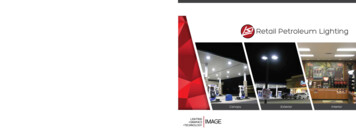
The Bureau of Economic Analysis estimates quarterly GDP by industry, which measures an industry’scontribution to the gross domestic product of the United States. It is also known as "value added byindustry." An industry's value added is the market value it adds in production, or the differencebetween the price at which it sells its products and the cost of the inputs it purchases from otherindustries. Value added for all U.S. industries combined is equal to the nation's GDP. GDP by industrydata also include compensation of employees, gross operating surplus, and taxes. The following is themeasure of contribution from private industries to 2021Q4 GDP. Industries are classified by theNorth American Industry Classification System.Real GDP Contribution in 2021Q4 by IndustryPrivate industriesAgriculture, forestry, fishing and huntingMining, quarrying, and oil and gas ale tradeRetail tradeTransportation and warehousingInformationFinance and insuranceReal estate and rental and leasingProfessional, scientific, and technical servicesManagement of companies and enterprisesAdministrative and support and waste management and remediation servicesEducational servicesHealth care and social assistanceArts, entertainment, and recreationAccommodation and food servicesOther services (except government and government 1.0%1.2%9.5%8.4%1.6%1.0%4.2%2.8%2.3%1.9%Real Gross Domestic Product, Billions of Chained 2012 Dollars, Quarterly, Seasonally Adjusted Annual RateSource: Bureau of Economic Analysiswww.LSIcompanies.com info@LSIcompanies.com 239.489.4066 2020 LSI Companies, Inc. All Rights Reserved. Duplication of this report is prohibited.5
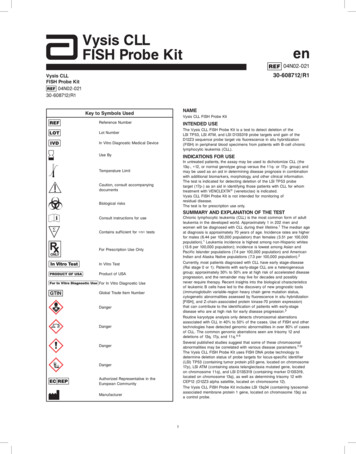
Southwest Florida Taxable Sales DataTaxable sales data for various Metropolitan Statistical Areas (MSA's) are popularly used as oneindicator of regional economic activity. These data come to the state on sales tax returns filedmonthly by retail establishments with the Florida Department of Revenue. The following categoriescomprise taxable sales.Tourism & Recreation- hotels and motels, bar and restaurant sales, liquor stores, photo and artstores, gift shops, admissions, sporting goods, rentals, and jewelry stores.Consumer Nondurables- food & convenience stores, department & clothing stores, drug stores etc.Autos & Accessories- the sale of new and used cars, repair shops, auto supply stores, and taxablesales at gasoline stations.Business Investment- farm equipment, feed and seed suppliers, store and office equipment,computer shops, machine shops, industrial machinery, hotel and restaurant suppliers, transportationequipment etc.Consumer Durables- the sale of appliances, furniture, home electronics, aircraft, boat dealers,hardware and decorating stores.Building Investment- includes sales by building contractors, heating and air conditioningcontractors etc.SWFL Taxable Sales Data in MillionsTourism & RecreationConsumer Non-DurableAuto Sales & AccessoriesBusiness InvestmentConsumer DurablesBuilding Due to pent up demand, 2021 over 2020, SWFL experienced a 29.6% incline in taxable sales, led bytourism up 41.7% and Auto Sales up 35.8%.www.LSIcompanies.com info@LSIcompanies.com 239.489.4066 2020 LSI Companies, Inc. All Rights Reserved. Duplication of this report is prohibited.6
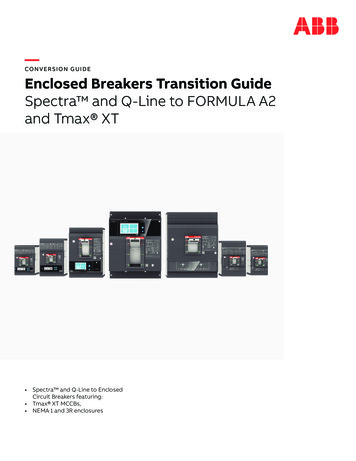
Consumer Price IndexThe consumer price index (CPI) is a measure of the average change over time in the prices paid byconsumers for a market basket of consumer goods and services. An increase in the CPI indicates thatthe cost of goods is increasing and thereby the purchasing power of the dollar is weakened.Source: Bureau of Labor 0.00%-0.50%U.S. Consumer Price Index - (CPI-U)8.5%7.0%4.1%3.3% 3.4%1.6%3.0%2.7%2.5%2.4%1.9%1.5%2.3%1.7%2.1% 2.1% 1.9%1.5%0.8% 0.7%1.4%0.1%Between March 2021 and March 2022, the consumer price index increased by 8.5%. Ideal targetinflation for a growing economy is 2.0%. Categories with the largest year over year increasesincluded energy up 30%, used cars and trucks up 22.7% and airline fares up 33.3%. Should be notedthe year over year change coincides with a closed economy vs one open, exacerbating the price ofgoods change. Numerous commercial leases are tied to annual inflation rent increases. However,owners with gross leases are seeing net operating income fall as rents are stagnant while buildingexpenses are on the rise.www.LSIcompanies.com info@LSIcompanies.com 239.489.4066 2020 LSI Companies, Inc. All Rights Reserved. Duplication of this report is prohibited.7
London Interbank Offer Rate / 10-year TreasuryThe Secured Overnight Financing Rate (SOFR) is a broad measure of the cost of borrowing cashovernight collateralized by Treasury securities and will replace the London Interbank Offered Rate(LIBOR) 3-month interest rate is what is often charged for short term loans between banks and isused as the benchmark for construction loans. Typical terms may be the then current SOFR rate plusa margin of points.The 10-year treasury yield is often the benchmark for long term debt instruments and directly affectsyields on leveraged projects. Cap rates tend to rise and fall with the change in the 10-year treasury.The 10-year treasury tends to rise when economic growth is expected and falls when the outlookdarkens. The Federal Funds rate hike has increased the required yield on the 10-year treasury as canbe seen by the chart below.Daily 10-Year Treasury vs SOFR RateSource: Federal Reserve Bank ofNew York10-Year TreasurySOFRwww.LSIcompanies.com info@LSIcompanies.com 239.489.4066 2020 LSI Companies, Inc. All Rights Reserved. Duplication of this report is 0.400.200.00
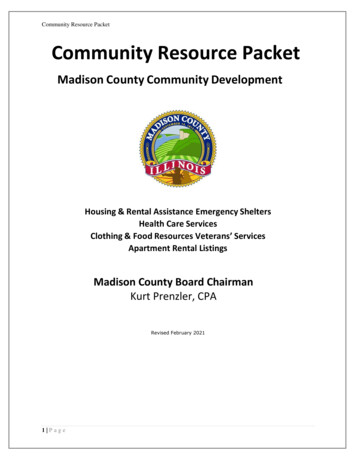
Southwest Florida PopulationSouthwest Florida continues to be one of the fastest growing areas in the nation. Growth is attributedto in-migration mostly from Northeastern and Midwestern states. However, foreign migration andintrastate migration are also significant factors for growth. U.S. Census Population Estimates,released in April 2022, showing the recent growth can be seen in the graph below. The data highlightspopulation estimates as of July 1st each year through 2021. It shows Southwest Florida continuing toexperience significant gains in population with a 2.3% gain (or 30,597 people) in 2020 over 2019 forCollier, Lee, and Charlotte Counties combined. This is 6.7 times the national population growth rate(0.35%) and double Florida’s population growth rate (1.1%) over the same period. The populationtrends for all three counties can be seen below.Collier, Lee & Charlotte 2,229150,123 5,000275,000225,000175,000125,0002000 2001 2002 2003 2004 2005 2006 2007 2008 2009 2010 2011 2012 2013 2014 2015 2016 2017 2018 2019 2020 2021Source: US CensusCollierLeeCharlotte2022 U.S. Census Population Estimates at the county level are scheduled to be released in mid-2023.www.LSIcompanies.com info@LSIcompanies.com 239.489.4066 2020 LSI Companies, Inc. All Rights Reserved. Duplication of this report is prohibited.9
Southwest Florida Housing FormationThere were a total of 26,791 permits issued for new residential housing units in Collier, Lee, andCharlotte Counties combined over the past 12 months, ending on March 31, 2022. This was a 49.8%increase from the previous 12-month period, which saw 17,879 new residential housing unitspermitted. When we look at only permits issued for new single-family detached homes (17,838), ourmarket saw a 44% increase. Looking forward, we project 2022 will finish with over 25,000 newresidential units permitted. The combined monthly trend can be seen in the following chart.Total Residential Units Permitted (Collier, Lee & Charlotte)Source: LSI & County/City Departmentswww.LSIcompanies.com info@LSIcompanies.com 239.489.4066 2020 LSI Companies, Inc. All Rights Reserved. Duplication of this report is 000
EmploymentThe graphs in this following section depict historical and current employment conditions at thecounty, state, and national levels. Note the strong seasonality in Collier County’s unemployment rate.As of March 2022, Collier’s unemployment rate fell to 2.2% after reaching 13.4% in April from thefallout of the pandemic. Unemployment should slowly increase in the coming months as summertourism declines.Collier County 5,0001.0%Source: US Bureau of Labor StatisticsUnemployedEmployedUnemployment Ratewww.LSIcompanies.com info@LSIcompanies.com 239.489.4066 2020 LSI Companies, Inc. All Rights Reserved. Duplication of this report is -18Jun-18Mar-18Dec-17Sep-17Jun-170.0%Mar-17140,000
Lee County has less seasonal irregularity than Collier County and may be more relevant to the overalljob market in Southwest Florida, which also affects the primary housing demand in the area. It isimportant to note that recent employment figures for Lee County post the pandemic show morepotential employees in the county than any time in its history. As of March 2022, the unemploymentrate was 2.5% with the available work force (blue) returning to pre-pandemic levels.Lee County 003.0%Source: US Bureau of Labor StatisticsUnemployedEmployedUnemployment Ratewww.LSIcompanies.com info@LSIcompanies.com 239.489.4066 2020 LSI Companies, Inc. All Rights Reserved. Duplication of this report is r-17260,000
Charlotte County in March 2022 had an unemployment rate of 2.8%.Charlotte County 4.0%52,0003.0%2.80%Source: US Bureau of Labor StatisticsUnemployedEmployedUnemployment Ratewww.LSIcompanies.com info@LSIcompanies.com 239.489.4066 2020 LSI Companies, Inc. All Rights Reserved. Duplication of this report is -18Jun-18Mar-18Dec-17Sep-17Jun-172.0%Mar-1750,000
Largest Employers in Southwest 50Company NameLee Health**Lee County School DistrictLee County Local Government*Publix Super MarketNCH Healthcare System**WalmartCollier County School DistrictCollier County Local Government*Florida Gulf Coast UniversityBayfront HealthCharlotte County School DistrictArthrex, Inc.**Charlotte County Local Government*McDonald’sCity of Cape CoralUS SugarHome DepotWinn-DixieHope HospiceRitz Carlton-NaplesFlorida SouthWestern StateGartner, Inc.**WalgreensCity of NaplesTargetChico’s Fas Inc.**Lowe’s Home ImprovementHertz**Shell Point Retirement CommunityRadiology Regional CenterCity of Fort MyersPhysicians RegionalHendry County School DistrictNews-Press/Naples Daily News**Seminole CasinoJ W Marriott-Marco IslandNaples Grande Beach ResortPerkins Restaurant & BakerySam’s ClubOlive Garden Italian KitchenHendry County Local Government*Downing Frye RealtyWCI Communities IncBurger KingMarriott-Sanibel Harbour ResortRE/MAX RealtyOutback SteakhouseVi at Bentley VillageJC PenneyCostco mentJohn R Wood 5Culver’s560Hyatt Regency-Coconut Point560Germain Cars554Carrabba’s Italian Grill550Raymond Building Supply534Florida Cancer Specialists520Cracker Barrel Old Country Str505Gulf Bay Group Of Companies500Agmart Produce Inc500South Seas Sanibel & Captiva500Chili’s Grill & Bar494Farm-Op Inc.480Best Buy470Taco Bell464Bonita Bay Club450Quick Lane450UPS435Progressive Waste Solutions421Palm Automall415Pizza Hut408Gettel Automotive406Galloway Family Of Dealerships400Salus Care400LYNX Services LLC400Harbour Health Center400Century 21399West Bay Club390Lee County Electric s381Coldwell Banker381City of Punta Gorda379Nordstrom378Sun Stream Hotels & Resorts350G4s Secure Solutions USA350J & J Ag Products Inc350D & K Harvesting Inc350Naples Beach Hotel350Pinchers343Gasparilla Inn & Club326Suntrust Bank325Red Lobster325Naples Lakes Country Club320Texas Roadhouse319Berkshire Hathaway Home Services312Company NameSource: SWFL Economi c Devel opment Al l i a nceDa ta compi l ed a nd edi ted by the Regi ona l Economi c Res ea rch Ins ti tute. Al l da ta i s current a s of 2019, unl es s noted otherwi s e.* Da ta a s recent a s 2018 Q3.** Da ta a s recent a s of 2017.The Southwest Florida economy is heavily tied to the residential construction and service industries.There have been noticeable improvements in those industries over the past few years that have donea great deal to increase job growth in Southwest Florida.www.LSIcompanies.com info@LSIcompanies.com 239.489.4066 2020 LSI Companies, Inc. All Rights Reserved. Duplication of this report is prohibited.14
Location QuotientLocation quotient (LQ) is essentially a way of quantifying how concentrated a particular industry,cluster, occupation, or demographic group is in a region as compared to the nation. It can reveal whatmakes a particular region “unique” in comparison to the national average. The following graphsdepict how concentrated occupations are based on the North American Industry ClassificationSystem (NAICS) on the local county level vs that of the overall State of Florida.LQ for occupations are calculated by dividing the regional concentration of an occupation by the stateor national concentration of that same occupation. So, suppose that Registered Nurses in a regionaccount for 0.10% of all jobs, while in the nation they account for 0.09% of all jobs. The LQ of nursesin the region is thus (.1 / .09 1.11). This means that the region has a higher than averageconcentration of nurses. Anything higher than 1.2 is determined to be an economic base industry.The larger circle indicates the relative size of the industry in comparison to other sectors.High-LQ occupations are important because they are generally employed by high-LQ industries,which tend to be export-oriented and form the majority of the region’s economic base. High-LQoccupations thus provide a workforce-oriented perspective of the region’s economic base. Suchoccupations are vital for the continued prosperity of the region.2020Q3 Collier County Employment Concentration & Weekly Wage 2,800 2,600Management of companiesand enterprises 2,400Finance and insurance 2,200Professional and technicalservices 2,000Wholesale TradePublic administration 1,800 1,600Arts, entertainment, andrecreationHealth care and socialassistanceUtilitiesConstruction 1,400MiningInformation 1,200Real estate and rental andleasingManufacturing 1,000 800 600 Transportation &WarehousingOther services, except publicadministrationAgricultureEducational services 400Retail TradeAdministrative and wasteservices 200Accommodation and foodservices .301.401.501.601.70Employment Concentration Relative to Floridawww.LSIcompanies.com info@LSIcompanies.com 239.489.4066 2020 LSI Companies, Inc. All Rights Reserved. Duplication of this report is prohibited.151.801.902.00
2020Q3 Lee County Employment Concentration & Weekly WageManagement of companiesand enterprises 1,900 1,800 1,700 1,600Arts, entertainment, andrecreationProfessional and technicalservicesFinance and insurance 1,500UtilitiesPublic administrationInformation 1,400 1,300 1,200Wholesale TradeReal estate and rental andleasingHealth care and socialassistance 1,100 1,000ManufacturingTransportation &Warehousing 900 800Retail Trade 700Construction 600 500Educational servicesAdministrative and wasteservices 400Other services, except publicadministrationAgriculture 300Accommodation and foodservices 01.601.701.801.902.002.10Employment Concentration Relative to FloridaSource: Bureau of Labor Statistics2020Q3 Charlotte County Employment Concentration & Weekly Wage 1,600Management of companiesand enterprises 1,500Professional and technicalservices 1,400Health care and socialassistancePublic administration 1,300Finance and insuranceTransportation &Warehousing 1,200 1,100ConstructionUtilitiesWholesale Trade 1,000Real estate and rental andleasing 900Retail TradeInformation 800AgricultureManufacturing 700 600 500Educational services 400Other services, except publicadministrationAdministrative and wasteservicesArts, entertainment, andrecreationAccommodation and foodservices 300 01.301.401.50Employment Concentration Relative to Floridawww.LSIcompanies.com info@LSIcompanies.com 239.489.4066 2020 LSI Companies, Inc. All Rights Reserved. Duplication of this report is prohibited.161.601.701.80
Commercial Market CoStar TrendsUtilizing CoStar Commercial Market Analytics, the following charts provide insight into each countyof Southwest Florida regarding the office, retail and industrial markets.Source: CoStar AnalyticsLee County Office SpaceOccupied SFTotal SFRent PSF22,000,000 25.0021,500,000 24.0021,000,000 23.0020,500,000 22.0020,000,000 21.0019,500,00019,000,000 20.0018,500,000 19.0018,000,000 18.0017,500,000 17.0017,000,000 -10Mar-11Sep-09Mar-10Sep-08Mar-09Sep-07Mar-08 14.00Sep-0615,500,000Mar-07 15.00Mar-0616,000,000Lee County Office Price Per SF & Cap Rate Trends (CoStar Modeling) 175.0010.0%9.5% 150.009.0% 125.008.5% 100.008.0%7.5% 75.007.0% 50.006.5%Cap Ratewww.LSIcompanies.com info@LSIcompanies.com 239.489.4066 2020 LSI Companies, Inc. All Rights Reserved. Duplication of this report is -14Market Sale Price 0Mar-11Mar-10Sep-09Sep-08Source: CoStar AnalyticsMar-09Mar-08Sep-07Sep-06Mar-076.0%Mar-06 25.00
Collier County Office SpaceSource: CoStar AnalyticsRent PSFTotal SFOccupied SF10,000,000 31.009,750,000 30.00 29.009,500,000 28.009,250,000 27.009,000,000 26.008,750,000 25.008,500,000 24.008,250,000 23.00 22.008,000,000 21.007,750,000 20.007,500,000 19.00 18.007,000,000 -227,250,000Collier County Office Sale Price Per SF & Cap Rate Trends (CoStar Modeling) 275.009.5% 250.009.0% 225.008.5% 200.008.0% 175.007.5% 150.007.0% 125.00Source: CoStar AnalyticsCap Ratewww.LSIcompanies.com info@LSIcompanies.com 239.489.4066 2020 LSI Companies, Inc. All Rights Reserved. Duplication of this report is -14Market Sale Price ar-076.5%Mar-06 100.00
Source: CoStar AnalyticsCharlotte County Office SpaceRent PSFTotal SFOccupied SF 20.004,200,0004,100,000 19.004,000,000 18.003,900,0003,800,000 17.003,700,000 16.003,600,0003,500,000 15.003,400,000 14.003,300,0003,200,000 13.003,100,000 -063,000,000Charlotte County Office Sale Price Per SF & Cap Rate Trends (CoStar Modeling) 200.0010.5%10.3% 180.0010.0%9.8% 160.009.5%9.3% 14
data also include compensation of employees, gross operating surplus, and taxes. The following is the measure of contribution from private industries to 2021Q4 GDP. Industries are classified by the North American Industry Classification System. Real GDP Contribution in 2021Q4 by Industry U.S. Florida Private industries 100.0% 100.0%