Transcription
Natural GasSource:Puget Sound EnergyFrom prospect to burner tipJ. Richard Moore
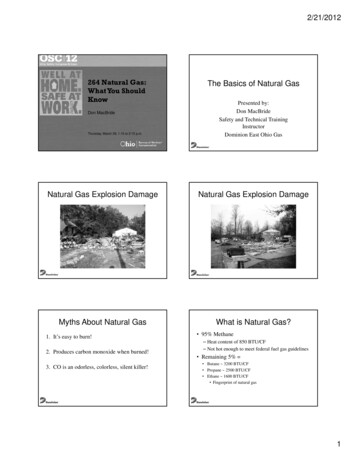
U.S. natural gas industry-segmentsGas industry functionGas industry segmentGas industry facilitiesEXPLORATIONUpstreamGAS WELLS & LEASE EQUIPMENTMidstreamPLANTS , PIPELINES & STORAGEPRODUCTIONGATHERING / PROCESSINGTRANSMISSIONDISTRIBUTIONLDC PIPELINES & EQUIPMENTDownstreamCONSUMERSCONSUMERS
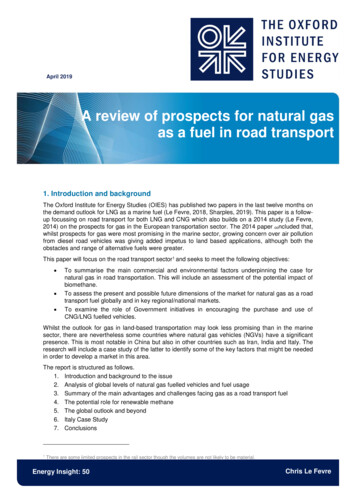
Natural gas supply & disposition in the U.S. (TCF/yr)Gross withdrawals fromgas and oil wells26.0Non hydrocarbonGases removed(N2,CO2,H2S, etc.)0.7Vented/Flared0.2Extractionloss (PVR)1.0Reservoir repressuring(used to maintain oilproduction)3.5Natural gas storagefacilitiesDry gasproduction20.6ImportsLNGCanada3.271Trinidad 701LNG from AlaskaAdditions3.4Lease, P/L, plant fuel,misc., bal. (gas industry)1.9Withdrawals3.0Residential4.8Source: EIA Natural Gas Annual 2009Commercial3.1Industrial6.2Vehicle Fuel0.03Electric power6.9
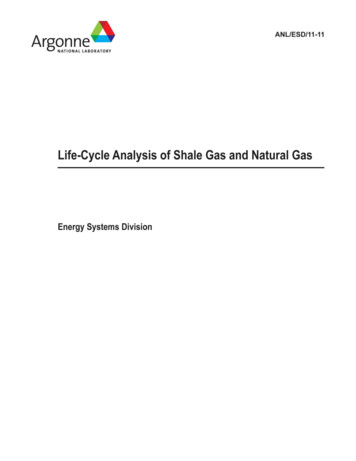
Seasonality of natural gasStorage balances supply & consumptionWithdraw from StorageSupply (Dry gas production plus net imports)Inject into StorageConsumption
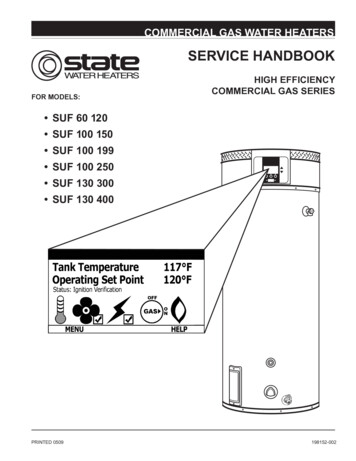
Map pattern of gas movementsPrincipal Interstate Natural Gas Flow Summary Source: EIA
Natural Gas Formation& Exploration
Geology and formation of natural gasOIL AND GAS FORMATIONGEOLOGIC TIMEHeadlinesYears Ago0Man AppearsSurfaceCENOZOIC ERAHorses AppearDinosaurs Disappear65 MillionMESOZOIC ERADinosaurs Appear225 Million5,000’PALEOZOIC ERAFirst AbundantFossil Record570 MillionOzone Layer FormedBig Bang HeardRock Layers DepositedOver TimeSUCCEEDINGLAYERSOF ROCKADD WEIGHTANDPRESSUREON EARLIERLAYERSHeat and Pressure ConvertOrganic Debris to Oil & GasPRECAMBRIAN ERA4,600 MillionPressure & TempDepth10,000’“BASEMENT” ROCKSurfaceIncreasingWith Depth o(5,000 PSI, 220 F)
Natural gas reservoir requirementsReservoir Rocks ShaleImpermeabilityReservoir Requirements(GAS)RESERVOIR ROCK(WATER)SOURCE ROCK
Porosity and permeabilityConventional formationSource: Natural Gas.org, USGSUnconventional formation
Drilling a wellPreliminaryMajor Rig Systems1. Identify ProspectA. SeismicB. Log Correlation2. Obtain Mineral Lease3. Obtain Drilling Permit4. Prepare Site1. Hoisting - Mast & Drawworks2. Rotating - Turntable / Top Driveand Drill String3. Circulating - Pumps and MudCirculatingSystem(Mud)Contract & Design Issues1. Drilling ContractA. Rate: Day, Footage, TurnkeyB. Equipment & Start Date2. Design Casing Program3. Evaluate Surface EquipmentRequirements4. Power - Engines (Diesel / Electric)PowerSystem(Engines)Activities While Drilling1.2.3.4.5.Well Control - Blow Outs / Lost HolesMWD - Directional WellsLogging and AnalysisDecision to CompleteTight Hole - Confidential
Horizontal drilling benefits Improved projecteconomics( production rates PV) Reduced total field CAPEX(fewer wells/locations required) Reduced environmentaldisturbance(fewer sites/wells/roads)
Completion &Production Operations
Completion activitiesTypical Steps Perforate FractureStimulate(“Frac”) Recover fracload/flow wellIssues Benefits Controversies Costs
“Fracing” & water quality concernsWater for human consumption is takenfrom top 1000 feet of the earth.Depth000 ft0EPA says 20 Billion* barrels of sewage( containing toxins and diseases) leakannually from US sewage systems. Leaks are intotop of water supply zone and can go downthrough entire zone. (Daily volume is: (1) than 10times the total BP Macondo well spill (2) equal tototal fluid needed for 550 to 1100 frac jobs)1Which is the greater threat?610Frac zoneSource: DOE NETL “Shale Primer” 4/09Typical frac job 50-100k barrels—thousandsof feet below water supply*Source: www.epa.gov/npdes/pubs/csosso rtc factsheet.pdf
“Fracing” & water supply concernsSome facts:1. Water used to frac one horizontal well 50k -100k bbls2. Golf course water consumption in U.S.* Average golf course in U.S. consumes 50K bbls per weeK Average U.S. golf course consumes 2.5 million bbls per year U.S. has 16,000 golf courses Annual U.S. golf course water consumption 40 billion bblsU.S. golf courses consume enough water every yearto frac 400,000 to 800,00 wells--shall we ban golf?Source: May 2008 Golf Digest (“How green is my golf?”), EIA
Natural Gas Gatheringand Processing
Typical natural gas streamFROMWELLHEADSEPARATORSTO LGASOLINECARBONDIOXIDENORMALBUTANEWATERRECOVERABLE HYDROCARBONSRESIDUE GASNON-HYDOCARBONS AND CONTAMINANTS
Gas well surface flow schematicSales GasTreating(CO2, rLiquid SalesWaterTo Disposal
Natural gas gathering and processingPlace in physical distribution networkCPC PPNatural GasPPP C PPHigh Pressure(300 – 500 PSI)GasProcessingPlantPipeline QualityNGLSPPP CSite / FacilitiesWellheadCCompressorPPig Launcher/RetrieverHigh Pressure Gathering LineMedium Pressure Gathering LineTOPipeline,Truck,BargeFunctions / Activities Gathering – Connects Wells to TransmissionPipeline System Compression – Raises Pressure of Gas FromWellheads Permitting Gas to Flow IntoTransmission System. Lengthens Well Life.Low Pressure Gathering Line Treating – Removes ImpuritiesGas Transmission Pipeline Processing – Removes NGLSGas Transmission P/LP
Natural Gas Transmission
Natural gas transmission pipelinesPlace in physical distribution networkSITE / FACILITIESSSupply SourceMMarketGathering LinesIntrastate Transmission PipelineInterstate Transmission Pipeline “A”Interstate Transmission Pipeline “B”CGCity GateLocal Distribution Company PipelinesCCompressorUSUnderground StorageFUNCTIONS / ACTIVITIES Provide high pressure / long distancetransportation of gas Pipeline uses pressure from reservoir orcompressors (pumps) to move gas Pipeline uses storage facilities and linepack to meet supply / demand swings Safety & environmental regulation - DOT,OSHA, EPA, DOI Intrastate rate regulation - state agencies Interstate rate regulation - FERC
Natural GasDistribution
Natural gas distributionTransmission PipelinePlace in physical distribution networkCityGateDistribution Main - Trunk (100 PSIG)1. PressureRegulatorPressureRegulatorDistribution Main (20 PSIG)PressureRegulatorPeakingSupply2. Measurement1.2.3.4.3. /4 PSIG)4 oz.Customer(House)Local Distribution Utilities*Miles of MainSteel - 551,000Plastic - 621,000Other - 38,000Total - 1,210,000*Source: AGA:AGATypeInvestor OwnedMunicipalNumber260930RegulationStateLocalLDC DeliveriesResidential4.9 Trillion BTUCommercial 3.1 Trillion BTUIndustrial3.9 Trillion BTUElec. Gen .1.8 Trillion BTUTotal13.7 Trillion BTU
Natural gas consumption(22.9 tcf consumed-21.0 tcf by consumers) Most natural gas is consumed as fuel Lease, P/L and plant fuel 1.9 TCF (8% of total consumption) R&C 7.9 TCF (37% of consumer use) Electric power generation 6.9 TCF (33% of consumer use) Industrial 6.2 TCF (30% of consumer use)Gas as feedstock 10% of industrial use or 3% of totalSource: EIA Natural Gas Annual 2009(MECS)
Natural Gas Supply
Conventional & unconventional gas
U.S. natural gas supply-potential sourcesArea/SourceTechnically recoverablegas resource (TCF)IssuesNatural gas resourceAlaskaLower 48 Onshore (non-associated)3021,382Access / Transport / EconomicsAccess / Pipeline / Economics(Unconventional Gas)Lower 48 Offshore (non-associated)Associated296Access / Pipeline138Access (leases)US recoverable resource (2010AEO)2119*Shale gas resource increase (2011)480Updated US resource estimateUS proved reservesHydrates (U.S.)Source: AEO 2010 (as of 1/1/2008*) and AEO 20112,599Access / Pipeline / Economics238200,00 -320,00Technology / Economics
U.S. dry natural gas supply/forecasted sources2010Source20252035TCF%TCF%TCF%Lower 48 - Onshore18.67721.08423.087Lower 48 - 1.350.3124.110024.910026.4100U. S. Dry ProductionTotal U. S. Dry Production1Imports (Net)Total ImportsTotal U. S. Dry SupplyLower 48 year end reserves264287266 Unconventional gas (Tight Gas, Shale, CBM) growth more than offsets decline inconventional lower 48 onshore production 2010 AEO Alaska gas pipeline begins operation in 2023. 2011 AEO: no AGP 2010 AEO: LNG imports surpass pipeline imports in 2017. 2011 AE0: LNG P/L imports.Source: EIA Annual Energy Outlook (AEO) 2011
UnconventionalNatural Gas Supply
Unconventional gas sourcesCategoryExtraction DifficultySolutionRecoverable TCFDeep Gas (15,000’ )Drilling CostTechnology / Higher Gas Prices90 (30% of US resource)“Tight” GasLow Production Rates(Low Permeability)Fracture / Acid StimulationHorizontal Wells254 (6000)ShaleLow Production RatesFracture Stimulation &Horizontal Drilling827 (650-1135)Coal Bed MethaneLow Production Rates/Water DisposalImproved Drilling &Production Technology CO2InjectionGeo-Pressurized Zone(10,000 – 25,000 Ft)Depth and High PressureImproved Drilling &Production Technology1,100(5,000-49,000)Methane Hydrates Extracting Methane from Ice Crystal LatticeNot Yet Known?(200,000-320,000)Source: 2011 NETL,USGS,NG.org websites163
What is shale gas/oil?Shale gas refers to natural gas that is trapped within shale formations.Shales are fine-grained sedimentary rocks that can be rich sources ofpetroleum and natural gas. Long known as source rock, shale’s limitedpermeability has rendered the resource uneconomic until recently.
Worldwide shale gas resource 48 shale basins (70 formations) in 32 countries 5,670 TCF of recoverable resource (plus 862 TCF in US) Conservative. Excluded; offshore, Russia, Middle EastSource: EIA, “World shale gas resources” 4/5/11
Why is shale gas important?US shale resource: Abundance of gas will hold down US energy costs Lower energy costs improve US competitiveness Expand US employment/taxes/royalties Environmental benefits: low emissions Reduce imports and improve energy supply security Reduce cash flow and influence of enemies of USWorldwide resource: (shale located in 688 formations in 142 basins){i.e. China 540 TCF, Europe 108 TCF, Canada 72 TCF with resource likely to expand with drilling) Reduce energy cost and emissions worldwide Improve living standards and promote trade Reduce potential for conflict
Liquefied Natural Gas(LNG)
LNG value chain(400 BCF) US 2009 Imports of LNG 479 BCF 6% of 8.6 TCF World LNG Market (2007 771 BCF 10%) Worldwide Proved Gas Reserves 6,647 TCF (57 times projected 2011 Worldwide Consumption of 117 TCF)Source: FERC, EIA, IEO 09, O&GJ 12/06/10,LNG World News
LNG shippingSource: FERC and BP 333 Vessels in LNG Trade , 34 Ships on Order (03/06/10 www.shipbuildinghistory.com)oo LNG Transported at - 163 C (-260 F) and Atmospheric Pressure (1/600 Reduction) Ship Fuel may be Cargo “Boil Off” 0.15% Per Day or Dual Fuel (diesel)3333 Standard Vessel is Increasing from 125,000m / 138,000m (3 BCF) to 145,000m / 250,000mSource: EIA, FERC, web
Natural GasStorage
Underground gas storage facilities
Underground gas storage facilitiesStatisticsWorking GasCapacitySitesTypeDailyDeliverabilityWorking Gas /Deliverability Ratio#%BCF%MMCF/D%Depleted Gas / alt 046Source: EIA
US underground gas storage facilitiesCharacteristics (generalization)TypeCost ToBuildBase GasRequirementWorking GasCapacityDailyDeliverabilityDepleted gerLessSalt DomeMostLowSmallerGreatest
Thank Youjrichardmoore@sbcglobal.net
What is shale gas/oil? Shale gas refers to natural gas that is trapped within shale formations. Shales are fine-grained sedimentary rocks that can be rich sources of petroleum and natural gas. Long known as source rock, shale's limited permeability has rendered the resource uneconomic until recently.