Transcription
US Experience with SprinklersMarty AhrensOctober 2021Copyright 2021 National Fire Protection Association (NFPA )
KEY FINDINGSSprinklers in Reported Structure Fires: All OccupanciesSprinklers in Reported Home FiresFrom 2015 to 2019, local fire departments responded to an estimatedaverage of 51,000 structure fires per year (10 percent) in whichsprinklers were present. These fires caused an average of 36 civiliandeaths (1 percent) and 1 billion in direct property damage (9 percent)annually.Sprinklers were present in an estimated average of 23,600 of the reportedhomei structure fires per year in 2015–2019, resulting in an average of23 civilian deaths, 555 civilian injuries, and 194 million in direct propertydamage annually.Sprinklers reduce the impact of fires. Compared to reported fires inproperties with no automatic extinguishing systems (AES), whensprinklers were present, the civilian fire death and injury rates per firewere 89 percent and 27 percent lower, respectively. The rate offirefighter injuries per fire was 60 percent lower.Fire spread was confined to the object or room of origin in 95 percent ofreported structure fires in which sprinkler systems were present comparedto 71 percent in properties with no AES.The 7 percent of reported home structure fires that occurred in propertieswith sprinklers accounted for 1 percent of home fire deaths, 5 percent ofhome fire injuries, and 3 percent of home property loss.Sprinklers operated in 95 percent of the home fires in which the systemswere present and the fires were considered large enough to activate them.They were effective at controlling the fire in 97 percent of the fires in whichthey operated. Taken together, sprinklers operated effectively in 92 percentof the fires large enough to trigger them.In 89 percent of the home fires with operating sprinklers, only one operated.In 99.5 percent, five or fewer operated.Sprinklers have proven to be reliable in reported structure firesconsidered large enough to activate them. From 2015 to 2019, sprinklersoperated in 92 percent of such fires and were effective at controlling thefire in 96 percent of the incidents in which they operated. Overall,sprinkler systems operated and were effective in 88 percent of the firesconsidered large enough to activate them.Sprinklers save lives and reduce injuries and property loss. From 2015 to2019, the civilian death and injury rates per reported home fire were 88 and28 percent lower, respectively, and average property loss per home fire was62 percent lower in reported home fires in which sprinklers were presentcompared to fires in homes with no AES.The most common reason that sprinklers failed to operate was thesystem being shut off at some point before the fire.The rate of firefighter injuries per home fire in which sprinklers werepresent was 78 percent lower than in homes with no AES.One sprinkler is usually enough to control a fire. In 77 percent of thestructure fires where sprinklers operated, only one operated. In 97percent, five or fewer operated. In 99 percent, 10 or fewer operated.In reported home fires in which sprinklers were present, the fire wasconfined to the object or room of origin 97 percent of the time compared to74 percent in homes with no AES.iThe term home includes one- and two-family homes, including manufactured housing and apartments or other multifamily homes.NFPA Research pg. 1
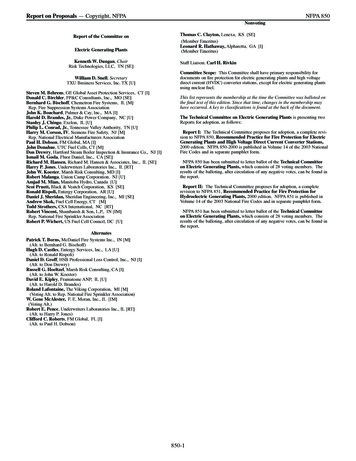
INTRODUCTIONThis report provides a statistical overview of sprinkler presence andperformance in reported fires. This information is essential forunderstanding the prevalence, impact, reliability, and effectiveness ofthese systems and increasing their positive impact. Because the majorityof fire deaths are caused by home fires, additional details are provided onsprinklers in fires in these properties.Estimates were derived from the details collected by the US FireAdministration’s (USFA’s) National Fire Incident Reporting System(NFIRS) and NFPA’s annual fire department experience survey.Unless otherwise specified, estimates and rates in this report excludefires in properties under construction. In addition, the casualty andloss estimates can be heavily influenced by the inclusion orexclusion of one unusually serious fire.More detailed information is available in the supporting tables.Sprinkler Presence and TypeSome type of sprinkler was present in an estimated average of 51,000(10 percent) of the reported structure fires during 2015–2019. Sprinklerpresence varied widely by occupancy. Figure 1 shows the percentage offires by occupancy in which any type of sprinkler was present. Sprinklerswere most likely to be found in institutional occupancies, such as nursinghomes, hospitals, and prisons or jails. Although the majority of thestructure fires and associated civilian fire deaths, injuries, and directproperty damage occurred in residential properties, particularly homes,only 8 percent of the reported residential fires occurred in properties withsprinklers. High-rise buildings are more tightly regulated and much morelikely to have sprinklers than shorter structures. 1Figure 1. Presence of sprinklers in US structure fires by occupancy:2015–2019Nursing home69%Hospital61%Prison or tore or office26%Public assembly25%All 0%Some properties have both sprinkler and non-sprinkler AES. This isparticularly likely in commercial kitchens. In such cases, only the AEStype in the fire area would be recorded. This could result inunderestimates of the presence of sprinklers in some occupancies.Table A summarizes information about the various types of automaticextinguishing systems (AES) present in all the reported structure firesexcept those in buildings under construction. Figure 2 shows that wetpipe systems were in use at almost nine out of every 10 reported fires inwhich sprinklers were present.Figure 2. Types of sprinklerspresent at US structure fires: 2015–2019Wet pipe,87%Dry pipe, 10%Other, 4%NFPA Research pg. 2
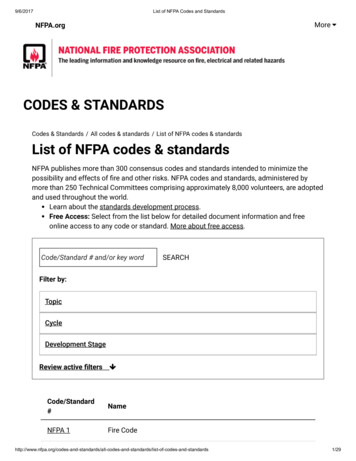
Table A. Summary of AES presence and type in reported structure fires: 2015–2019 annual averagesAES Presence and TypeFiresCivilian DeathsCivilian InjuriesDirect Property Damage(in Millions)AES present61,100(13%)37(1%)1,130(9%) 1,086(10%)Sprinkler system present51,000(10%)36(1%)1,020(8%) 1,008(9%)Wet pipe sprinkler system44,200(9%)33(1%)919(7%) 908(9%)Dry pipe sprinkler system5,000(1%)2(0%)87(1%) 88(1%)Other type of sprinkler system1,800(0%)1(0%)14(0%) 12(0%)10,100(2%)1(0%)111(1%) 78(1%)Partial AES system of any type present2,500(1%)6(0%)54(0%) 109(1%)AES of any type not in fire area and did notoperate1,700(0%)2(0%)55(0%) 56(1%)No AES present423,200(87%)2,816(98%)11,609(90%) ) 10,637(100%)Non-sprinkler AES presentFigure 3 shows that dry pipe sprinkler systems were more common instorage occupancies. Table 2 in the supporting tables shows that othertypes of sprinkler systems were seen most frequently in eating anddrinking establishments and grocery or convenience stores. It ispossible that some of these other types were miscodes of systemsdesigned specifically for cooking equipment.Figure 3. Sprinkler system type by occupancy: 2015–2019Public assembly8%11%Educational12%2%Health care2%Residential2%Store or %0%Dry pipe87%8%6%ManufacturingWet pipe20%40%60%80%100%NFPA Research pg. 3
Fires in Properties with Sprinklers vs. with No AESFigure 4 shows that the death rate per 1,000 reported fires was 89 percentlower in properties with sprinklers than in properties with no AES. Theserates are based strictly on the reported presence or absence of thisequipment; whether or not the system operated was not considered.Civilian deaths in sprinklered properties are discussed in greater detaillater in this report.Figure 4. Civilian death rates per 1,000 reported firesin properties with sprinklers and with no AES2015–2019With sprinklers6.70123456Civilan deaths per 1,000 fires7Figure 5 shows that the civilian injury rate per 1,000 reported fires was27 percent lower in properties with sprinklers than in properties with noAES. Many of the injuries occurred in fires that were too small to activatethe sprinklers. In others, someone was injured while trying to fight thefire in the initial moments before the sprinklers operated.Figure 5. Civilian injury rates per 1,000 reported firesin properties with sprinklers vs. with no AES:2015–2019With sprinklers20No AES270102030Civilian injuries per 1,000 firesFigure 6. Firefighter injury rates per 1,000 fires inproperties with sprinklers vs. with no AES:2015–2019With sprinklers18No AES4600.7No AESthey activate, making the situation less dangerous for respondingfirefighters.40Figure 6 shows that the rate of firefighter injuries per 1,000 fires was 60percent lower in structure fires with sprinklers compared to fires inproperties without AES protection. Sprinklers begin to control a fire when102030405060Firefighter injuries per 1,000 fires70Reductions in the average dollar loss per fire when sprinklers werepresent varied greatly by occupancy. Table 4 in the supporting tablesshows that compared to properties with no AES, the average overall losswas 11 percent lower in fires where sprinklers were present. Thepercentage reductions were highest in health care occupancies(73 percent), stores or offices (70 percent), public assembly occupancies(63 percent), and homes (62 percent).The average loss per fire was higher in sprinklered warehouses andmanufacturing properties than in those with no AES. Warehouse contentsor expensive machinery may be rendered worthless by smoke alone. Avery small fire can damage expensive manufacturing equipment. In therare cases in which a sprinkler system fails to operate or operatesineffectively, the monetary loss can be exceedingly high, increasing theaverage loss for the occupancy type. For example, the average loss insprinklered manufacturing properties was inflated by a 1.1 billion losscaused by a November 2019 Texas petrochemical plant explosion and theresulting multi-day fire and additional explosions. 2 The plant’s wet pipesprinkler system did not operate.Sprinklers limit fire spread. Figure 7 shows a 24 percent increase in firesthat were confined to the object or room of origin when sprinklers werepresent compared to fires with no AES.NFPA Research pg. 4
Figure 7. Percent of fires confined to object or room of originin properties with sprinklers vs. with no AES: 2015–2019With sprinklers95%No AES71%0%20%40%60%80%100%Sprinkler systems are designed to operate only where fire is present. Justone sprinkler activated in more than three-quarters (77 percent) of thefires in which sprinklers of any type operated and four out of five(80 percent) fires with operating wet pipe sprinkler systems. Figure 9shows that in 97 percent of the fires in which sprinklers operated, five orfewer were activated. This was true for 92 percent of the dry pipesprinkler systems. ii In 99 percent of the fires with operating sprinklers ofany type, 10 or fewer sprinklers operated.Figure 9. When sprinklers operated, percentage of fires in whichone or one to five sprinklers operated by type of sprinkler system:2015–2019Sprinkler Operation, Effectiveness, and IssuesFrom 2015 to 2019, sprinklers operated in 92 percent of the fires in whichthey were present and the fire was considered large enough to activatethem. i They were effective at controlling the fire in 96 percent of the firesin which they operated. Taken together, sprinklers operated effectively in88 percent of the fires large enough to trigger them. (See Figure 8.)Details on sprinkler operation and effectiveness in different occupanciesand for wet and dry pipe systems are provided in Table 6 of thesupporting tables.Figure 8. Sprinkler operation and ailed to operate, 8%Operated ineffectively, 4%Wet pipe80%Dry pipe92%67%All types79%0%20%40%60%97%80%97%1 to 5 sprinklers1 sprinkler100%The following incident descriptions illustrate the effectiveness of sprinklers: Around 2:30 a.m., an alarm monitoring company alerted the local firedepartment to a system activation at a department store in a NorthDakota mall. 3 Arriving firefighters initially saw no signs of fire oroperating sprinklers. A store representative led them to a separatearea where water was coming from under a closed office door. Anelectronic device left to charge overnight had overheated and started asmall fire on the desk that spread to a chair. A single sprinklerextinguished the fire.These calculations exclude fires with confined structure fire incident types (NFIRS incident types 113–118). Among confined fires in which sprinklers were present, thefire was too small to activate the sprinklers 71 percent of the time, the sprinklers operated and were effective 14 percent of the time, and the sprinklers failed to operate 4percent of the time. Since these fires are, by definition, confined, it is likely that a substantial share of the fires in which the sprinklers were said to fail, were, in fact, toosmall to cause the sprinkler to operate. The 41 percent of non-confined fires (NFIRS incident types 110–123, except for 113–118) that were too small to activate thesprinklers and the less than 1 percent of the non-confined structure fires in which sprinkler operation was unclassified were also excluded.iiFires with NFIRS confined fire incident types were included in these calculations.iNFPA Research pg. 5
An intentional fire set along an exterior wall of a California nonprofitorganization’s storage facility spread inside. 4 The fire department wasnotified around 4:20 a.m. Two sprinklers controlled the inside fireand firefighters completed extinguishment. In the report, theinvestigator noted that the building would likely have been a total losswithout the working sprinklers.A sprinkler at an Illinois fitness center controlled a dryer fire. 5Responding firefighters used a pump can to extinguish the remainingfire inside the dryer. The maintenance worker who discovered the firehad attempted to put the fire out with an extinguisher. He wastransported to the hospital for treatment of moderate smoke inhalation.In 98 percent of the fires in which one sprinkler operated, it was effective.Figure 10 shows that sprinklers were somewhat less likely to haveoperated effectively when more sprinklers operated.Figure 10. Percentage of fires in which sprinklerswere effective by number that operated: 2015–2019100%98%95%92%93%87%Figure 11. Reasons for sprinkler failure: 2015–2019System components damaged, 9%Inappropriate system for type offire, 6%Systemshut off,57%Manual intervention defeatedsystem, 18%Figure 12 shows that in eight out of every 10 fires in which sprinklersystems operated ineffectively, the problem involved getting water to thefire. In half of the fires in which sprinklers were ineffective, the water didnot reach the fire. In nearly one-third of the fires, not enough water wasdischarged.Figure 12. Reasons for sprinkler ineffectiveness:2015–201987%84%80%Manual intervention, 2% Lack of maintenance, 3%Inappropriate system for type of fire, 7%60%System components damaged, 7%40%Water didnot reachfire, 50%20%0%Lack of maintenance, 10%123456 –10Not enough water discharged, 31%11 or moreFigure 11 shows that in nearly three out of every five incidents in whichsprinklers failed to operate, the system had been shut off. An October 2018 West Virginia warehouse fire in which thesprinklers had been shut off caused 10 million in propertydamage. 6 The warehouse contained plastic goods and recycledplastic.NFPA Research pg. 6
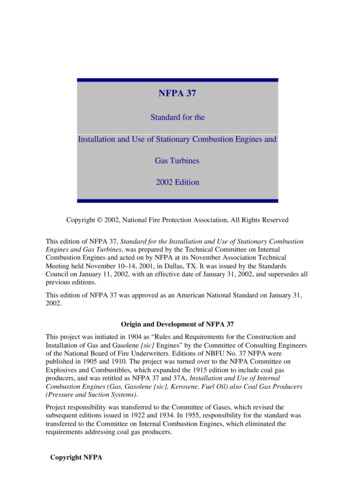
In 2015–2019, reported sprinkler failures (750 per year) were more thantwice as common as reported fires in which sprinklers were ineffective(340 per year). Figure 13 shows the breakdown of each cause of failure orineffectiveness individually and combined. For example, manualintervention was blamed for 13 percent of the total situations in whichsprinklers were either ineffective or failed to operate at all. As notedearlier, manual intervention was blamed for 18 percent of the fires inwhich sprinklers failed to operate and 2 percent of the fires in which theywere ineffective.39%57%0%Water did not reach fireManual intervention50%13%18%2%Not enough water discharged10%0%Lack of maintenance31%3%8%10%8%9%7%System components damagedInappropriate system for typeof %The categories in Figures 11–13 are based on NFIRS and sometimesoverlap.Long, Wu, and Blum explored the root causes of unsatisfactory sprinklerperformance, dividing them into the following broad categories: 7 “Failure to assure adequacy of the system and/or for the completecoverage of current hazard.” Problems with the initial plans,installation errors, and changes to the structure or its contents could becaptured here.“Defects affecting, but not involving, the sprinkler system.” Thisincludes water supply problems and building construction issues.“Inadequate performance by the sprinkler itself.” Sprinkler systemshave numerous components. A failure of one component can impactthe larger system.All other situations, including fires that started on the structure’sexterior, delays in notifying the fire department, etc.Civilian Deaths in Sprinklered PropertiesWhile sprinklers were present in 10 percent of all the properties in whichfires occurred in 2015–2019, only 1 percent of all the fire deaths occurredin these properties. Fires in sprinklered properties killed an average of 36people per year in 2015–2019. Fires in properties that were not underconstruction and had no automatic extinguishing systems caused anaverage of 2,816 civilian deaths per year.16%0% Figure 13. Reasons for combined sprinkler failure andineffectiveness: 2015–2019System shut off “Failure to maintain operational status of the system.” Regularinspection, testing, and maintenance are essential to ensure sprinkleroperability. Water being shut off before or during a fire is included inthis category.In fires that were large enough to activate sprinklers, 21, or 87 percent, ofthe fatalities per year resulted from fires in which the sprinklers operated.Of those who died in fires with operating sprinklers, 18, or 86 percent,died in fires in which the sprinklers operated effectively. Taken together,18, or three-quarters (75 percent), of the 24 victims of fires large enoughto activate sprinklers per year were fatally injured in fires in which thesprinklers operated and were effective.Figure 14 shows that nine, or one-quarter, of the 36 victims per year offires in sprinklered properties were fatally injured in fires that neverbecame large enough to activate the sprinklers. In other cases, thesprinklers extinguished the fire. Victims in fires with sprinklers weretypically fatally injured before the sprinklers activated. In both situations,the victims were usually intimate with the ignition. In some cases, thevictim had been smoking in bed or while using medical oxygen. TheNFPA Research pg. 7
victim’s clothing may have caught fire while the victim was cooking orsmoking.Figure 14. Civilian fire deaths by sprinklerperformance: 2015–2019Fire too small to operate, 24%Operated andeffective, 51%Failed to operate, 9%Operated but ineffective, 8%Unclassified operation, 8% In 2015, a resident of a 7-story North Carolina apartment building wasfatally injured when he lit a cigarette while using medical oxygen. Theliving room sprinkler extinguished his burning clothes and chair. 8Compared to victims of fires in which no AES was present, people whodied in fires in which sprinklers operated were more likely to have been inthe area of origin, been at least 65 or older, been wearing clothing thatcaught fire, or been unable to act, and even more likely to have beeninvolved in the ignition and in the area. Figure 15 shows this contrast.Note that many of these differences are also evident among victims offires with and without working smoke alarms. 9There are limits to even the best fire protection. When someone is directlyinvolved in the ignition of a fire or their clothing is burning, they may befatally injured before the sprinkler system operates. If someone isphysically incapable of getting themself to safety, even a fire controlledby sprinklers can still cause harm.Three-quarters (76 percent) of the fire deaths in sprinklered propertiesresulted from fires that were confined to the object or room of origin. Thiswas true for only 18 percent of the deaths from fires in which no AES waspresent. When present, sprinklers keep the fire from spreading andthreatening those in other areas. A fire that is confined to the room oforigin is much less dangerous to those outside the room.Multiple death fires are rare when sprinklers are present. However, asmentioned earlier, exterior fires can challenge sprinkler protection. Inaddition, explosions can damage a sprinkler system, rendering itineffective or non-functional.Two fires in 2015–2019 in which sprinklers were present resulted in fourdeaths each. Figure 15. Victim characteristics in fireswith operating sprinklers vs. with no AES:2015–2019Victim in area of origin87%50%Involved in ignition and in area66%35%21%16%Not involved but in areaVictim 65 or older36%Clothing on fire7%Unable to act12%0%20%39%32%40%53% Operating sprinklersNo AES60%80%100%Around 2:00 a.m. one morning in March 2017, a fire department wasalerted to a fire at a Maryland assisted living facility of unprotectedwood-frame construction. 10 One employee and six adult residentswere in the structure at the time of the fire. All the residents requiredassistance to evacuate. A discarded cigarette had ignited leaves andgrass outside the building. The flames spread to the exterior wall,porch, and into the confined ceiling space. Both detection andactivation of the residential wet pipe sprinkler system were delayedbecause the fire was in the concealed space. Once activated, thesprinkler system controlled the fire. In addition to the four fatalities,three civilians were also injured.Around 9:30 p.m. on a May 2019 evening, an Illinois fire departmentwas notified of an explosion and fire at a silicone manufacturingplant. 11 The plant was operating at the time. The explosion damagedboth the detection and sprinkler systems, so they did not operate.NFPA Research pg. 8
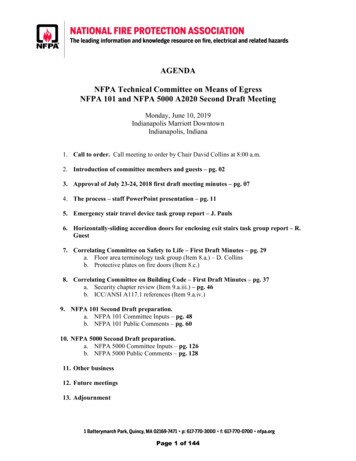
Unwanted ActivationsFire departments responded to an estimated average of 26,000 sprinkleractivations caused by a system failure or malfunction per year and 29,700unintentional sprinkler activations per year in 2015–2019. According tothe NFIRS 5.0 Complete Reference Guide, 12 false alarms due to sprinklerfailures or malfunctions include “any failure of sprinkler equipment thatleads to sprinkler activation with no fire present.” This category “excludesunintentional operating caused by damage to the sprinkler system.”Unintentional activations also include “testing the sprinkler systemwithout fire department notification.” The winter months of December,January, and February account for only one-quarter of the year yet Figure16 shows that 42 percent of the sprinkler system failures or malfunctionsoccurred in these three months, as did 36 percent of the unintentionalactivations. This suggests that cold weather and frozen pipes played arole.Figure 16. Unwanted sprinkler activations by type and month:2015–2019sprinklers: overheating, freezing, mechanical damage, corrosion,deliberate sabotage, and mechanical defects.Overheating can be caused by nearby equipment that may have beenadded after a sprinkler system was installed. While overheating typicallyaffects the sprinkler and not the piping, freezing can impact the pipes.Mechanical damage can occur when a sprinkler is bumped by somethingsuch as a ladder, forklift, or tossed objects. Deliberate sabotage includesvandalism and disabling sprinklers to increase fire damage. While rare,manufacturing defects can also occur.In a 2017 article, Huet, Martorano, and Ames described experimentsinvolving intentional damage simulating random microscopic flaws to morethan 100 glass bulb sprinklers. These were then exposed to a constant load ina test frame. 14 Forty-four of the sprinklers failed within 36 days, while theremaining 58 lasted more than two years. They concluded that unwantedactivations due to damaged sprinkler bulbs tended to occur within days orweeks of the damage. Such damage, if undetected, could explain unwantedactivations with no identifiable cause.25%20%20%Failure or malfunction17%15%Unintentional activation13%11%10%7%8%7% 7%7% 7%7%6%7% 6%7% 6%7% 7%7%6%7% 6%MarAprSprinklers in Home Fires9%8%5%0%JanFebMayJunJulAug SepOctNov DecNot all activations result in water flow outside the system. For example,water may flow in the pipes of a dry pipe system. This could alert amonitoring company and trigger a fire department response.In their 2012 article on investigating inadvertent fire sprinklerdischarges, 13 Blum, Long, and Dillon referred to Russ Fleming’s 2000description of the six primary reasons for non-fire discharges fromSprinkler Presence and TypeDuring 2015–2019, some type of fire sprinkler was present in an estimatedaverage of 23,600 reported home structure fires (7 percent) per year.Properties under construction were excluded from these estimates.Table B summarizes information about automatic extinguishing systems(AES), including sprinklers, in all reported home structure fires except thoseunder construction. According to the 2011 American Housing Survey,buildings with more housing units were more likely to have sprinklers.Figure 17 shows that 5 percent of housing units that are occupied yearround had sprinklers, ranging from a low of 1 percent in manufacturedhomes to a high of 31 percent in buildings with at least 50 units. 15NFPA Research pg. 9
Figure 18 shows that wet pipe sprinkler systems were present in nine outof every 10 reported home fires with sprinklers.Figure 17. Percentage of occupied units withsprinklers per the 2011 American Housing SurveyYear-round housing5%Manufactured homesFigure 18. Types of sprinkler systemspresent at home structure fires: 2015–20191%Single-family detached homes2%Single-family attached homes8%In all multi-unit buildings14%In buildings with 2–4 unitsWet pipe, 89%5%In buildings with 5–9 units9%In buildings with 10–19 unitsDry pipe, 9%15%In buildings with 20–49 units22%Other, 2%In buildings with 50 or more units31%0%10%20%30%40%Source: American Housing SurveyTable B. Summary of AES presence and type in reported home structure fires, excluding properties under construction:2015–2019 annual averagesAES Presence and TypeFiresCivilian DeathsCivilian InjuriesDirect Property Damage(in Millions)AES presentSprinklers present25,000(7%)24(1%)593(5%) 197(3%)23,600(7%)23(1%)555(5%) 194(3%)Wet pipe sprinkler system21,000(6%)22(1%)477(4%) 185(3%)Dry pipe sprinkler system2,100(1%)1(0%)69(1%) 8(0%)500(0%)0(0%)9(0%) 1(0%)1,400(0%)1(0%)38(0%) 3(0%)900(0%)5(0%)40(0%) 25(0%)Other type of sprinkler systemNon-sprinkler AES presentPartial system AES presentAES not in fire area and did not operateNone present500(0%)0(0%)28(0%) 24(0%)318,500(92%)2,587(99%)10,408(94%) ) 7,153(100%)NFPA Research pg. 10
Fires in Homes with Sprinklers vs. with No AESFigure 19 shows that the civilian death rate per 1,000 reported fires was88 percent lower in homes with sprinklers than in homes with no AESduring 2015–2019. These rates are based only on the reported presence orabsence of an AES; operation was not considered.Figure 19. Civilian death rates per 1,000 fires inhomes with sprinklers vs. with no AES:2015–2019With sprinklersFigure 21 shows that the average firefighter fireground injury rate per1,000 reported home fires was 78 percent lower when sprinklers werepresent than in fires with no AES.Figure 21. Firefighter injury rates per 1,000 firesin homes with sprinklers vs. with no AES:2015–2019With sprinklers11No AES511.00No AES2468Civilian deaths per 1,000 fires10Figure 20 shows that the civilian injury rate per 1,000 reported fires was28 percent lower in homes with sprinklers than in homes with no AES. Inmany cases, the injuries occurred in fires that were too small to activatethe sprinkler system. In others, someone was injured while trying to fightthe fire in the initial moments before the sprinklers operated. A 2012 FireProtection Research Foundation study found that sprinkler presence wasassociated with a 53 percent reduction in the medical cost of civilianinjuries per 100 home fires. 16330102030Civilian injuries per 1,000 fires405060Figure 22. Average loss per fire in homes withsprinklers vs. with no AES: 2015–2019With sprinklers 8.2No AES 21.7 5 10 15 20 25Average loss per fire in thousands of dollars24No AES30When sprinklers were present in reported home fires, the average propertyloss per fire was 62 percent lower than the average in homes with noAES. See Figure 22. 0Figure 20. Civilian injury rates per 1,000 firesin homes with sprinklers vs. with noAES: 2015–2019With sprinklers20Firefighter injuries per 1,000 fires8.101040Figure 23 shows that when sprinklers were present, almost all of the fireswere confined to the object or room of origin. The majority of civiliandeaths and injuries resulting from fires in homes with sprinklers werecaused by these fires. In home fires that lacked AES, only three-quartersof the fires were confined to the object or room of origin. Only one in fivedeaths and half of the injuries in home fires with no AES present resultedfrom such fires.NFPA Research pg. 11
Figure 23. Percent of home fires, injuries, andcasualties resulting from fires confinedto object or room of origin: 2015–2019Fires100%97%86%Civilian th sprinklersFailed to operate, 5%Operated ineffectively, 3%No AESIn rare cases, spr
Nursing home. NFPA Research pg. 3. Table A. Summary of AES presence and type in reported structure fires: 2015-2019 annual averages . AES Presence and Type Fires Civilian Deaths Civilian Injuries Direct Property Damage (in Millions) AES present 61,100 (13%) 37 (1%) 1,130 (9%) 1,086 (10%) Sprinkler system present 51,000 (10%) 36 (1% .