Transcription
ContentsIntroduction/1Background—Understanding the Concern about Debt/3Overview—Household and Public Debt in Canada, 1990 to 2016International Comparisons/18Micro Analysis—Household Debt and Net Worth/Assessment—Should Canadians Be Worried?28References/31About the AuthorAcknowledgments/35/Publishing Information36/37Supporting the Fraser Institute/38Purpose, Funding, and IndependenceAbout the Fraser InstituteEditorial Advisory Boardfraserinstitute.org///3940/3826/7
Household Debt and Government Debt in Canada Di Matteo iExecutive SummaryCanadians are regularly inundated with news stories about policy concerns over household debt. These concerns, however, can be seen to be overblown once we properlyaccount for the other side of the balance sheet. Canadian households have taken onmore debt over time but they have used this debt to finance assets—real estate, forexample—that are appreciating over time, causing their net worth to grow, also tounprecedented levels. The same cannot be said for government debt.Concerns about household indebtedness focus on measures such as total household debtaccumulated or the ratio of household debt to income. Based on these metrics, Canadianhousehold debt levels are indeed near historic highs. By the end of last year, householddebt reached over 2 trillion, up from 357 billion in 1990. The lion’s share of this debt—two thirds in fact—is for mortgages while the remaining third is split between consumercredit (29%) and other loans (5%). Over the same period, the total financial liabilities ofthe government sector grew from approximately 700 billion to 2.5 trillion while its netdebt grew from over 400 billion in 1990 to reach nearly 970 billion in 2016.The over 2 trillion in household debt is now approximately 170% of household disposable income, up from just 90% in 1990. Yet, this does not mean that Canadians arebeing irresponsible with household debt. To start, the above data ignore the fact thathousehold debt growth can be a rational response to falling interest rates. For instance,the Bank of Canada rate fell dramatically from nearly 13% in 1990 to 0.75% at the endof last year. Not surprisingly, as the cost of borrowing has dropped, Canadian households have borrowed more. The drop in interest rates has reduced the burden of servicing debt despite growing household debt: interest payments on household debt nowconsume 6% of disposable income, compared to almost 11% in 1990.More fundamentally, the concerns about household debt fail to account for the otherside of the balance sheet—household assets, which rise over the family life-cycle. Whilehousehold debt has grown substantially over the past 26 years, households are borrowing to invest in appreciating assets such as real estate, pensions, financial investments,and businesses. This has meant a substantial rise in Canadian household assets—from 2.2 trillion in 1990 to 12.3 trillion in 2016. The significant investment in assets hasfraserinstitute.org
ii Household Debt and Government Debt in Canada Di Matteomeant that household net worth (which is total assets minus liabilities) has surged from 1.8 trillion to 10.3 trillion—a record-setting level. As well, when taken in internationalcontext, Canada’s household debt relative to income is mid-ranked amongst OECDcountries when household debt is taken as a share of household disposable income.Government officials express concern about household debt even though householdshave positive net worth that has trended up over time. Yet, government measures ofnet worth are negative and have not changed substantially. Specifically, the collectivenet worth of Canadian governments was negative 129 billion in 1990, compared tonegative 97 billion last year. While governments may acquire some financial assets andthere is investment in assets like human capital and physical infrastructure, the bulk ofdebt acquired through deficit financing often supports spending on the compensation(wages and benefits) of government employees and transfers to individuals.In the end, debt is a tool and the concern should be not with debt per se but debt that is notmanageable given the economic circumstances facing households. The greatest risks to themanagement of household debt are economic shocks that lead to job losses that make debtservicing problematic, or increases in the interest rate that raise debt servicing costs.To date, although small increases have been forecast, interest rates have remained lowand the Canadian economy is performing adequately, with relatively low unemploymentrates. Moreover, while interest rates and unemployment are of concern, they should beweighed against the fact that, despite the record high levels of household-sector debt,there are also record high levels of net worth. As for public-sector debt, large deficitsand increasing debt particularly at the federal level are expected to continue.fraserinstitute.org
Household Debt and Government Debt in Canada Di Matteo 1IntroductionHigh levels of both household debt and government debt are an important publicpolicy issue. Indeed, there are numerous studies and frequent media stories statingthat Canadian household debt has reached record levels with inevitable comparisons tothe United States on the eve of the 2008/09 global financial and economic crises. Forexample, Chartered Professional Accountants (CPA) of Canada has tracked the issue ofCanadian household debt for many years and has noted a decline in the rate of growthof household debt but maintained that in the face of economic uncertainty the trendmight reverse (CPA Canada, 2015). Moreover, there has been a recent spike in reportsby international agencies that have linked rising levels of Canadian household debt withfinancial markets and soaring home prices. [1] Most recently, the Governor of the Bankof Canada has noted that the dual threats of runaway regional housing markets andhousehold debt have grown (Parkinson, 2017).The release of Statistics Canada’s national balance sheets for the fourth quarter of 2016showed that the ratio of household debt to disposable income grew to 167.3% from166.8% in the third quarter (Statistics Canada, 2017). Total household credit-marketdebt by the end of 2016 reached 2.03-trillion, with 1.33-trillion in mortgage loans and 596.5-billion in consumer credit-card debt, car loans, and other personal loans. Put differently, mortgages made up approximately two thirds of household credit-market debt(65.5%) while consumer credit made up less than a third (29.3%). As well, total household credit-market debt increased 1.2% in the fourth quarter of 2016 while disposableincome increased 1.1% (Statistics Canada, 2017). Over time, the share of consumercredit has increased slightly, the share of non-mortgage loans has decreased slightly,and the share of mortgage loans remained stable. [2]The growth of household debt in Canada generates alarm because of the inevitablecomparisons to the US experience between 2005 and 2010, which combined high debt[1] For example, the OECD in March 2017 presented another in a long line of warnings about householddebt (Babad, 2017). Also in March, the Bank for International Settlements warned about the increase in theCanadian ratio of credit to GDP (Shecter, 2017). The Bank of Canada has also weighed in on the issue withone of the more recent forays being the December 2016 Financial System Review (Bank of Canada, 2016).[2] Between 1990Q1 and 2016Q4, the consumer credit share of household debt rose from 26.4% to 29.3%while mortgage loans rose from 64.9% to 65.5%.fraserinstitute.org
2 Household Debt and Government Debt in Canada Di Matteolevels with the collapse of the US housing market. Canadian household debt relative toincome has indeed grown to surpass not only the United States but also other G-7 countries (Isfeld, 2016). However, while household debt in Canada has grown in recent years,and generated some alarm in public-policy circles, it is important to look at the issue inan objective fashion that goes beyond simply exhortations of alarm. As one study notesabout the frequent alarm raised by household debt: “If the headline that ‘householddebt has hit a record level’ seems familiar, it is because it has been true for every yearbut one over the last half century” (Cross, 2015: 2). Debt has been a long-term featurein human economic history as a tool to facilitate commerce. [3] Ultimately, it is not debtitself that should be of concern but the ability of both households (and government) tomanage their debt responsibly.This paper compares household debt and public debt in Canada and assesses howconcerned we should be about the current state of household and public indebtedness. While both household debt and public-sector debt have grown over time, in thecase of households, net worth has also grown substantially. There are some risks tothe situation, especially about the ability to carry large amounts of debt should theeconomy experience a downturn as well as the potential for future increases in interest rates. In the case of Canadian public-sector debt, there are renewed concerns, particularly given the federal government’s intention to substantially delay returning to abalanced budget.[3] Graeber provides a long-term account of debt and credit as tools underpinning trade going back 5,000years. Indeed credit systems preceded or accompanied the rise of money because actual money—coinage—was often in short supply. Credit or virtual money was actually first (2011: 40).fraserinstitute.org
Household Debt and Government Debt in Canada Di Matteo 3Background—Understandingthe Concern about DebtIn examining financial indicators, MacGee notes that “current debt levels are likelysustainable, but there is some cause for concern that a major economic shock—such asa worsening of the European debt crisis—could trigger a large pullback in borrowingand consumption, resulting in a potentially deep recession” (2012: 3). MacGee (2012:9) also notes that consumer bankruptcies have grown substantially since the 1970s [4]but that, despite the rise in filings, the key characteristics of a typical bankrupt remainthe same—namely, the individuals are 30% to 50% poorer than the average household,in their thirties, and with a high debt-to-income ratio. Moreover, the evidence frompast stress tests conducted by the Bank of Canada suggest that Canadian householdsand the banking system are well positioned to handle adverse economic shocks to theirfinancial positions (Dey, Djoudad and Terajima, 2008; Anand, Bédard-Pagé and Traclet,2014; MacDonald and van Oordt, 2017).At the same time, reassurances from banks and bank economists that all is well needto be taken cautiously given the obvious self-interest of banks when it comes to fostering loan activity. Despite continual warnings from outside international agencies such as the International Monetary Fund or the OECD, it is only recently thatCanadian banks have been sounding more of an alarm about housing prices and highlevels of mortgage debt (see, e.g., McGugan, 2017). Indeed, high debt levels may leaveCanadian families more vulnerable to large economic shocks such as a spike in interest rates or an economic downturn and job loss that make mortgage and credit-cardpayments difficult. [5][4] Consumer bankruptcies per 1,000 adults rose from less than 1 per 1,000 in the early 1970s to approximately 5 per 1,000 by 2010 (Magee, 2012: 7). It should be noted that there is also a cyclical component tobankruptcies and they tend to rise during periods of recession.[5] MacGee, 2012: 3. It should also be noted that Canada has regional economies and some regions may behit more by economic shocks than others. For example, Alberta has been recently hit by the downturn incommodity prices and consumer insolvencies in Alberta were up 34% over the previous year (Office of theSuperintendent of Bankruptcy Canada, 2017).fraserinstitute.org
4 Household Debt and Government Debt in Canada Di MatteoHousehold debtThe concerns over rising household debt also relate to concerns about the impact ofthis debt on economic performance. Labelle (2004) notes that much of the increase inhousehold debt can be attributed to the decrease in credit rationing following from thefinancial deregulation of the early 1980s and the subsequent reduction in both real andnominal interest rates as inflation declined. While household debt itself is not likely tobe the source of an economic shock, greater indebtedness has macroeconomic implications given that households have enhanced sensitivity to a rise in unemployment andunexpected changes in interest rates, especially if they tend to hold variable rather thanfixed-rate mortgages. As well, even in the absence of a downturn, increased indebtedness means that households are exposed to the prospect of negative equity if housingprices fall (Labelle, 2004: 57).Another aspect of growing household debt is that it is not equally shared among households. For example, one study notes that households with income under 50,000 weresix times more likely to be financially vulnerable in terms of the debt-service ratioand had a debt-to-income ratio 1.62 times higher than households with income in the 50,000 to 79,999 range (CGAA Canada, 2011). Another study found rising debt-toincome ratios among households in the bottom income quintile was one of the moreimportant developments in the early twenty-first century (Meh, Tarajima, Chen, andCarter, 2009).Debt is often acquired to purchase large expenditures that cannot be completely fundedout of current flows of income or revenue. There is a purpose to debt financing whenit comes to long-term investments in public and private assets that are vital to eithernational or household economic interests, and that involve large amounts that cannotrealistically be raised in the short term but must be spread out over time. The decisionstaken by a household to purchase a home, or by a government to build a national highway system are obvious examples.Much household debt is acquired to finance housing and therefore ultimately resultsin the acquisition of substantial net worth. During the run up to the US financial sector crisis and Great Recession, the debt and asset positions of Canadian householdswere relatively well matched and the household sector in Canada was in a better financial position than US households (Faruqui, 2008). On balance, the bulk of householddebt is acquired in the short term for the acquisition of both tangible (land) and intangible (financial) assets and occurs over the course of a family and economic life cycle.The life-cycle theory of consumption postulates that individuals will aim to smoothfraserinstitute.org
Household Debt and Government Debt in Canada Di Matteo 5consumption over their lifetimes but that income earning is uneven resulting in debtearly in life. [6] This is followed by asset acquisition through saving as income rises andthen consumption from acquired assets and pensions during retirement when one is nolonger earning an income from work. [7]Indeed, young families are more likely to hold debt. One study for Canada notes thatin 2009, individuals under age 45 made up 45% of the population but constituted 54%of borrowers while married people with children constituted 30% of the populationbut 39% of debtors (Chawla and Uppal, 2012: 5). Some debt is also incurred to financeacquisition of human capital (a post-secondary degree, for example) or even starting abusiness. Households acquire debt while young but generally aim to enter old age withsignificant assets: homes, pensions, retirement saving. [8] Indeed, recent debt increaseshave been largest in families at the beginning of their life cycle such as those from 35 to44 years old and couples with children, though even these families appear to have benefitted from large asset increases (Uppal and LaRochelle-Coté, 2015: 9).Government debtPublic—government—debt has also increased over time. While large accumulations ofeither public- or private-sector debt can be a cause for concern, it should be noted thatthere both the nature and the composition of debt acquired by governments differsfrom that of households. These differences make for some additional considerationswhen comparing fears about the rise of indebtedness and its impact. [9]Acquisition of debt by government is partly influenced by economic conditions thataffect tax revenues and expenditures resulting in deficits that add to debt. While[6] Life-cycle effects also mean that wealth distribution and inequality is affected by demographics. SeeSarlo, 2017.[7] For an overview see Modigliani and Brumberg, 1954; Friedman, 1957; and Browning and Crossley,2001. For the macroeconomic implications of household borrowing, see Labelle, 2004.[8] Uppal and LaRochelle-Coté (2015: 3) note that over the period from 1999 to 2012, younger familiesgenerally had higher levels of debt compared to assets than older families. In 2012, 78.6% of familieswhere the age of the major income earner fell between 15 and 34 years had debt while 42.5% of familieswhere the major income earner was older than 65 had debt.[9] Comparing households and government is of course also complicated by definitions of what isincluded and then measured in definitions of public sector, which in turn can differ when internationalcomparisons are made. For example, the Canada Pension Plan (CPP) and the Quebec Pension Plan (QPP)are included in the aggregate public sector in Canada. The OECD’s measure of net debt excludes government employee unfunded pension liabilities whereas they have been included in Canada’s public accountsshown in Statistic’s Canada’s Financial Management System since 2000. For a discussion, see Laurin, 2007.fraserinstitute.org
6 Household Debt and Government Debt in Canada Di Matteogovernments do make expenditures for investments in human capital and physicalinfrastructure, deficits are ultimately the result of spending that cannot be met byincoming revenues during a downturn and should disappear once the economy recovers.Deficits that persist even during economic upturns reflect structural imbalances inrevenue and spending and may reflect an inability of governments to curtail theirexpenditures.While governments also may acquire some financial assets and there is investment inlonger-term assets like physical infrastructure, the bulk of debt acquired is often used tofinance short-term spending and consumption. For example, Ontario has seen substantial growth in its provincial debt mainly as a result of exceptional spending rather thanany weakness in revenue, and about 66% of the increase in the province’s debt since the2008/09 recession was due to current expenses exceeding revenue rather than investment in infrastructure (Wen, 2015). Indeed, much of what government calls “investment” is really transfer payments, wages and benefits paid to government employees,and consumption that does not always result in the acquisition of substantial capitalassets (Robson, 2017). Governments can also acquire long-term debt for capital projectsthat add to national infrastructure. However, in the end, all the debt acquired by government is heavily affected by political choices and the desire by governments to winelections. [10]A key difference between the debt of private households and that of the public sector isthat the former is also accompanied by the acquisition of assets over the life cycle thatgenerate positive net worth. The data shows that households generally have positive networth that trends up over time, whereas government measures of net worth are usuallylow and have not increased substantially over time. While interest rate spikes can havedetrimental impacts on both government and household debt, it remains that the latteroften has a substantial cushion of assets to draw down upon.[10] There is a substantial literature on political business cycles and the relationship between economicconditions, elections, and government spending. See Nordhaus, 1975; Drazen, 2001; and, for Canada, arecent contribution by Voia and Ferris (2013).fraserinstitute.org
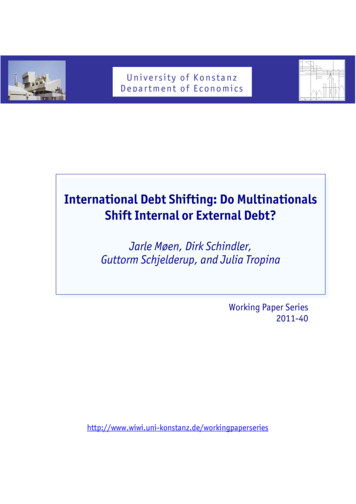
Household Debt and Government Debt in Canada Di Matteo 7Overview—Household and Public Debtin Canada, 1990 to 2016The data for this section was obtained from Statistics Canada, [11] which began collecting data on household debt in 1961. Household debt at the time was relatively smallgiven that acquisition of household debt and use of consumer credit was not as widespread. While paying by installment was a financial innovation of the 1920s, [12] evenmore widespread use of consumer credit dates from 1950 when the first credit-cardtransaction occurred in the United States. [13]Household debtFigure 1 plots real ( 2010) [14] and nominal quarterly total household credit-marketdebt—the sum of consumer credit, mortgage, and non-mortgage loans—in Canada. [15]Total nominal household credit market debt rose from 349 billion in the first quarterof 1990 and reached 2.03 trillion by the fourth quarter of 2016 for an annualized average quarterly growth rate of 6.8%—a rate of growth greater than the average annualgrowth rate from 1990 to 2016 of household disposable income (4.2%), GDP (4.3%), orinflation (1.9%). [16][11] Source for government and household debt data for this section: Statistics Canada, 2017c, CANSIMtable 378-0121, National Balance Sheet Accounts. Source for GDP: Statistics Canada, 2017d, CANSIM table380-0063, Gross Domestic Product. Source for household disposable income: Statistics Canada, 2017e,CANSIM table 380-0072, Current and Capital Accounts - Households.[12] The consumer durables boom of the 1920s in the United States was fueled by department stores andautomobile companies offering installment plans (New Deal democrat, 2008). Indeed, some have viewedthe Great Depression as a credit boom gone wrong (Eichengreen and Mitchener, 2003).[13] In 1961, total household debt (both consumer credit and mortgage debt) in Canada was 16 billion(Cross, 2015: 2–3).[14] CPI used as deflator. CPI Source: FRED, 2017.[15] Statistics Canada, 2017c, CANSIM table 378-0121, National Balance Sheet Accounts: series v62693986,v62693987, and v62693988.[16] Calculations by author. Data sources: Statistics Canada, 2017e, CANSIM table 380-0072, Current andCapital Accounts - Households: series v62305980; Statistics Canada, 2017d, CANSIM table 380-0063, GrossDomestic Product: series v62295562; Statistics Canada, 2017b, CANSIM table 326-0020, Consumer PriceIndex: series v41690973.fraserinstitute.org
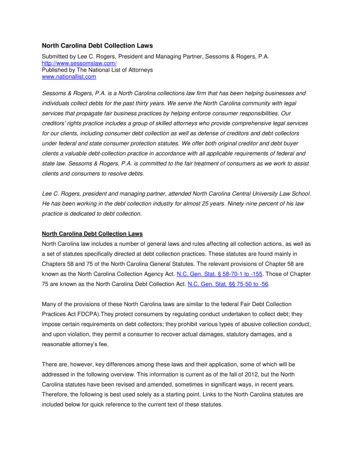
8 Household Debt and Government Debt in Canada Di MatteoFigure 1: Total household credit-market debt ( billions), 1990–20162,500Total debt billions2,000Real 200620082010201220142016Sources: Statistics Canada, 2017c, CANSIM table 378-0121, National Balance Sheet Accounts: seriesv62693986, v62693987, v62693988. CPI Source: FRED, 2017.It should be noted that the three main components of household debt are consumercredit, non-mortgage loans, and mortgage loans. Consumer credit currently makes upabout 29% of total household debt, non-mortgage loans about 5%, and mortgage loansabout 66% (table 1). Over the period from 1991 to 2016, the annualized quarterly nominal growth rate was 7.4% for consumer credit, 4.9% for non-mortgage loans, and 6.8%for mortgage loans.Table 1: Composition of household credit-market 2,028.7 billionsPercentage 5100.0Sources: Statistics Canada, 2017c, CANSIM table 378-0121, National Balance Sheet Accounts: series v62693986,v62693987, v62693988.While the average annual growth rate of household debt is high, it has varied over timeas illustrated in figure 2, which presents the annualized quarterly nominal growth ratefrom first quarter of 1991 to third quarter of 2016. Growth rates were particularly pronounced between 2003 and 2008 and they have since moderated. From 1991 to 1996,the average growth rate was 5% and it rose to 6.9% over the period from 1997 to 2002.Average annual growth was highest from 2003 to 2008—the period ending with thefraserinstitute.org
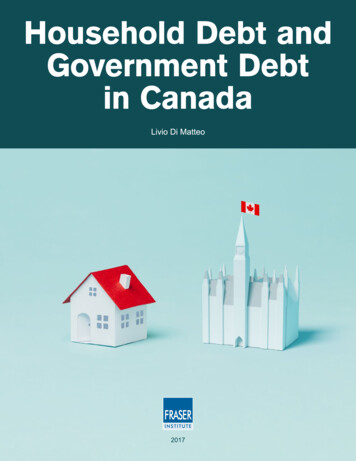
Household Debt and Government Debt in Canada Di Matteo 9Figure 2: Annualized quarterly growth rate (%), total householdcredit-market debt, 0022004200620082010201220142016Sources: Statistics Canada, 2017c, CANSIM table 378-0121, National Balance Sheet Accounts: seriesv62693986, v62693987, v62693988; author’s calculations.onset of the global financial crisis—at 10.4%. For the period from 2009 to 2016, theaverage growth rate of household debt has been only 5.5%, an appropriate response toslower income growth and increased economic uncertainty.It is not just the absolute size of household debt that is of importance but also the sizeof debt relative to the economy, which provides a better measure of the burden of debt.Figure 3 displays household debt in relation to gross domestic product (GDP) as well ashousehold disposable income. [17] It also plots the Bank of Canada rate over the sameperiod and graphically illustrates the broad relationship between falling interest ratesand the rise of household debt.The steepness of the upward trend of the ratios of household debt both to GDP and todisposable income has varied, with the most rapid growth again found in the periodfrom about 2000 to onset of the global financial crisis and Great Recession in 2008/09.Growth in household debt relative to measures of income has moderated substantiallysince 2009.Between 1990Q1 and 2000Q4, the ratio of household credit-market debt to GDP rosefrom 50.6% to 57.3% while the ratio of household credit-market debt to disposableincome rose from 87% to 109.2%. From 2001Q1 to 2009Q4, the ratio of household[17] It should be noted that usual comparison for household debt is relative to disposable income sincethat is the source of repayment. The ratio of household debt to GDP is included to facilitate comparison togovernment debt.fraserinstitute.org
10 Household Debt and Government Debt in Canada Di Matteo20015Household credit-market debt to disposable incomeDebt to income (%)16012120Household credit-market debt to GDP8096403Bank 012201420160Quarterly average Bank of Canada rate (%)Figure 3: Household debt-to-income measures and Bank of Canadarate, 1990–2016Sources: Household credit market debt: Statistics Canada, 2017c, CANSIM table 378-0121, NationalBalance Sheet Accounts: series v62693986, v62693987, v62693988; GDP: Statistics Canada, 2017d,CANSIM table 380-0063, Gross Domestic Product: series v62295562; Bank of Canada rate: StatisticsCanada, 2017a, CANSIM table 176-0043, Financial Market Statistics, series v122530.credit-market debt to GDP rose from 56.6% to reach 89.4% and then went on to reach98.1% by 2016Q4. Over the same time span, the ratio of household credit-market debtto disposable income went from 106.3% to 159.7% and then on to 170.4%.Between 1990Q1 and 2000Q4, the Bank of Canada rate fell from 12.97% to 6.0% andthen fell further to 0.5% by 2009Q4. Interest rates went up thereafter and by 2016Q4the Bank of Canada rate was sitting at 0.75%. [18] While falling interest rates are certainly a factor in the long-run debt acquisition by households, the persistence of lowinterest rates since 2009 has sparked only a modest increase in the ratios of householddebt to income compared to the decade prior to 2009.Of course, when examining household debt, the level and relative size of that debtneeds to also be considered alongside what the burden of carrying that debt is. Whiledebt has grown, the accompanying drop in interest rates has meant that the interestburden of servicing it has declined as a share of income. Figure 4 examines the burdento households of servicing their debt by plotting the household Debt Service Ratios[18] Since 1996, the Bank Rate has been set by the Bank at the top of its operating band for the overnight rate. The overnight rate is the interest rate at which major financial institutions borrow and lendone-day (or “overnight”) funds among themselves; the Bank sets a target level for that rate. This targetfor the overnight rate is often referred to as the Bank’s policy interest rate. For additional detail, see Bankof Canada, 2017.fraserinstitute.org
Household Debt and Government Debt in Canada Di Matteo 11Figure 4: Household debt-service ratios (%), 1990–201615Interest and principalPercentage129Interest 0201220142016Sources: Statistics Canada, 2017f, CANSIM table 380-0073, Selected Indicators-Households: seriesv99451479, v62306172.(DSRs) relative to disposable income. The household sector DSRs in figure 4 measurethe proportion of household disposable income devoted to making interest and interestplus-principal payments with respect to the sector’s total liabilities (See StatisticsCanada, 2015). It should be noted that when households take on debt, they ultimatelymust pay back principal plus interest unlike government, which rarely does so. [19]Interest payments as a share of household disposable income had fallen from 10.7% in1990Q1 to 6.1% by 2016Q4. When the measure is revised to also take into account therepayment of principal, there is an increase in the debt-service burden over time but ithas leveled off since the international financial crisis and Great Recession. [20] The ratioof interest-plus-principal repayment to disposable income rose from just over 12% in1990Q1 to peak at nearly 15% by the end of 2007 before declining to about 14%, whereit has remained since. Thus, by both measures, debt-service costs since 2007 have eitherdeclined or remained stable.[19] It has not always been the case that governm
ness. While both household debt and public-sector debt have grown over time, in the case of households, net worth has also grown substantially. There are some risks to the situation, especially about the ability to carry large amounts of debt should the economy experience a downturn as well as the potential for future increases in inter-est rates.