Transcription
Economic contribution of the USprivate equity sector in 2018Prepared for the American Investment CouncilOctober 2019
Economic contribution of the US private equity sector in 2018(Page intentionally left blank)
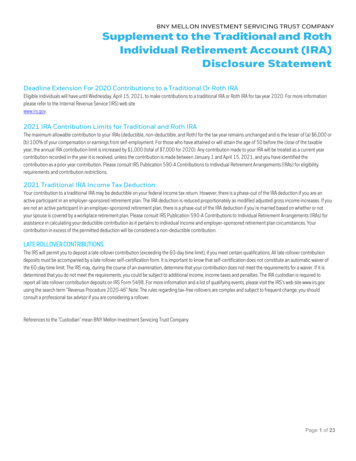
Executive summaryEY partnered with the American Investment Council (AIC) to estimate the current economicactivity of, and related to, the US private equity sector – US private equity firms and private equitybacked companies – within the US economy in 2018.Key findings include:Economic activity of the US private equity sector Employment and wage contribution. The US private equity sector provides employmentand earnings for millions of workers. Overall, in 2018, the US private equity sector directlyemployed 8.8 million workers earning 600 billion in wages and benefits. The average USprivate equity sector worker earned approximately 71,000 in wages and benefits in 2018.For a full-time worker this is approximately 36 per hour. Share of US economic activity. The US private equity sector directly generated 1.1trillion of value added in the United States in 2018. Value added measures a sector’s orindustry’s contribution to the production of final goods and services produced in the UnitedStates or US gross domestic product (GDP). The US private equity sector’s value addedcomprised approximately 5% of US GDP in 2018. Tax contribution. The US private equity sector generates tax revenue through US privateequity firms, private equity-backed companies, and its employees. In 2018, the US privateequity sector paid 174 billion of federal, state, and local taxes. Approximately two-thirdsof these were federal taxes ( 113 billion) with the remaining taxes paid to state and localgovernments ( 61 billion).Figure E-1. Employment, wages and benefits, and valueadded of the US private equity sector, 2018Note: Figure only includes economic activity of the US private equity sector (i.e., the economic activityat US private equity firms and private equity-backed companies). Wages and benefits include all laborincome (i.e., employee cash compensation and benefits, as well as proprietors’ income).Source: PitchBook; US Bureau of Economic Analysis; EY analysis.EY i
Economic activity related to the US private equity sector Suppliers to the US private equity sector. Suppliers to the US private equity sectoremployed an additional 7.2 million workers throughout the US economy earning 500billion in wages and benefits and generating 900 billion of US value added in 2018. Thiseconomic activity supported 144 billion of taxes - federal ( 93 billion) and state and local( 50 billion). Related consumer spending. The consumer spending of workers of the US privateequity sector and the sector’s suppliers employed an additional 10.4 million workersthroughout the US economy earning 600 billion in wages and benefits and generating 1.0 trillion of US value added in 2018. Consumer spending related to the US privateequity sector supported 157 billion of taxes - federal ( 102 billion) and state and local( 55 billion).Total economic activity of, and related to, the US private equity sectorIn total, the US private equity sector, the sector’s US suppliers, and the related US consumerspending employed an estimated 26.3 million workers earning 1.7 trillion in wages and benefitsand generating 2.9 trillion in US value added in 2018. Additionally, the federal, state, and localtaxes paid by, and related to, the US private equity sector totaled nearly 500 billion in 2018.Table E-1. Total economic activity of, and related to, the US private equity sector, 2018Millions of jobs; trillions of dollarsEmploymentWages & benefitsValue addedTaxes paidUS privateequitysectorSuppliers toUS privateequityRelatedconsumerspendingTotal8.8 0.6 1.1 0.27.2 0.5 0.9 0.110.4 0.6 1.0 0.226.3 1.7 2.9 0.5Note: Wages & benefits include all labor income (i.e., employee cash compensation andbenefits, as well as proprietors’ income). Taxes paid includes federal, state, and local taxes.Figures may not sum due to rounding.Source: EY analysis.EY ii
ContentsI. Introduction . 1Overview of private equity . 1II. Economic activity of the US private equity sector . 4III. Economic activity related to the US private equity sector . 6IV. State distribution of economic activity of, and related to, the US private equity sector . 9V. Taxes paid by, and related to, the US private equity sector .13VI. Caveats and limitations .16Appendix .17Endnotes.18EY iii
Economic contribution of the US private equity sector in2018I. IntroductionEY partnered with the American Investment Council (AIC) to estimate the current economicactivity of, and related to, the US private equity sector – US private equity firms and private equitybacked companies – within the US economy in 2018. The US private equity sector providesemployment and earnings for millions of workers and contributes jobs and earnings to othersectors of the US economy that relate to private equity operations.Overall, in 2018, the US private equity sector directly employed 8.8 million workers throughoutthe US economy earning 600 billion in wages and benefits and generating 1.1 trillion of valueadded. Suppliers to the US private equity sector employed an additional 7.2 million workersthroughout the US economy earning 500 billion in wages and benefits, generating 900 billionof value added. The consumer spending of workers of the US private equity sector and thesector’s suppliers employed an additional 10.4 million workers throughout the US economy,earning 600 billion in wages and benefits and generating 1.0 trillion of value added.Overview of private equityPrivate equity firms partner with investors to form funds that invest in companies, primarily thosein need of retooling or that seek growth. The aim of the investment, which often takes the form ofa majority stake, is to help bolster the company through use of the private equity firm’s access tocapital and its strategic, financial, and operational expertise. Ultimately, transforming the targetcompany to operate more efficiently and effectively generates returns for the private equity fund,the private equity firm that sponsors the fund, and the fund’s limited partner investors.Private equity firms partner with a variety of investor types, including pension funds, universityendowments, charitable foundations, and insurance companies. Private equity funds investacross a range of industries such as energy, healthcare, manufacturing, retail, and technology. In2018, the US private equity sector included more than 3,800 private equity firms and 15,000 PEbacked companies. Jobs at private equity firms are estimated to be roughly 1% of US privateequity sector employment.Though some sector participants use the term private equity in different ways, for the purposesof this analysis private equity only includes private investment in growth capital or establishedcompanies aiming to improve and strengthen the companies. In contrast, venture capital – whichis not included in the definition of private equity used for this analysis – consists of privateinvestment in startup and early stage companies.The most common private equity fund types are: (1) buyout funds, and (2) growth equity funds.For the purposes of this study all deals in both subcategories will be referred to as private equityfunds.EY 1
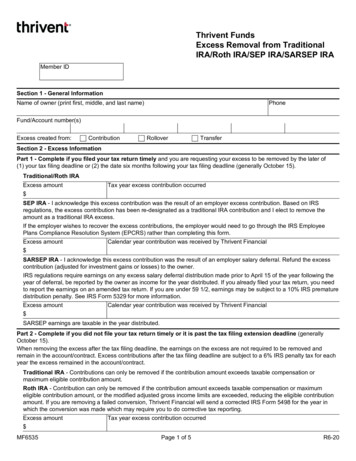
Private equity funds that invest in more mature businessesAn established company may, perhaps due to increased competition, the changing structure ofan industry or its markets, or high overhead costs, perform below its potential. Identifying andaddressing the root cause of underperformance, however, is often a complex task that requiresexpertise and potentially significant infusions of capital. A private equity fund can provide both.Obtaining a controlling stake in such a company often requires significant investment. A privateequity fund often finances acquisitions, in part, through debt issuance, a sometimes cost effectivemethod for such transactions. In a typical case, the target company’s future cash flows are thecollateral. The private equity fund generates returns on its investment by maximizing profits netof interest expenses and payments of the debt principal. A successful private equity fund oftenhas significant expertise in helping lift the performance of target companies, and both the privateequity fund and target company can benefit from a buyout.In addition, achieving higher performance may involve changes in higher-level management orrefocusing of the target’s business purposes by spinning off peripheral business components.Sweeping changes to a company are not always welcome by all stakeholders, particularly in theshort term. The intervention of an outside actor can be not only beneficial, but critical to achievechange and realign a target company.Notably, given the access to capital and expertise of private equity firms, as well as their ability toeffectuate change on a large scale, private equity-backed companies often have better prospectsfor experiencing rapid growth and restructuring as compared to similar companies without aprivate equity investment. As seen in Figure 1, a recent study analyzing the performance of 3,200private equity-backed companies with more than 150,000 establishments from 1980 through 2005estimates that, on average, two years after a private equity investment the productivity of a privateequity-backed company increases significantly with a near-zero net employment change relativeto a comparable company without private equity investment.1 The study found that, relative to acomparable company, an average private equity-backed company was more likely to reduce acompany’s low-productivity establishments, grow a company’s high-productivity establishments,and create new high-productivity establishments; that is, refocus the company on its higherproductivity activities.EY 2
Figure 1. Estimated average impact of private equityinvestment in a company after two yearsNote: Figure shows the average changes to a company with a private equity investment relative to a comparablecompany without it. That is, the changes displayed are estimates of what would have happened to a private equitybacked company, on average, if not for a private equity investment. Results are from an analysis of 3,200 PE-backedcompanies with more than 150,000 establishments over the 1980-2005 period for two years after the LBO.Source: Davis et al. (2014) and Davis et al. (2019).Growth equity fundsGrowth equity funds are private equity funds that invest in companies earlier in their lifecycle, tofoster expansion. Growth equity target companies often have established business models,revenues, and operating profits, but are unable to raise sufficient capital to undertake a significantexpansion. Such an expansion could include moving the company into new markets, facilitatingnew product development, or possibly a strategic acquisition.The target company for a growth equity fund, were it not for such investors, could be in a difficultspot. There are significant cost and regulatory hurdles to raising public capital. The targetcompany might also not be able to rely on venture capital investment. Venture capital generallyspecializes in providing relatively smaller levels of financing and generating returns from very highrevenue growth from very young companies that might be less likely from a more establishedcompany. Growth equity private equity funds, in effect, are a middle ground between venturecapital that targets startup companies and private equity funds that focus on well-establishedcompanies in need of retooling.Growth equity investors rely on the company’s revenue growth to generate returns, which can beaccomplished by providing the additional capital, as well as through strategic and operationalsupport from the private equity firm. Growth equity funds typically undertake a significant role inthe target company’s day-to-day operations.EY 3
II. Economic activity of the US private equity sectorThe US private equity sector, comprised of US private equity firms and private equity-backedcompanies, provides employment and income for millions of workers and contributes jobs in othersectors of the economy that are connected to private equity operations.The economic activity described in this report includes the following indicators: Employment. Employment is measured as the total headcount of workers. For example,a company with three full-time workers and a company with two full-time workers and onepart-time worker would both be measured as having three workers. Wages and benefits. Wages and benefits include employee cash compensation andbenefits as well as proprietor income.2 Value added. Value added measures a sector’s contribution to the production of all finalgoods and services produced in the United States, or US gross domestic product (GDP).As displayed in Table 1, the US private equity sector supported 8.8 million jobs in 2018. The tablealso displays the type of economic activity of these jobs. The largest share of US private equitysector employment was estimated to be in personal services. Personal services accounted for2.3 million jobs, or 26% of US private equity sector employment in 2018. These services includehealthcare, accommodation, food services, recreation, and other personal services.Business services employed the second largest share of US private equity sector workers with2.0 million jobs, or 23% of US private equity sector employment. Business services includefinance and insurance, real estate and rental and leasing, professional, scientific, and technicalservices, management of companies and enterprises, administrative and support services, andwaste management and remediation services. Included in business services are US private equityfirms. However, the vast majority of US private equity sector workers were estimated to beemployed at private equity-backed companies, as opposed to private equity firms. Jobs at privateequity firms are estimated to comprise roughly 1% of US private equity sector employment.3US private equity sector employment in manufacturing is the third largest segment of the sector’semployment. In particular, 1.9 million workers were estimated to be employed in manufacturingin 2018. This is 22% of total US private equity sector employment. These three segments of theUS private equity sector – personal services, business services, and manufacturing – comprisenearly three-quarters of the sector’s total employment. Other significant segments of the sectorinclude retail trade (0.9 million jobs; 10% of total), information (0.5 million jobs; 6% of total),construction (0.5 million jobs; 6% of total), transportation and warehousing (0.3 million jobs; 4%of total), and wholesale trade (0.2 million jobs; 2% of total).EY 4
Table 1. US private equity sector employment by type of economic activity, 2018Millions of jobsJobsPersonal servicesBusiness servicesManufacturingRetail tradeInformationConstructionTransportation and warehousingWholesale tradeMining, quarrying, and oil and gas extractionUtilitiesAgriculture, forestry, fishing, and huntingTotal employment2.32.01.90.90.50.50.30.2***8.8% of total26%23%22%10%6%6%4%2%***100% *Less than 0.05 million jobs or 0.5%Note: PitchBook industry classifications have been mapped to the North AmericanIndustry Classification System (NAICS) codes. Figures may not sum due to rounding.Source: PitchBook; EY analysis.Overall, in 2018, the US private equity sector employed 8.8 million workers throughout the USeconomy who earned 600 billion in wages and benefits and generated 1.1 trillion of valueadded.4 This amounts to an average worker in the US private equity sector earning approximately 71,000 in wages and benefits.5 For a full-time worker this is approximately 36 per hour.6Additionally, as summarized in Figure 2, the 1.1 trillion of value added of the US private equitysector in 2018 was approximately 5% of US GDP ( 20.6 trillion in 2018).7Figure 2. Employment, wages and benefits, and valueadded of the US private equity sector, 2018Note: Figure only includes economic activity of the US private equity sector (i.e., the economic activityat US private equity firms and private equity-backed companies). Wages and benefits include all laborincome (i.e., employee cash compensation and benefits as well as proprietors’ income).Source: PitchBook; US Bureau of Economic Analysis; EY analysis.EY 5
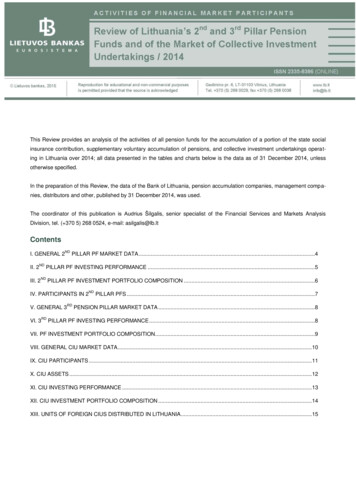
III. Economic activity related to the US private equity sectorIn addition to the economic activity of the US private equity sector, this report also estimates therelated economic activity of: (1) suppliers to the US private equity sector, and (2) related consumerspending: Suppliers to the US private equity sector. The US private equity sector purchases goodsand services from other businesses, which support jobs, wages and benefits, and value addedat these supplier businesses. For example, the US private equity sector’s expenditures onutilities, telecommunications, raw materials, and security, among other goods and services,support sales at suppliers. Moreover, demand for these goods and services leads to additionalrounds of economic activity as suppliers to the US private equity sector purchase operatinginputs from their own suppliers. Goods and services imported from abroad are not included inthis report’s estimates of US economic activity. Related consumer spending. Related consumer spending refers to the consumer spendingsupported by workers in the US private equity sector and their suppliers. When these workersspend their earnings at US businesses (e.g., grocery stores, retailers, movie theaters), theysupport economic activity in those sectors. The earnings that these workers spend on food ata restaurant, for example, creates jobs at the restaurant and at farms, transportationcompanies, and other industries that are involved in the restaurant’s supply chain.The magnitude of the economic activity related to the US private equity sector is estimated withthe 2017 Impacts for Planning (IMPLAN) input-output model of the United States. The model,which describes US economic linkages as they existed in 2017, was scaled to the size of the 2018US economy to estimate the economic activity related to the US private equity sector. Unlike othereconomic models, IMPLAN includes the interaction of more than 500 industries, thus identifyingthe interaction of specific industries that are related to the US private equity sector. See theAppendix for further details.As displayed in Figure 3, suppliers to US private equity were estimated to support 7.2 million jobsthroughout the US economy in 2018. The largest segments of suppliers to the US private equitysector were estimated to be business services (3.2 million jobs; 45% of total), manufacturing (1.0million jobs; 14% of total), and personal services (0.8 million jobs; 11% of total). These threesupplier industries comprise nearly three-quarters of the total employment related to suppliers tothe US private equity sector. The remaining related supplier employment includes transportationand warehousing (0.6 million jobs; 9% of total), wholesale trade (0.5 million jobs; 7% of total),agriculture, forestry, fishing, and hunting (0.4 million jobs; 5% of total), retail trade (0.2 millionjobs; 2% of total), information (0.2 million jobs; 2% of total), mining, quarrying, and oil and gasextraction (0.1 million jobs; 2% of total), construction (0.1 million jobs; 2% of total), and utilities(0.1 million jobs; 1% of total).Consumer spending of workers in the US private equity sector and the sector’s suppliers wasestimated to support 10.4 million jobs throughout the US economy in 2018. The largest segmentsof employment related to the consumer spending of workers in the US private equity sector andthe sector’s suppliers were estimated to be personal services (4.8 million jobs; 46% of total),business services (2.6 million jobs; 25% of total), and retail trade (1.3 million jobs; 13% of total).These three industries comprise more than three-quarters of the related economic activity. TheEY 6
remaining employment related to the consumer spending of workers in the US private equitysector and the sector’s suppliers includes manufacturing (0.5 million jobs; 5% of total),transportation and warehousing (0.4 million jobs; 4% of total), wholesale trade (0.3 million jobs;3% of total), agriculture, forestry, fishing, and hunting (0.2 million jobs; 2% of total), information(0.2 million jobs; 1% of total), and construction (0.1 million jobs; 1% of total).Figure 3. Economic activity related to the US private equity sector, 2018Millions of jobs; share of totalRelated to consumer spendingRelated to suppliersAgriculture, forestry,fishing, and hunting4.8m46%0.8m11%Personal servicesWholesale trade0.5m5%1.0m14%ManufacturingTransportationand warehousing2.6m25%3.2m45%Business services0.4m4%0.6m9%0.3m3%0.5m7%0.2m2%0.4m5%Retail trade0.2m2%Information0.2m2%Mining, quarrying, andoil and gas .3m13%0.2m1%7.2million jobsrelated to suppliersto the US privateequity sector*0.1m1%*10.4million jobsrelated to consumerspending of workersin the US privateequity sector and thesector's suppliers*Less than 0.05mNote: Industry definitions are based on the North American Industry Classification System (NAICS).Figures may not sum due to rounding.Source: EY analysis.Table 2 summarizes the estimated economic activity of, and related to, the US private equitysector in the 2018 US economy. The private equity sector directly employed a total of 8.8 millionworkers throughout the US economy who earned 600 billion in wages and benefits andgenerated 1.1 trillion of value added. Suppliers to the US private equity sector employed anadditional 7.2 million workers throughout the US economy who earned 500 billion in wages andbenefits and generated 900 billion of value added. In addition, the consumer spending of workersin the US private equity sector and its suppliers employed 10.4 million workers throughout the USeconomy who earned 600 billion in wages and benefits and generated 1.0 trillion of valueadded.EY 7
Table 2. Total economic activity of, and related to, the US private equity sector, 2018Millions of jobs; trillions of dollarsEmploymentWages & benefitsValue addedUS privateequitysectorSuppliers toUS privateequityRelatedconsumerspendingTotal8.8 0.6 1.17.2 0.5 0.910.4 0.6 1.026.3 1.7 2.9Note: Wages & benefits includes all labor income (i.e., employee cash compensation andbenefits as well as proprietors’ income). Figures may not sum due to rounding.Source: EY analysis.EY 8
IV. State distribution of economic activity of, and related to, the USprivate equity sectorThe distribution of jobs, wages and benefits, and value added by state (plus the District ofColumbia) of the economic activity of the US private equity sector is displayed in Table 3 andFigure 4. The states estimated to have the most US private equity sector employment are: (1)California (1.1 million jobs), (2) Texas (703,000 jobs), (3) New York (609,000 jobs), (4) Florida(523,000 jobs), and (5) Pennsylvania (369,000 jobs).Table 3. Economic activity of the US private equity sector by state, 2018Thousands of jobs; billions of adoConnecticutDelawareDistrict of sMichiganMinnesotaMississippiMissouriJobsWages 2212101215417312925720MontanaNebraskaNevadaNew HampshireNew JerseyNew MexicoNew YorkNorth CarolinaNorth DakotaOhioOklahomaOregonPennsylvaniaRhode IslandSouth CarolinaSouth est VirginiaWisconsinWyomingUnited StatesJobsWages 782628211557115152131 623378628568323371113423143199112324264222 1,052Note: Table only includes employment at US private equity firms and private equity-backed companies.Wages & benefits includes all labor income (i.e., employee compensation and proprietor income). Figuresmay not sum due to rounding.Source: PitchBook; EY analysis.EY 9
Figure 4. Economic activity of the US private equity sector by state, 2018Thousands of jobsNote: Figure only includes employment at US private equity firms and private equity-backed companies. Figures may not sum due to rounding.Source: PitchBook; EY analysis.EY 10
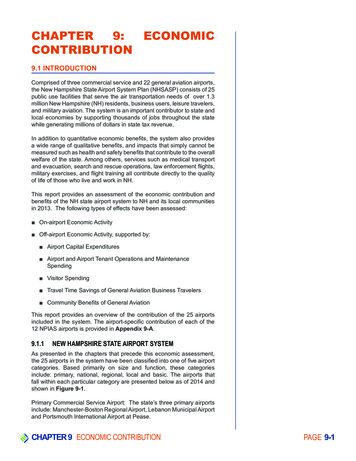
The distribution of jobs, wages and benefits, and value added by state (plus the District ofColumbia) of economic activity of, and related to, the US private equity sector is displayed inTable 4 and Figure 5. The states estimated to have the most employment in or related to the USprivate equity sector are: (1) California (3.4 million jobs), (2) Texas (2.2 million jobs), (3) New York(1.7 million jobs), (4) Florida (1.4 million jobs), and (5) Illinois (1.1 million jobs).Table 4. Total economic activity of, and related to,the US private equity sector by state, 2018Thousands of jobs; billions of adoConnecticutDelawareDistrict of sMichiganMinnesotaMississippiMissouriJobsWages ontanaNebraskaNevadaNew HampshireNew JerseyNew MexicoNew YorkNorth CarolinaNorth DakotaOhioOklahomaOregonPennsylvaniaRhode IslandSouth CarolinaSouth est VirginiaWisconsinWyomingUnited StatesJobsWages 41112104571095446217217052453214419439397383 665 2,889Note: Table includes employment at US private equity firms and private equity-backed companies as wellas the related supplier and consumer spending employment. Wages & benefits includes all labor income(i.e., employee compensation and proprietor income). Figures may not sum due to rounding.Source: PitchBook; EY analysis.EY 11
Figure 5. Total economic activity of, and related to, the US private equity sector by state, 2018Thousands of jobsNote: Figure includes employment at US private equity firms and private equity-backed companies as well as the related supplier andconsumer spending employment. Figures may not sum due to rounding.Source: PitchBook; EY analysis.EY 12
V. Taxes paid by, and related to, the US private equity sectorThe US private equity sector generates tax revenue through US private equity firms, privateequity-backed companies, and their employees. Additionally, taxes are paid by the suppliers tothe US private equity sector and paid on worker-related consumer spending. Table 5 summarizesthe federal, state, and local taxes paid by, and related to, the US private equity sector in 2018.The estimates of taxes paid include all major federal, state, and local taxes (e.g. corporate andindividual income taxes, sales and excise taxes, property taxes), where applicable. Taxes paidby the US private equity sector are displayed separately for those paid by businesses and thosepaid by its employees.Table 5. Table 5. Federal, state, and local taxes paid by,and related to, the US private equity sector, 2018Billions of dollarsUS private equity sectorBusinesstaxesEmployeetaxesTotalSuppliersto USprivateequityFederal taxesIndividual income taxesPayroll taxesCorporate income taxesExcise taxesCustoms duties and fees 36721710 775221021 1135942731 934934631 1025337731State and local taxesProperty taxesSales taxesIndividual income taxesExcise, license, and other taxesCorporate income taxes 26116262 35991350 61191514112 5016121292 55171313102Total taxes 63 112 174 144 157RelatedconsumerspendingNote: Figures may not sum due to rounding.Source: EY analysis.As seen in Table 5, the US private equity sector generated 174 billion of federal, state, and localtaxes in 2018. Approximately two-thirds of these were federal taxes ( 113 billion) with theremaining taxes being paid to state and local governments ( 61 billion). More than two-thirds ofthe 113 billion of federal taxes paid were employee taxes ( 77 billion). These were primarilyindividual income taxes ( 52 billion) and payroll taxes ( 21 billion). State and local taxes weremore evenly split between major tax types: property taxes ( 19 billion), sales taxes ( 15 billion),individual income taxes ( 14 billion), excise, license, and other taxes ( 11 billion), and corporateincome taxes ( 2 billion). Overall, this 174 billion of taxes comprised more than 3% of totalfederal, state, and local tax revenues in 2018.Table 5 also summari
private equity sector worker earned approximately 71,000 in wages and benefits in 2018. For a full-time worker this is approximately 36 per hour. Share of US economic activity. The US private equity sector directly generated 1.1 trillion of value added in the United States in 2018. Value added measures a sector's or