Transcription
Q4 2015New VehicleLeasing: Facts,Figures and FutureConsiderationsAT A GLANCE A history of new vehicle leasingLeasing’s role in the recovery of new vehiclesales post–Great Recession Lease origination and maturity trends Used vehicle price implicationsNADA Used Car Guide and its logo are registered trademarks of National AutomobileDealers Association, used under license by J.D. Power and Associates.
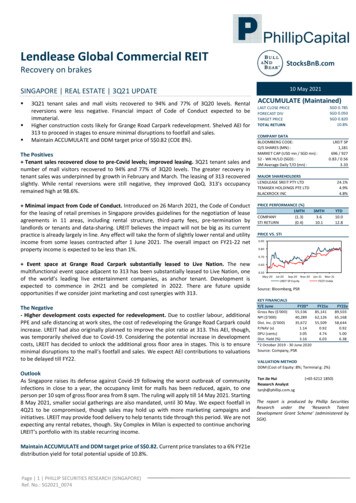
New Vehicle Leasing: Facts, Figures and Future ConsiderationsIntroductionFor decades, vehicle leasing has provided anappealing alternative to car buying, wherebymonthly payments are made over a fixed term inexchange for use of an automobile. The consumer,or lessee, benefits because, in most cases, leasepayments are lower than loan payments, as theamount owed on a lease is largely based on thedifference between the manufacturer’s suggestedretail price (MSRP) and forecasted residual value.The lessor benefits by earning income on the assetover the initial lease term and can realize additionalrevenue when the vehicle is returned and sold asused down the road.But despite its positives, leasing has had asomewhat turbulent history in the United States.After years serving as a niche alternative to anoutright purchase, new vehicle leasing grew rapidlyin the mid-1990s when automakers and lenderspromoted it to accelerate retail deliveries and pushrevenue growth. Eventually, inflated residual valuesand lower used vehicle prices — dictated in part bya surge in off-lease volume — led to monumentallosses for manufacturers, captive financecompanies and banks alike, and the ensuing falloutsharply curtailed lease business in the years thatfollowed.Fast-forward more than a decade, and leasing hasonce again taken off. J.D. Power and Associatesestimates that the total number of new vehiclesleased by consumers reached an all-time high ofnearly 3.5 million units in 2014, and lease volumeis poised to reach a new high again this year.To better understand how the current leaseenvironment compares with the past, this reportprovides a historical review of new vehicle leasing,an examination of current lease trends and anassessment of how the rise in off-lease volumecould impact used vehicle prices in the future.Lease Share of New Retail Deliveries: AR YEARLease Share of New Retail Deliveries: 1992–20001997 199819992000Source: IHS AutomotiveFigure 1866.976.6232 nada.com/b2b 2
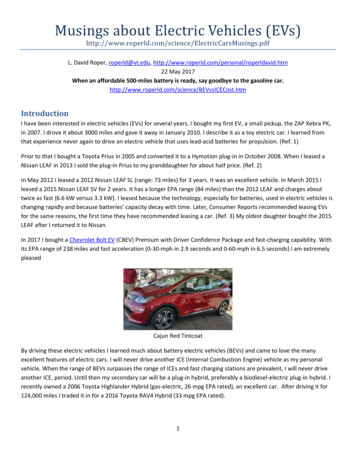
New Vehicle Leasing: Facts, Figures and Future ConsiderationsHistorical Review of Leasinglesser extent, large pickups, as the popularityof larger, more versatile models increased. In1992, the combined lease penetration of the 6aforementioned segments was just 7.1%, whichwas less than the 8.6% average for the industrythat year. However, 5 years later, their collectivepenetration rate jumped to 28%, passing the 27.4%rate for the industry overall.Historically, leasing has been concentrated mostheavily among luxury segments — particularly upuntil the early 1990s, when leasing was utilizedsparingly for non-premium models. But the industrysaw a rise in overall penetration rates throughoutthe 1990s as lease share of new retail deliveriesmore than tripled, rising from an average of 8.6%in 1992 to more than 27% in 1997 (figure 1, page2).1 The volume of originated leases climbed bymore than 67% over the period, rising from 1.96million in 1994 to a then-record of 3.29 million in1997.Looking to capitalize on skyrocketing consumerdemand for utilities and pickups, automakers andfinance companies increasingly turned to leasingas a means of lowering monthly payments on theserelatively expensive vehicles. As a result, roughly40% of new utility deliveries and 20% of largepickups were leased in 1997 (figure 2).Even comparatively inexpensive compact andmidsize passenger cars exhibited growth inleasing during this time, but the most notableshifts occurred among sport utilities and, to aLease Share of New Retail Deliveries: 1994 vs.19971994199743%Midsize Utility25%38%Large Utility9%29%Midsize Car22%25%Midsize Van14%23%Compact Utility5%22%Compact Car14%21%Midsize Pickup9%20%Large Pickup10%0%10%20%Lease Share of New Retail Deliveries: 1994 vs. 199730% 40%50%Source: IHS AutomotiveFigure 21 Lease penetration and volume figures up to 2000 were sourced from IHS Automotive. Figures cited after 2000 were sourced from J.D. Power.866.976.6232 nada.com/b2b 3
New Vehicle Leasing: Facts, Figures and Future ConsiderationsBetween 1994 and 1997, new retail deliveriesimproved by 1.4%. However, the rise was driven bya 58% increase in lease volume, as retail purchasesdeclined by 11% over the period (figure 3).Coinciding with rapidly rising new vehicle incentives,the influx of used supply spearheaded a steepdecline in used vehicle prices. Making mattersworse, lease turn-ins increased between 1998 and1999, as consumers were increasingly unwilling topurchase their off-lease cars for more than marketvalue. Bowing to the pressure, used vehicle pricesfell by an average of 3.4% per year from 2000 to2003. By the end of the period, prices were about13% lower than in 1999 (figure 4, page 5).During that period, automakers and captive financecompanies began to inflate residual values andoffer consumers even lower monthly payments.The logic was that they could incorporate marketingexpenses into the sales prices of lease vehiclesand turn a profit by making money off finance andinsurance products, parts, accessories, serviceand so on. In order to remain competitive, banksresponded by artificially raising residuals instead offollowing values published by industry guidebooks.With value retention well below the residual valuesset when the cars were new, bank and captivefinance companies were left with portfolios fullof used vehicles worth substantially less thanexpected based on forecasted residuals. All told,CNW Marketing Research estimated the overall hitto lenders at 11 billion in 2000 and an additional 13 billion in 2001.The lack of foresight throughout the industry andan affinity for 24-month leases greatly increasedrisk, but it wasn’t until large quantities of off-leasevehicles hit the used market in the late 1990s thatfinance companies began to feel the pain caused byadjusting residual values.New Vehicle Retail Deliveries: 1992–2000PurchaseLeaseNEW VEHICLE RETAIL DELIVERIES (IN 648.309.5610.3620199219992000CALENDAR YEARNew Vehicle Retail Deliveries: 1992–2000 Source: IHS AutomotiveFigure 3866.976.6232 nada.com/b2b 4
New Vehicle Leasing: Facts, Figures and Future ConsiderationsNADA Used Car Guide Used Vehicle Price IndexVehicles up to 8 years in age (1995 100).110Used price decline:-3.4% per year; -13% overall100901999: Volume peak, new 2004CALENDAR YEARNADA Used Car Guide Used Vehicle Price Index Source: NADA Used Car GuideFigure 4While automakers were able to help absorb someof the blow taken by captive finance companies,banks had no such protection. By the early 2000s,numerous banks such as First Union and Wachoviahad either exited the leasing game altogether or hadseriously curtailed the number of leases originated.Even though major captives such as GMAC andFord Credit were able to share risk with otherdivisions within their respective companies, losseswere so significant they began to focus more onfinancing the selling of cars as opposed to leasing.By 2003, lease penetration had fallen to 15%of total new retail deliveries. Leasing recoveredsomewhat in the mid-2000s, reaching nearly 20%of new retail deliveries by 2007, but it took morethan 15 years for leasing to approach the previoushigh set back in the late 1990s.Leasing ResurgenceLeasing has surged over the past few years, duein large part to an exceptional rise in used vehicleprices and retained value that has reduced risk forlenders as well as monthly payments for consumers.A drastically reduced supply of used vehicles —due to stronger demand combined with a recessionbased drop in new sales — helped boost usedvehicle prices by more than 18% from 2007 to2014, placing prices among the highest levelsever reached.Retained value also improved markedly over theperiod. In 2007, averaged retained value for 3-yearold units stood at approximately 45% of equippednew vehicle prices. In 2014, 3-year-old retention hit54.4% — a substantial 9 percentage point increaseacross the previous 7 years (figure 5, page 6).866.976.6232 nada.com/b2b 5
New Vehicle Leasing: Facts, Figures and Future Considerations3-Year-Old Used Vehicle Retained ValueAverage trade-in value divided by MSRP (typically 820092010201120122015*CALENDAR YEAR*Data reported for January–September 2015.3-Year-Old Used Vehicle Retained Value Source: NADA Used Car GuideFigure 5Hypothetically, the improvement in retained valuethat occurred between the two periods would havereduced the amount of principle required to bepaid on a 3-year lease of a 25,000 vehicle by 2,376 — a reduction of 18%.Lease Share of NewDeliveriesAn analysis of J.D. Power Power InformationNetwork (PIN) data reveals that leasing quicklyregained lost ground following the end of theGreat Recession, improving from 13.5% in 2009to an average of 19.1% in 2010.2 Averaging justover 20%, lease penetration was relatively flatfrom 2011 to 2012 before jumping by more than3 percentage points in 2013 to 24% of all retaildeliveries. Lease penetration grew to 25.7% in2014 and has climbed by nearly 2 percentagepoints more so far this year to 27.8%, on paceto top 1997’s all-time high of 27.4% (figure 6,page 7).2In volume terms, J.D. Power estimates the numberof new retail leases originating in 2010 reached1.75 million units; by 2014, retail leases hadrisen to 3.48 million — effectively doubling thelevel reached 4 years earlier and easily surpassing1999’s previous high of nearly 3.3 million. Retaillease volume through September of this year stoodat 2.95 million, up almost 13% over the first 9months of last year. Barring an unexpected pullbackin activity in Q4, the total number of retail leasesoriginated this year should once again set a record.Perhaps no statistic better encapsulates theimportance of leasing to the recovery of the newvehicle market than its contribution to total retailsales growth. It’s estimated that new vehicle retaildeliveries grew by approximately 714,000 unitsfrom 2013 to 2014, while lease volume grew by justover 396,000. This means leasing was responsiblefor a net 55% of retail sales growth over the period.Leasing has assumed an even larger share of newretail sales growth this year, as the additional he J.D. Power Power Information Network (PIN) provides real-time automotive information and decision-support tools based on the collection and analysis of dailyTnew and used vehicle retail transaction data from thousands of automotive franchises.866.976.6232 nada.com/b2b 6
New Vehicle Leasing: Facts, Figures and Future ConsiderationsLease Share of New Retail 5% 19.7%19.1%17.7%14.9% 15.2%25.7%20.2% 009201020112012201320142015*CALENDAR YEARLease Share of New Retail Deliveries*Data reported for January–September 2015. Source: J.D. Power Power Information Network (PIN)Figure 6335,000 units leased through September compose76% of the 440,000-unit rise in total retaildeliveries (table 1).through 2015 CYTD to respective averages of 24%and 52%.Leasing by Market Type,Segment and BrandLeasing within non-premium and premiumsegments has risen by similar amounts over thepast 3 years, as the average lease share within bothgroups increased by 7 percentage points from 2012But while lease growth has been similar within eachgroup, non-premium segments have assumed alarger share of the overall lease total. Non-premiumsegments were responsible for 76% of all leasesoriginated through Q3, up from 75% over all of2014. Conversely, premium segments lost a pointof share, dropping to 24% from 25% last year(figure 7, page 8).Annual Change in New Vehicle Retail SalesCalendar YearTotal Retail GrowthTotal Lease GrowthLease Share of Total Retail *440,090335,51276%Annual Change in New Vehicle Retail Sales Source: J.D. Power Power Information Network (PIN)*Data reported for CYTD 2014 vs. 2015, through September.Table 1866.976.6232 nada.com/b2b 7
New Vehicle Leasing: Facts, Figures and Future ConsiderationsMarket Type Share of Total Retail Leases80%70%Premium Segments76%75%74%72%71%69%Non-premium 20112012201320142015*CALENDAR YEARMarket Type Share of Total Retail Leases Source: J.D. Power Power Information Network (PIN)*Data reported for January–September 2015.Figure 7Non-premium lease penetration is led by midsizecars, where nearly a third of all retail deliverieshave come via lease. Ranging from 25% to 28%,compact car, compact SUV, midsize SUV andsmall SUV lease penetration is a bit lower; however,growth for the group has exceeded that of midsizecars. For example, 28% of compact SUVs havebeen leased CYTD, up a marked 10 percentagepoints from 2012 (figure 8, page 9).As for premium segments, more than 60% of small,compact and midsize premium car retail deliverieswere the result of a lease through September, whilenearly 50% of small SUV purchases were leased(figure 9, page 9).As far as brands are concerned, while leasepenetration is up for virtually every nameplatesince 2012, growth has been more pronouncedacross non-premium brands. Lease share for 9out of the 20 non-premium nameplates grew by10 percentage points or more from 2012 to 2015CYTD, while 4 of 12 premium nameplates grewlease penetration by similar amounts. Penetrationgrowth for remaining brands, mainstream orotherwise, grew by fewer than 10 points over theperiod. It’s worth noting that only 6 non-premiumnameplates had a lease penetration figure above20% in 2012; this year, 16 brands — or 80% —hold this distinction.From a volume standpoint, 75% of non-premiumretail leases came from the compact SUV, midsizecar, compact car and midsize SUV segmentsthrough Q3. Premium lease volume was dominatedby the compact premium car segment’s 35% share,which is 14 percentage points higher than the nextclosest segment: midsize premium SUV.866.976.6232 nada.com/b2b 8
New Vehicle Leasing: Facts, Figures and Future ConsiderationsLease Share of Retail Deliveries: Non-premium mallCarCALENDAR YEARLease Share of Retail Deliveries: Non-premium Segments Source: J.D. Power Power Information Network (PIN)*Data reported for January–September 2015.Figure 8Lease Share of Retail Deliveries: Premium um CarSmallPremium CarMidsizePremium CarLargePremium CarSmallPremium SUVMidsizePremium SUVCompactPremium SUVLargePremium SUVCALENDAR YEARLease Share of Retail Deliveries: Premium Segments Source: J.D. Power Power Information Network (PIN)*Data reported for January–September 2015.Figure 9866.976.6232 nada.com/b2b 9
New Vehicle Leasing: Facts, Figures and Future ConsiderationsLease Pricing8% to 9% of retail purchases. However, by aligninglease and purchases of the same model (e.g., 2015Jeep Grand Cherokee), we see that lease prices tendto be somewhat lower than purchase prices (figure12, page 11). When measured in this manner,a review of nearly 240 heavily leased vehicles fromthe 2015 model year reveals that lease prices werelower than purchase prices 65% of the time, withan average discount of 474.Similar to volume, new lease prices have also grownover the years. Excluding cash rebates, consumerspaid an average of 34,316 on leased vehicles sofar this year, up 4% (or nearly 1,500) from 2012’sfull-year average of 32,843 (figure 10).3 Whenviewed across segments, we see that price growthhas been nonexistent for compact cars, and muchmore significant for large pickups and SUVs(figure 11, page 11).One of the benefits of leasing instead of purchasingis lower monthly payments. CYTD, monthly leasepayments are, on average, 77 less than purchasepayments. In some of the most heavily leasedsegments, the difference in monthly paymentexceeds 100.While lease prices are up, they haven’t grown quiteas much as purchase prices, which are currently8% higher than in 2012 (from 30,402 to 32,849 CYTD).In aggregate, new lease prices are higher thanpurchase prices for the simple fact that luxurymodels compose a quarter of all leases and a lesserAverage New Retail Lease PricesPrices do not include customer cash rebates. 36,000 34,000 32,843 34,316 33,831 33,377 32,000 30,000 28,000 26,000 24,000 22,000 20,00020122013Average New Retail Lease Prices*Data reported for January–October 2015.2014 2015*CALENDAR YEARSource: J.D. Power Power Information Network (PIN)Figure 103 ehicle prices referenced are the price the customer pays for the vehicle and for factory- and dealer-installed accessories and options contracted at the time of saleVand adjusted by the trade-in allowance, but not adjusted for the customer cash rebate amount, if any. This price is not the MSRP.866.976.6232 nada.com/b2b 10
New Vehicle Leasing: Facts, Figures and Future ConsiderationsChange in New Retail Lease Prices: 2012 vs. iumCarMidsizeSUVLargePickupLargeSUVCALENDAR YEARChange in New Retail Lease Prices: 2012 vs. 2015*Data reported for January–October 2015. Source: J.D. Power Power Information Network (PIN)Figure 11New Vehicle Retail Price Comparison: Lease vs. PurchaseRETAIL PRICE DIFFERENCE (LEASE MINUS PURCHASE PRICE)The difference between new consumer lease and purchase prices in CY2015 for model year 2015 vehicles.Prices do not include customer cash rebates. 6,000 4,000Lease price above purchase price 2,000 0- 2,000Lease price below purchase price- 4,000- 6,000050100150200250MODEL COUNTNew Vehicle Retail Price Comparison: Lease vs. Purchase Source: J.D. Power Power Information Network (PIN)Figure 12866.976.6232 nada.com/b2b 11
New Vehicle Leasing: Facts, Figures and Future ConsiderationsWhile lease prices have grown moderately over thepast few years, monthly payments have changedlittle. At a market level, monthly lease paymentsare averaging 6 less so far this year than in2012. Changing mix has something to do withthis; however, results are generally similar whenpayments are viewed across segments (the largeSUV segment being an exception) (figure 13).The more likely cause of flat lease payments ishigher incentives. Total lease subvention rose by7% in 2014 to an average of 5,773 per unit,and has increased by an additional 9% to anaverage of 6,281 CYTD. While incentives havelargely been centered on residual and interest ratesubvention — residual and APR subvention standat 2,787 and 2,399 CYTD, up 9% and 4%,respectively versus 2014 — cash discounts haveprogressively taken on a more prominent role.Lease cash offers have jumped by 39% so far thisyear to an average of 1,874 per unit (up 521)(figure 14, page 13).So why have lease payments stayed flat, eventhough prices have grown? The retained valueimprovements discussed earlier help controlmonthly payments; however, their influence onpayments should have gradually waned over thepast few years. This is because vehicles leasedfrom 2013 to 2015 are due to hit the market inlarge quantities in 2016 and beyond, when many,including NADA Used Car Guide, project a declinein retained value.The increase in lease cash incentives is probablypartially responsible for the rise in lease downpayments observed this year. After remainingflat the previous 3 years, the amount of moneyconsumers are putting down on new leases hasgrown from 2,979 in 2014 to 3,220 CYTD(up 8%).4Average Monthly Retail Lease Payments2012201320142015* 900 800 700 600 500 400 300 200 100 remiumSUVLargeSUVAllNameplatesCALENDAR YEARAverage Monthly Retail Lease Payments Source: J.D. Power Power Information Network (PIN)*Data reported for January–October 2015.Figure 134 otal down is the total amount of cash and equity applied as a down payment on the vehicle. For lease transactions, total down is the total initial paymentT(also known as “drive-off") that the customer must make at the time of vehicle delivery. Total down includes cash down payment, trade-in equity andcustomer cash rebates.866.976.6232 nada.com/b2b 12
New Vehicle Leasing: Facts, Figures and Future ConsiderationsLeasing’s Effect on theUsed MarketThe considerable rise in new vehicle leasing willhave a material effect on used vehicle supply andthus used vehicle prices. In turn, the degree towhich used prices and retained value change willplay an important role in dictating new lease activitymoving forward.INCENTIVE-TYPE SUBVENTIONNew Vehicle Lease IncentivesCompared to 2014, J.D. Power estimates that leasematurities will grow by 4% this year — or nearly95,000 units — to 2.3 million. But 2015’s off-leaseestimate pales in comparison to 2016’s, whenmaturities are expected to rise by almost 800,000units (up 33%). Off-lease volume is scheduled togrow by an additional 285,000 units in 2017 to 3.4million (figure 16, page 14). Given the number ofnew leases originated so far this year, total off-leasevolume will rise substantially yet again in 2018.Mirroring new lease trends, off-lease volume will begreatest across non-luxury compact car, midsizecar, compact SUV and midsize SUV segmentsover the next two years (figure 17, page 15). Ingrowth terms, it’s estimated there will be 116%more compact SUV lease maturities hitting themarket in 2017 than this year. Midsize SUV andcompact off-lease supplies are scheduled to grow by57% and 44%, respectively, and midsize car supplyby 23%. The number of non-premium vehicleshitting the market is expected to rise by 58% overthe period, while premium volume should be up amuch smaller 16%.Total Lease SubventionCashResidual SubventionAPR Subvention 3,500 7,000 3,000 6,000 2,500 5,000 2,000 4,000 1,500 3,000 1,000 2,000 500 1,000 0201020112012New Vehicle Lease IncentivesData reported for January–September, each calendar year. 20132014 02015CALENDAR YEARSource: J.D. Power Power Information Network (PIN)Figure 14866.976.6232 nada.com/b2b 13TOTAL SUPPORTED LEASE SUBVENTIONLease terms and interest rates have also playeda part in managing lease payments, but arguablya smaller one compared to incentives. Most retailleases CYTD, 80%, fall within a 36- to 41.9-monthterm, which is somewhat higher than the 74.5%share recorded in 2012 (figure 15, page 14).As for interest rates, Experian Automotive datashows that auto loan rates on new vehicles rosemodestly over the first half of the year, increasingfrom an average of 4.56% in Q4 2014 to 4.81% inQ2 2015. Interest rates for prime and super-primeborrowers hardly changed, while rates for nonprimeborrowers and below increased from 24 to 122basis points.
New Vehicle Leasing: Facts, Figures and Future ConsiderationsRetail Lease Term Distribution2012Term share of total % ��35.936–41.97.4%7.1%1.8%42–47.948 LEASE TERM (IN MONTHS)*Data reported for January–October 2015.Retail Lease Term Distribution Source: J.D. Power Power Information Network (PIN)Figure 15PROJECTED INDUSTRY LEASE MATURITIES (IN MILLIONS)Estimated Lease Maturities4.0 201020112012Estimated Lease Maturities2013 2014201520162017CALENDAR YEARSource: J.D. Power Power Information Network (PIN)Figure 16866.976.6232 nada.com/b2b 14
New Vehicle Leasing: Facts, Figures and Future ConsiderationsConclusionThe expanding pool of used vehicle supply,spearheaded by off-lease growth, will graduallycompress used vehicle prices as time passes.The supply effect on used prices will be mostpronounced on subcompact cars, compact cars,compact utilities and midsize utilities — bothnon-luxury and luxury. Utility and truck prices willbe cushioned somewhat from supply’s blow by lowgas prices and stronger consumer demand, whilecar segments will enjoy no such buffer.Arguably, leasing is more appropriate today thanever before. Leasing is not only a viable alternativefor consumers who prefer a shorter ownership cycle,but it also helps keep new vehicle sales on a morepredictable cadence at a time when purchasersare holding onto their vehicles longer because ofextended loan terms and better dependability.Unlike in the 1990s and early 2000s, off-leasevehicles have a variety of remarketing conduits topass through, which helps preserve value as supplymakes its way from the grounding dealer, to anonline sales platform, and ultimately a physicalauction. Furthermore, off-lease supply helps feedgrowing franchised dealer demand for used vehiclesin general, and consumer demand for manufacturerbacked Certified Pre-Owned vehicles.Should used vehicle prices fall by an average of2.5% per year over the next three years — which isa conservative estimate given the expected rise insupply — prices would end 2018 7.3% below 2015levels. Under this assumption, prices would be attheir lowest point since 2010.Estimated Lease Maturities, by Segment201520162017PROJECTED INDUSTRY LEASE 000Compact Midsize Compact Midsize Compact Midsize Large MidsizeCarCarSUVSUV Premium Premium Pickup remiumSUVSmallCarSmallLargeLargePremium Premium PremiumCarCarSUVLargeSUVMidsize SmallPickup PremiumSUVEstimated Lease Maturities, by Segment Source: J.D. Power Power Information Network (PIN)Figure 17866.976.6232 nada.com/b2b 15
New Vehicle Leasing: Facts, Figures and Future ConsiderationsDespite these positives, however, leasing still hasrisks.The outlook for lower used prices meansthat retained value will also move lower and,by extension, so too should residual values.Complicating matters, an accelerated rate ofdepreciation, combined with loan terms that haveincreased from an average of 63 months in 2010to more than 67 months CYTD, will increase thetime it takes for consumers to accrue positiveequity. This will affect a consumer’s ability to meetdown payment requirements on both new vehicleloans and leases. A gradual increase in negativeequity is already evident in J.D. Power PIN data.The percentage of new vehicle transactions with atrade-in where the trade payoff exceeds the trade-inactual cash value has grown to 29% CYTD from27% in 2014 (negative equity share stood at 24%in 2012).Considering these points, important decisions mustbe made regarding lease penetration, subventionand residual value planning moving forward. Thechoices ultimately made will play a critical role indetermining if leasing will continue to grow whileremaining a profitable business endeavor.866.976.6232 nada.com/b2b 16
About NADA Used Car GuideNADA Used Car GuideSince 1933, NADA Used Car Guide has earned its reputation as the leading provider ofvehicle valuation products, services and information to businesses throughout the UnitedStates. Its team collects and analyzes over 1 million combined automotive and truckwholesale and retail transactions per month, and delivers a range of guidebooks, auctiondata, analysis and data solutions. NADA Used Car Guide, a division of J.D. Power, providesa seamless view of timely, reliable new and used vehicle price information that helpsautomotive / truck, finance, insurance and government professionals make better businessdecisions. Visit nada.com/b2b to learn more.NADA Used Car Guide's Lender AdvantageGetting ahead is going to get harder, but Lender Advantage is here to help. Our team ofexperts provides a full suite of vehicle analysis services that put you in the fast lane so youcan keep up with marketplace changes. From vehicle risk assessments to portfolio analysis,remarketing planning and stress testing, we’ll give you the data and insight you need to makethe best business decisions. Depend on Lender Advantage for better outcomes. Visitnada.com/advantage to see how we can help your business.For more information on this white paper or about Lender Advantage, contact:JONATHAN BANKSLARRY n@nada.com703.749.4713VP, Vehicle Analysis& AnalyticsSenior Manager,Market IntelligenceSTEVE STAFFORDAccount Executive,Financial Industry, Accounting,Legal, OEM Captivesteve.stafford@nada.com703.821.7275
Additional ResourcesUsed Car & Truck BlogNADA GuidelinesUpdated monthly with a robust data setfrom various industry sources and NADAUsed Car Guide’s own proprietary analyticaltool, NADA Guidelines provides the insightneeded to make decisions in today’s market.Sign up to receive NADA Guidelines monthlyat nada.com/guidelinesKeep up with industry activity, get insightinto what lies ahead in the marketplaceand discover what’s influencing theused vehicle valuation market withNADA Used Car Guide’s comprehensivemarket overviews and data-focused blogs.Join the conversation at nada.com/usedcarNADA PerspectiveCommercial Truck BlogLeveraging data from various industrysources and NADA Used Car Guide’sanalysts, NADA Perspective takes a deepdive into a range of indust
Q4 2015 New Vehicle Leasing: Facts, Figures and Future Considerations AT A GLANCE A history o