Transcription
Available online at www.sciencedirect.comLWT - Food Science and Technology 41 (2008) 2036e2043www.elsevier.com/locate/lwtEffect of milk homogenisation and foaming temperature on propertiesand microstructure of foams from pasteurised whole milkK. Borcherding1, W. Hoffmann*, P.Chr. Lorenzen, K. SchraderMax Rubner-Institut, Department of Safety and Quality of Milk and Fish Products, Hermann-Weigmann-Strasse 1, D-24103 Kiel, GermanyReceived 25 June 2007; received in revised form 12 November 2007; accepted 20 November 2007Dedicated to Wolfgang Buchheim on the occasion of his 70th birthday.AbstractDifferently homogenised and HTST-heated milk (3.5% fat) was foamed at temperatures between 4 and 60 C. Foaming was achieved by airinjection through fritted glass. Initial foam density, drainage and corresponding bubble size were analysed. Transmission electron microscopic(TEM) images completed the study. The studies showed that whole milk was better foamable between 50 and 60 C than at lower temperatures.This was mainly due to the completely liquid milk fat and the increased protein adsorption at the aireserum interface. The resulting bubbles ofthese two foams maintained their spherical shape also for 20 min of draining. However, the average bubble diameter and the drainage mass inrelation to the initial foam mass increased from about 20 g/100 g after 1 min to about 80 g/100 g after 20 min. It was surprising to learn that milkhomogenisation and corresponding fat globule size had only marginal effect on foam formation and stability. TEM images suggested that theaireserum interface consisted mainly of protein monomers and oligomers, while casein micelles were not directly adsorbed. The membrane ofthe homogenised fat globules was destroyed near the interface and coalesced liquid fat formed a restricted film on the bubble that was obviouslyof minor importance for the foam properties.Ó 2007 Swiss Society of Food Science and Technology. Published by Elsevier Ltd. All rights reserved.Keywords: Whole milk; Homogenisation; Foaming temperature; Bubble size; Foam microstructure1. IntroductionA diverse range of foods are aerated using a similarlyvaried assortment of processing methods. However, not all isknown about aerated systems which consist of many differenttypes of molecules (Campbell & Mougeot, 1999; Dickinson,1992; Leser & Michel, 1999). This is also valid for the variedapplications of milk foams which became more and more utilized, in particular as topping on popular coffee beveragessuch as cappuccino. The foaming properties of milk havebeen studied since the beginning of the last century, but the* Corresponding author. Tel.: þ49 431 609 2272; fax: þ49 431 609 2309.E-mail address: wolfgang.hoffmann@mri.bund.de (W. Hoffmann).1Present address: G. C. Hahn & Co., Roggenhorster Strasse 31, D-23556Lübeck, Germany.aim of this early work was to decrease foam formation duringmilk processing (Rahn, 1922; Siedel & Hesse, 1900). Although this problem still exists, most of the papers publishedduring the last three decades have dealt with foams of isolatedmilk proteins (Clarkson, Cui, & Darton, 1999a, 1999b;Damodaran, 2005; Damodaran & Paraf, 1997; Dickinson,2003; Graham & Phillips, 1976; German & Phillips, 1994;Halling, 1981; Kinsella & Phillips, 1989; Walstra & deRoos, 1993), and with fat-stabilized whipping cream (Besner& Kessler, 1998; Brooker, 1990; Brooker, Anderson, &Andrews, 1986; Buchheim, 1991; Smith, Goff, & Kakuda,2000; Stanley, Goff, & Smith, 1996), or ice cream (Berger,1997; Buchheim, 1998; Goff, 1997, 2003).Only a few authors have studied the complex interactions ofthe different milk proteins and the resulting properties of milkfoams. Ward, Goddard, Augustin, and McKinnon (1997)0023-6438/ 34.00 Ó 2007 Swiss Society of Food Science and Technology. Published by Elsevier Ltd. All rights reserved.doi:10.1016/j.lwt.2007.11.020
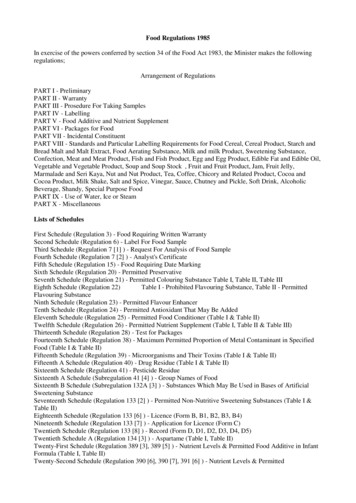
K. Borcherding et al. / LWT - Food Science and Technology 41 (2008) 2036e2043reported that the addition of Ca chelating agents to milk increased foam volume but had no clear effect on foam stability.Addition of Ca to skim milk depressed foam formation. Obviously, the increase in serum protein (non-micellar protein) onaddition of EDTA to milk contributed to improved foamingproperties by increasing the availability of the proteins forformation of the primary aireserum interface.The first electron microscopic images of the bubble surfacein milk led to the assumption that it consists of a twodimensional network of casein micelles (Mulder & Walstra,1974). Brooker (1985) showed that the attachment of caseinmicelles to the interfacial layer was reversible. b-Lactoglobulin,a-lactalbumin and b-casein seem to be the main constituents ofthe interface (Brooker, Anderson, & Andrews, 1986). Thestability of these protein-stabilized foams may be influencedby adsorption of other milk constituents, in particular emulsified milk fat (Brooker, 1993).Foaming of fat-containing milk was mainly carried out attemperatures where both crystallised and liquid fractionswere present within the fat globules that favoured partial coalescence by mechanical input. Anderson and Brooker (1988)found that in the range of 5e15 C the ease of foam formation(foaming rate) decreased as fat content (0e1.5%) and temperature increased. However, changing the temperature from 5 to15 C had little effect on the collapse rate in spite of the largechange in liquid fat content. Prins (1986) claimed that spreading of liquid fat at the interface and local thinning of the proteinfilm followed adsorption resulting in less stable lamellae andcollapsing bubbles. The effect of a foaming temperature above20 or 37 C, where the milk fat is predominantly or completelymolten, has been analysed rarely until now. That is also validfor the effect of milk homogenisation. Hoffmann, Wieczorek,and Borcherding (2002) foamed differently processed samplesof the same batch of raw milk with customary devices at 50 and70 C. They showed that homogenised milk fat (max. 3.5%)reduced the attainable foam volume, but had no negative effecton the foam stability. Unfortunately, the various publishedfoaming results are hardly comparable because differentfoaming devices and conditions were used in each instance.The objective of the present work was to investigate theeffect of milk homogenisation and foaming temperature onproperties and microstructure of foams prepared from pasteurised whole milk. The studies on hand focused mainly on theinfluence of fat globules on whole milk foams. The foamingproperties of the milk proteins were not considered in detail.Foaming was achieved by air injection through fritted glasswithout additional mechanical treatment.2. Materials and methods2.1. Preparation of whole milk samplesRaw milk was obtained from the experimental farm of theFederal Research Centre for Nutrition and Food, Kiel. Afterskimming in a separator (Westfalia, Oelde, Germany) at45 C, the milk was adjusted to 3.5% fat by mixing skimmilk and cream. This whole milk was homogenised at 50 C2037using different pressure conditions (unless otherwise stated200/50 bar in a two-stage device of APV, Unna, Germany)and subsequently pasteurised (high-temperature short-time(HTST-) heated at 73 C for 20 s using a plate heat exchangerof APV, Unna, Germany). All batches were filled into autoclaved glass bottles (1 l) with screw caps and stored at 5 C.2.2. Characterisation of milk samples2.2.1. Apparent viscosity and surface tensionApparent viscosity of the milk samples was determined at50 C using a rheometer (UDS 200, Physica Messtechnik,Stuttgart, Germany), equipped with a cone and plate geometry.After a pre-shear (20 s) and an equilibration time (60 s), a flowcurve with increasing and decreasing shear rate (50 to1000 s 1, 20 measurement points, each for 5 s) was recorded.The viscosity was calculated on the basis of the data points inthe linear area (800e1000 s 1) and determined in duplicate.Double surface tension measurements were performed at4e20 C after an equilibration period of 20 min using the Pendant Drop Method (Drop Shape Analysis System 10 Mk2, andsoftware DSA 1, Krüss, Hamburg, Germany). The surfacetension (s) between 30 and 60 C could only be calculatedaccording to a formula of Houška et al. (1994):s ¼ 4:74 10 2 9:02 10 5 t 3:79 10 7 t2The formula is based on empirical data (0e80 C) from fourdifferent experimental studies. It considers thermal changes suchas denaturation of whey proteins. The calculated surface tensiondata above 20 C were used as a qualitative impression only.2.2.2. Measurement of the particle size distributionThe particle size distribution in whole milk was analysed bya laser diffraction spectrophotometer (Coulter LS 230, Beckman Coulter, Krefeld, Germany). The fat globule diameterwas calculated with the refraction indices of Hinrichs (1994).2.3. Foaming apparatusThe foaming apparatus (Fig. 1) was a further developmentof the equipment described by Fains, Bertrand, Baniel, andPopineau (1997), Ralet and Gueguen (2001), Waniska andKinsella (1979), and Yu and Damodaran (1991). It consistedof a double-walled glass body that allowed control to a chosentemperature. The milk was foamed by constant injection ofcompressed air (4 l/h) through a porous glass frit (pore diameter 9e15 mm) at the bottom of the glass body. The foamdeveloped in a volumetric glass flask positioned above. Afterfoam formation of 200 cm3, the foam-filled flask was closedwith a stopper, removed from the double-walled glass bodyand taken to a funnel with a glass membrane (pore diameter90e150 mm) for determination of characteristic foam properties. Each foaming experiment was carried out in triplicate.
2038K. Borcherding et al. / LWT - Food Science and Technology 41 (2008) 2036e2043200 mlvolumetricflaskvolumetric flask200 mlfoamCCD cameralightsourcefoamfunnelfoamfritted glass filterdrainagesamplefritted glassfilterwaterErlenmeyer flaskcompressed airscaleFig. 1. Configuration and operating mode of the foaming apparatus.2.4. Characterisation of milk foam properties2.4.1. Foam density and drainageThe foam density was determined immediately (t ¼ 0 min)after formation of 200 cm3 foam by weighing the filled (andempty) flask and was calculated according to the formula: densityfoam g cm3 ¼massfoam ½g volumefoam ½cm3 Determinations were performed in triplicate. The coefficient of variation in the studies on hand was less than 5%.For drainage measurements, the foam-filled (200 cm3) glassflask was carefully put on a funnel with a glass membrane thatwas located above another flask on a pair of scales. Theamount of drainage having dropped into this flask wasrecorded and related to the initial foam mass (g/100 g). Determinations were performed in triplicate.2.4.2. Image analysis of foam bubble size distributionImage analysis enabled a detailed view of the foam structure and an analysis of the time-dependent bubble size distribution. All pictures were captured with a digital microscopecamera (DMC 1, Polaroid Corp., Cambridge, MA, USA) including a macro zoom lens (10 , f ¼ 20e200 mm, F 5.6,EHD Imaging, Damme, Germany). Images were digitisedwith the software Image-Pro Plus Version 4.1 (Media Cybernetics, Silver Spring, MD, USA). The photos of the foam bubbles were taken after 1 and 20 min. The segmentation of theimage occurred with the threshold function, and a watershedtransformation enabled the separation of touched bubbles.Only complete bubbles were analysed. The diameter (d ) wascalculated from at least 200 bubbles of each foam sample.For evaluating the bubble size distribution, the data weredivided into classes from 0.0 to 1.0 mm (class order(x) ¼ 0.1 mm) and the percentages as well as their standarddeviation within the classes were calculated on the basis oftriplicate experiments.2.4.3. Electron microscopyA transmission electron microscope (TEM, Tecnai 10, FEICompany, Eindhoven, Netherlands) was used for the analysisof the internal structures of milk foams. Jet-freezing (Cryo-jetJFD 30, Bal-Tec, Liechtenstein) was chosen for the preparation of the foams. About 1 ml of foam was placed on a grid(gold, 7 mm thick, 400 mesh, Bal-Tec No. LZ 01859 KN)placed between two specimen carriers (copper, Bal-Tec No.LZ 02131 VN and LZ 02132 VN). One of them had a smallcavity to prevent destruction of the foam. This sandwich wasimmediately frozen in the apparatus by a jet of liquid propane.The frozen samples were stored in liquid nitrogen. In the nextstep, the samples were fractured using the device for cryo-jetsandwiches and replicated in a Balzers BA 360M (Balzers,Liechtenstein). The replica were examined in the TEM at80 kV (Schrader, Buchheim, & Morr, 1997).3. Results and discussion3.1. Influence of the foaming temperatures (4e60 C)Formation and stability of the whole milk foams dependedstrongly on the foaming temperature. Foams prepared ata milk temperature between 4 and 30 C were largely unstable; their air bubbles collapsed within a few minutes. Foamingat 20 C led to a completely inadequate formation of bubblesand no foam analysis was feasible. Surprisingly, the foam prepared at 10 C had the highest initial density of about 0.19g/cm3 (Table 1). The density of the foams produced at 40e60 Cwas slightly smaller (0.17e0.18 g/cm3). Digital images(Fig. 2) showed that the foam made at 30 C consisted of large
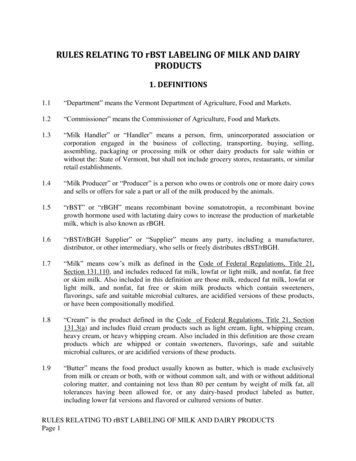
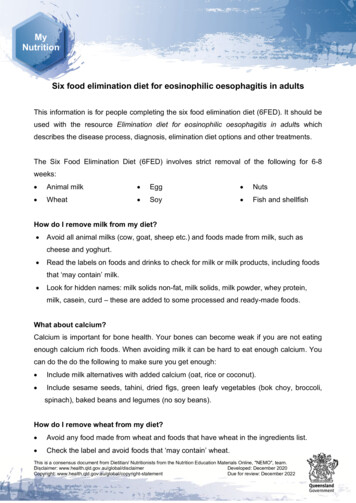
K. Borcherding et al. / LWT - Food Science and Technology 41 (2008) 2036e20432039Table 1Effect of foaming temperature on selected properties of liquid and foamed homogenised and HTST-heated whole milkFoamingtemperature( C)Apparentviscositya(mPa 676.646.576.526.466.40Surfacetensionb(mN/m)Foam density(g/cm3)47.046.545.444.443.241.940.60.130 0.0130.188 0.002no foam0.149 0.0020.172 0.0060.170 0.0010.177 0.002Number average diameter of foambubbles d10 (mm)Drainage/initial foam(g/100 g)After 1 minAfter 20 minAfter 1 minAfter 20 minn.d.n.d.no foamn.d.0.233 0.0060.183 0.0010.135 0.011n.d.n.d.no foamn.d.n.d.0.300 0.0200.258 0.01153 1134 5no foam48 211 121 124 195 192 6no foam96 283 177 180 1n.d., not detected: quantity of foam bubbles was to low for statistical evaluation (see Fig. 2).aMeasurements were carried out in duplicate. Reproducible determination of milk viscosity was not feasible at 60 C.bAbove 20 C, the window of the measuring chamber misted up. Therefore, the surface tension between 30e60 C was calculated according to a formula ofHouška et al. (1994).angular bubbles after 1 min drainage. These bubbles had a diameter of 1e3 mm and the corresponding lamellae of about0.16 mm. A rise in temperature from 40 up to 60 C resultedin a smaller average diameter and a narrower bubble size distribution of the spherical bubbles. The d10 value decreasedfrom 0.23 to 0.14 mm (Table 1). Foams made at 50 or 60 Ccontained more than 50% air bubbles with a diameter between0.1 and 0.2 mm (Fig. 3). Drainage of these two foams increased from about 20 g/100 g after 1 min to about 80g/100 g after 20 min (Table 1). This corresponded with a distinctly larger average bubble diameter greater than 0.25 mm.Foaming at 40 C resulted in a drainage of more than 80g/100 g after 20 min. This foam had a strongly altered appearance and finally consisted of large polyangular bubbles (diameter 1e5 mm) and smaller bubbles within the lamellae(Fig. 2).The homogenised and HTST-heated whole milk samplescontained small fat globules coated by milk proteins whichadjusted their hydrophilic groups to the milk serum. At20 C, fat globules consisted of about 20% of crystallisedand about 80% liquid fat which was obviously detrimentalto the foam formation. Above 37 C, milk fat existed solelyin a liquid state and the fat globules were more resistantagainst mechanical treatment.Fig. 2. Digital images of foams from homogenised and HTST-heated whole milk in relation to the foaming temperature after 1 min (left) and 20 min (right) ofdrainage; 30 C/20 min: no foam; 60 C/1 min: no image.
K. Borcherding et al. / LWT - Food Science and Technology 41 (2008) 2036e2043Percentage of foam bubbles per class20401988; quoted from Jelen & Rattray, 1995). The small decreasein pH value as a result of increased foaming temperatures wasaccompanied with a slightly lower protein net charge andtherefore a lower electrostatic repulsion. This resulted ina denser structure of the proteins at the airewater interface(Damodaran, 2005). However, during aging of the foam thecontinuous drainage led to film thinning, rupture of the lamellaand coalescence of bubbles.7060504030203.2. Influence of whole milk homogenisation10000.10.20.30.40.50.6Foam bubble diameter (mm)0.70.88 00107JFig. 3. Bubble size distribution of foams prepared from homogenised andHTST-heated whole milk with dependence on the foaming temperature after1 min of drainage. Bubble diameter x means class from x 0.05 mm tox þ 0.05 mm. Results listed are mean values and standard deviations of threeanalyses;40 C;50 C;60 C.One key question is whether the large influence of temperature on foam properties of whole milk is related mainly to theskim milk phase. To approach an answer, it might be helpful toconsider the results of Borcherding, Lorenzen, Hoffmann, andSchrader (in press). They used HTST-heated skim milk andidentical foaming conditions. The resulting foams preparedbetween 4 and 20 C were also unstable and collapsed withina few minutes. Foams prepared between 30 and 60 C werestable up to 20 min. The highest initial foam density (0.22 g/cm3) and the smallest foam bubble diameter after 20 min ofstorage (d10 ¼ 0.27 mm) resulted at 60 C. Corresponding towhole milk, the foam prepared at 10 C had a higher density(0.19 g/cm3) than the remaining foams. Also, drainage of thefoams prepared at 50 and 60 C increased from about 20 g/100 g after 1 min to about 80 g/100 g after 20 min. In summary, the properties of foams prepared from skim milk andwhole milk seem to be similar. This indicates that the fatglobules in homogenised whole milk were obviously of minorimportance for the foaming properties of the product, but maydeteriorate them at certain unfavourable foaming temperatures(20 and 30 C). Therefore, the skim milk phase containing themilk protein fractions seemed to be mainly responsible for thefoaming properties. As mentioned above, the main objectiveof this study was not to identify the most relevant proteinfractions for foaming.At 40e60 C, the milk proteins showed an accelerateddiffusion and adsorption velocity favouring the formation ofsmaller foam bubbles (Damodaran & Paraf, 1997; Dickinson,2003). This process was supported by decreasing apparentviscosity and surface tension values of milk samples withincreasing foaming temperatures (Table 1). In addition, highertemperatures led to an increased number of hydrophobic interactions (Erdem, 2006; Jelen & Rattray, 1995). This was due toexposure of hydrophobic groups, which were originallyinaccessible inside the globular structures of whey proteinsat temperatures below 40 C (Dupont, 1965; Kella & Kinsella,Whole milk was pumped through the double-stage homogenisation device and subsequently HTST-heated. The resultingaverage volume-moment (d43) and volume-surface diameters(d32) are presented in Table 2. The variable d32 was necessaryfor the calculation of the specific fat globule surface (Sv ¼6/d32). On condition that the protein load is approximately10 mg/m2 fat globule surface (Walstra, van Vliet, & Kloek,1995), about 27% of the protein in the whole milk (3.45g/100 g) was adsorbed at the interface of the air bubbles aftera homogenisation with 250/50 bar was performed. A singlestage homogenisation with 50 bar (no additional pressure inthe second stage) demanded for only half of this protein quantity. The milk samples were foamed at 50 C. Surprisingly, thedensity of the foams (0.15e0.20 g/cm3) showed no cleartendency in relation to the homogenisation pressure applied.The same was valid for the results of drainage after either 1or 20 min. Fig. 4 represents the corresponding distribution ofthe air bubble sizes of foams of non- and strongly (250/50bar) homogenised whole milk. After 1 min, most bubbleshad a diameter between 0.1 and 0.2 mm. Less than 5% hada diameter above 0.4 mm. After 20 min, most of the air bubbles had a diameter between 0.2 and 0.4 mm, but about 45%of the bubble sizes were above 0.4 mm. All in all, the effectof varying fat globule sizes in whole milk on foam formationand stability of foams prepared at 50 C was marginal. Apparently, there was sufficient milk protein available to ensure fastand comparatively stable adsorption at the aireserum interface. As far as we know, comparable studies have not beenTable 2Effect of homogenisation on particle size and calculated characteristics ofHTST-heated whole milkHomogenisationpressure (bar)e50100/50a200/50a250/50aaAverage particlediameterbd43 (mm)d32 atedspecific fatglobule surfaceSvc (m2/kg)Estimatedproportionof adsorbedprotein/totalproteind (g/100 g)844506308909402.413182627Double-stage homogenisation: Total pressure/pressure in the second stage.Measurements were carried out in duplicate.cSv ¼ surface of dispersed phase/volume of dispersed phase ¼ 6/d32;rFett ¼ 0.93 g/cm3.dCalculation according to Walstra, van Vliet, and Kloek (1995): z10 mg/m2fat globule surface; milk protein content: 3.45 g/100 g.b
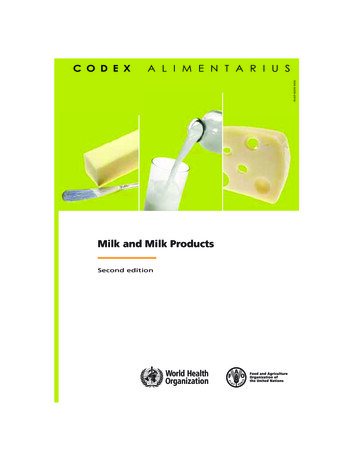
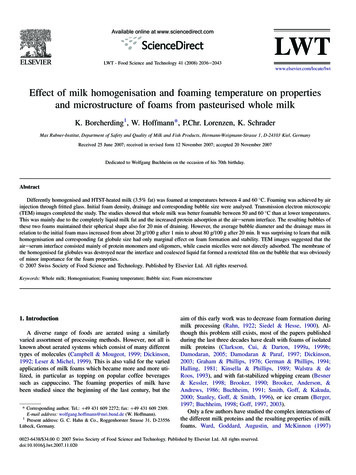
Percentage of foam bubbles per classK. Borcherding et al. / LWT - Food Science and Technology 41 (2008) oam bubble diameter (mm)0.911.18 00207JFig. 4. Bubble size distribution of foams prepared from homogenised (250/50bar) and non-homogenised HTST-heated whole milk after 1 and 20 min ofdrainage. Bubble diameter x means class from x 0.05 mm to x þ 0.05 mm.Results listed are mean values of three analyses and standard deviations;0 bar/1 min;250/50 bar/1 min;0 bar/20 min;250/50 bar/20 min.published. Finally, the influence of milk fat globules on themicrostructure of the milk foams was studied in more detail.3.3. Microstructure at aireserum interfaceThe particle size distribution of the homogenised (200/50bar) and HTST-heated whole milk before foaming at 50 Cas well as the distribution of the drained liquid after foamingwas measured by laser diffraction. Virtually no differencecould be detected between the results of the processed milkand the collected drainage up to 20 min after foaming. Onthe other hand, the not-drained remaining lamellar liquid ofthe foam showed continuously growing aggregates with a diameter up to 100 mm (Fig. 5). Additional fluorescence microscopy proved that numerous fat globules (vivid yellow by Nilered) were enclosed (Fig. 6).765Volume (%)2041432100.010.11Particle diameter (µm)101008 00307JFig. 5. Volume-related particle size distribution of homogenised and HTSTheated whole before foaming and of the lamellar liquid 1, 10 and 20 min afterfoaming at 50 C. Results listed are mean values and standard deviations ofthree measurements;before foaming;1 min after foaming;10 min after foaming;20 min after foaming.Fig. 6. Fluorescence microscopic image of a fat aggregate in the lamellarliquid of a foam prepared at 50 C from homogenised and HTST-heated wholemilk; FK ¼ fat globules (yellow, converted to greyscale).The mechanism of the aggregate formation and its microstructure still needs further clarification. Continuous but slowstirring of the liquid for 3 h and thinning with deionised waterdid not brake up the aggregates. This induces a considerablecohesion of the aggregate structure. The aggregates in Fig. 6look like protein/lipid aggregates in evaporated milk(Hoffmann, Kiesner, & Schrader, 1998). These aggregatesof fat globules and attached casein were mainly the resultof the high thermal load during product manufacture and ofprotein as well as calcium enrichment after water evaporation. Addition of Ca chelating agents such as sodium citrateor EDTA dissolved these aggregates and intact single fatglobules remained. The removal of calcium led to a disintegration of the globule-surrounding casein and an increase ofserum casein. Corresponding experiments should be carriedout with the not-drained lamellar liquid of the foam. Whereasthe increase of dry matter during the production of condensedmilk occurred by water evaporation, the increase of foam drymatter was a result of continuous drainage. A second distinguishing mark is the high heat load of the condensed milkand the relatively low thermal load of the foam. Therefore,a different mechanism of aggregate formation is to be assumed. Fig. 6 indicated that the fat globules are obviouslystill intact inside the aggregate. The surrounding materialmay consist of accumulated interface material but also ofdifferent protein fractions which were not attached to theinterface.TEM images of newly prepared foams showed that themembrane of fat globules very close to the bubbles was partially disrupted and liquid fat spread out on the surface ofthe air bubbles (Fig. 7). Fat globules with intact membraneswere found in the serum at a distance of not less than0.5 mm to the interface. Visible proteins (casein micelles andsubmicelles, denatured whey proteins) were observed nearthe interface, but presumably they were not directly adsorbed.A similar sight was observed after 20 min of drainage (Fig. 8).Coalesced fat was still adsorbed at the bubble surface.
2042K. Borcherding et al. / LWT - Food Science and Technology 41 (2008) 2036e2043Proteins, probably casein submicelles and denatured wheyproteins, were identified again close to the interface, whereasnative casein micelles were no longer detectable. The interfaceitself showed no detailed structures. Therefore, the TEMimages indicated that the aireserum interface of whole milkfoams mainly consists of protein monomers or oligomerssuch as native whey proteins or non-micellar casein, which,unfortunately, could not be seen by TEM. A film of coalescedliquid fat partially covered the fat globule surface.4. ConclusionFig. 7. TEM image of a foam bubble and surrounding lamellae from homogenised and HTST-heated whole milk immediately after foaming (L ¼ air bubble, La ¼ lamella, P ¼ visible protein structure, F ¼ coalesced fat, FK ¼ fatglobule).The foaming apparatus used operated with a low input ofmechanical energy. Therefore, more adsorbing affinity of individual milk proteins was necessary at the aireserum interfaceas with foaming devices under high energy supply. Most of theproteins were dispersed in the serum phase of the whole milk,only a small portion was part of the secondary membrane ofthe homogenised fat globules. Under the conditions chosen,whole milk was better suited for foaming between 50 and60 C than at lower temperatures. This corresponded withthe results of Borcherding, Lorenzen, Hoffmann, and Schrader(in press) which used HTST-heated skim milk and identicalfoaming conditions. In summary, the effect of foamingtemperature on the foaming properties was very similar withskim and whole milk. This indicates that the fat globules inhomogenised whole milk were obviously of minor importancefor the foaming properties of the product. Therefore, the skimmilk phase with the milk protein fractions seemed to bemainly responsible for the foaming properties. However, atunfavourable foaming temperatures such as 20 and 30 C,the fat globules affected the foaming properties more visibly.It was surprising to learn that fat globule size and resultingtotal membrane area had only marginal effect on the formationand stability of foam. Obviously, the aireserum interface ispredominantly dominated by milk protein fractions.It may be concluded from our results that a varying but lowfat content (0e3.5%) and a varying fat globule size ina pasteurised milk, which was foamed at 50e60 C with a lowmechanical input, had no decisive effect on the foaming properties. The study reveals that the aireserum interface consistedmainly of protein monomers and oligomers, while caseinmicelles were not directly adsorbed. The fat globule membraneseemed to be partly destroyed near the interface and coalescedliquid fat formed a restricted film on the bubble surface thatwas apparently of minor importance for the foam properties.ReferencesFig. 8. TEM images (a, b) of foam bubble(s) and surrounding lamella fromhomogenised and HTST-heated whole milk 20 min after foaming (L ¼ air bubble, La ¼ lamella, P ¼ visible protein structure, F ¼ coalesced fat, FK ¼ fatglobule).Anderson, M., & Brooker, B. E. (1988). Dairy foams. In E. Dickinson, &G. Stainsby (Eds.), Advances in food emulsions and foams (pp. 221e255). London: Elsevier Applied Science.Berger, K. G. (1997). Ice cream. In S. F. Friberg, & K. Larsson (Eds.), Foodemulsions, (3rd ed.). (pp. 413e490) New York: Marcel Dekker.Besner, H., & Kessler, H. G. (1998). Interfacial interaction during the foamingof non-homogenized cream. Milchwissenschaft, 53(12), 682e686.Borcherding, K., Lorenzen, P. Chr., Hoffmann, W., & Schrader, K. Effect offoaming temperature and varying time/temperature-conditions of pre-
K. Borcherding et al. / LWT - Food Science and Technology 41 (2008) 2036e2043heating on the foaming properties of skimmed milk. International DairyJournal, in press. doi:10.1016/j.idairyj.2007.11.016.Brooker, B. E. (1985). Observation on the aireserum interface of milk foams.Food Microstructure, 4, 289e296.Brooker, B. E. (1990). The adsorption of crystalline fat to the airewaterinterface of whipped cream. Food Structure, 9, 223e229.Brooker, B. E. (1993). The stabilization of air in foods containing fat ea review. Food Structure, 12, 115e122.Brooker, B. E., Anderson, M., & Andrews, A. T. (1986). The development ofstructure in whipped cream. Food Microstructure, 5, 277e285.Buchheim, W. (1991). Mikrostruktur von aufschlagbaren Emulsionen. KielerMilchwirtschaftl
divided into classes from 0.0 to 1.0 mm (class order (x)¼0.1 mm) and the percentages as well as their standard deviation within the classes were calculated on the basis of triplicate experiments. 2.4.3. Electron microscopy A transmission electron microscope (TEM, Tecnai 10, FEI Company, Eindhoven, Netherlands) was used for the analysis