Transcription
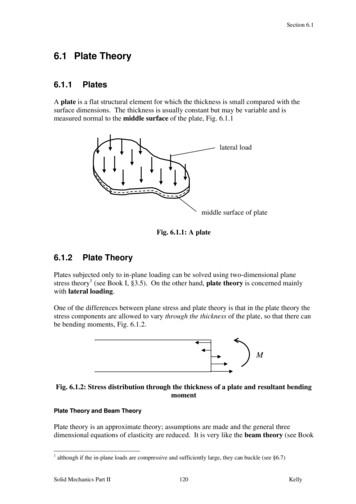
Introduction to Koopman operator theory ofdynamical systemsHassan Arbabi January 2020Koopman operator theory is an alternative formalism for study of dynamical systemswhich offers great utility in data-driven analysis and control of nonlinear and high-dimensionalsystems. This note gives a short and informal review of this theory, as well as a list of references that point to rigorous mathematical treatments and a variety of applications to physicsand engineering problems.1 1arbabiha@gmail.comThese notes are adapted from my PhD dissertation at UC Santa Barbara [1].1
Contents1 Classical theory of dynamical systems32 Data-driven viewpoint & Koopman operator83 Koopman linear expansion113.1Examples of linear Koopman expansion for nonlinear systems . . . . . . . .123.2Koopman mode decomposition . . . . . . . . . . . . . . . . . . . . . . . . . .154 Koopman continuous spectrum and chaos185 History of Koopman operator212
1Classical theory of dynamical systemsA dynamical system, in the abstract sense, consists of two things: a set of states throughwhich we can index the evolution of a system, and a rule for that evolution. Although thisviewpoint is very general and may be applied to almost any system that evolves with time,often the fruitful and conclusive results are only achievable when we pose some mathematicalstructure on the dynamical system, for example, we often assume the set of states form alinear space with nice geometric properties and the rule of evolution has some order of regularity on that space. The prominent examples of such dynamical systems are amply foundin physics, where we use differential equations to describe the evolution of physical variablesin time. In this note, we specially focus on dynamical systems that can be represented asẋ f (x),(1)where x is the state, an element of the state space S Rn , and f : S Rn is a vector fieldon that state space. Occasionally, we will specify some regularity conditions for f like beingsmooth or a few times differentiable.We also consider dynamical systems given by the discrete-time mapxt 1 T (xt ),t Z(2)where x belongs to the state space S Rn , t is the discrete time index and T : S Sis the dynamic map. Just like the continuous-time system in (1), we may need to makesome extra assumptions on T . The discrete-time representation of dynamical system usuallydoesn’t show up in representation of physical systems, but we can use it to represent discretetime sampling of those systems. This representation is also more practical because the data3
collected from dynamical systems almost always comes in discrete-time samples.The study of the dynamical systems in (1) and (2) was dominated by the geometricviewpoint in much of last century. In this viewpoint, originally due to Henri Poincaré, thequalitative properties of the solution curves in the state space are studied using geometrictools and the emphasis is put on the subsets of the state space that play a big role in theasymptotic behavior of the trajectories. We briefly describe some concepts from this theoryhere, but a more comprehensive exposition can be found in [22, 62, 64].Assuming that the solution to (1) exists, we define the flow map F t : S S to be themap that takes the initial state to the state at time t R, i.e.,tZtf (x(t0 ))dt0 .F (x0 ) x0 (3)x0 ,t0 0The flow map satisfies the semi-group property, i.e., for every s, t 0,tsZstf (x(t0 ))dt0 ,F F (x0 ) F (x0 ) F s (xZF s (x0 ),s0),t0 000Ztf (x(t0 ))dt0 ,f (x(t ))dt x0Z,t0 0F s (x0),t0 0t s f (x(t0 ))dt0 ,x0 ,t0 0 F t s (x0 ).(4)where is the composition operator.Some of the important geometric objects in the state space of continuous-time dynamicalsystems are as follows:Fixed point: Any point x in the state space such that f (x) 0 (or F t (x) x) is afixed point. The fixed points correspond to the equilibria of physical systems. An important4
notion about fixed points is the stability, that is wether the trajectories starting in someneighborhood of fixed point stay in its neighborhood over time or not.Limit cycle: Limit cycles are (isolated) closed curves in the state space which correspondto the time-periodic solutions of (1). The generalized version of limit cycles are tori (likeCartesian products of circles) which are associated with quasi-periodic motion.Poincaré map: Consider a plane in the state space that is pierced by a limit cycle,and then define a discrete-time map as follows: take point x on the plane, move it with thecontinuous-time system until it pierces the plane again at the point T (x). The Poincaré mapis given by x0 T (x) on that plane and can be used to study the properties of the limitcycle. The fixed point of the Poincarḿap occurs at the intersection of limit cycle and theplane. Stability of that fixed point indicates the stability of the limit cycle.Invariant set: An invariant set B in the state space is any set that satisfies F t (B) Bfor all t, i.e., the trajectories starting in B remain in B. Invariant sets are importantbecause we can isolate the study of the dynamics on them from the rest of state space whichsimplifies the analysis task. Also they include important objects such as fixed points, limitcycles, attractors and invariant manifolds.Attractor: An attractor is an attracting set with a dense orbit. An attracting set is aninvariant subset of the state space to which many initial conditions converge. A dense orbitin a set is a trajectory that comes arbitrarily close to any point on that set. For example, astable limit cycle is an attractor, because if a trajectory starts sufficiently close to it, it willcome arbitrarily close to it, and, the limit cycle itself is a dense orbit. In contrast, the unionof two separate stable limit cycles is an attracting set but not an attractor, because there isno trajectory that comes arbitrarily close to points on both cycles. Simple attractors include5
stable fixed points, limit cycles and tori. A more complicated example of attractor is thefamous butterfly-shaped set in the chaotic Lorenz system which is called a strange attractor.Attractors are the objects that determine the asymptotic (that is post-transient or longterm) dynamics of dissipative dynamical systems. In fact, the mere notion of dissipativity(we can think of it as shrinkage in the state space) is enough to guarantee the existence ofan attractor in many systems [62]. In some cases, the state space contains more than oneattractor, and the attractors divide the state space into basins of attraction; any point inthe basin of attraction of an attractor will converge to it over infinite time.Bifurcation: Bifurcation is any change in the qualitative behavior of all the trajectoriesdue to the changes in vector field f or the map T . For example, if we add some forcing termto the vector field f , a stable fixed point might turn unstable or a limit cycle might appearout of the blue sky. A physical example is when we add damping to an otherwise frictionlessunforced oscillator: without damping all trajectories are periodic orbits, but with dampingthey decay to some fixed point.Here is the traditional approach to study of dynamical systems: We first discover orconstruct a model for the system in the form of (1) or (2). Sometimes, if we are verylucky, we can come up with analytical solutions and use them to analyze the dynamics,by which, we usually mean finding the attractors, invariant sets, imminent bifurcationsand so on. A lot of times, this is not possible and we have to use various estimates orapproximation techniques to evaluate the qualitative behavior of the system, for example,construct Lyapunov functions to prove the stability of a fixed point. But most of the times,if we want a quantitative analysis or prediction, we have to employ numerical computationand then extract information from a single or multiple simulated trajectories of the system.6
The traditional approach has contributed a lot to our knowledge of dynamical and physical systems, but yet it is falling short in treating the high-dimensional systems that havearisen in various areas of science and technology. Some examples include turbulent flowsaround aircrafts, climate system of the earth, smart cars and buildings, power networks, andbiological and social systems. For some of these systems like turbulent flows, we have fairlyaccurate state-space models but numerical modeling is very costly or impractical and wehave to find a way to blend dynamical analysis with whatever amount of data we have fromexperiments, observations or simulations. Moreover, unlike the two- or three-dimensionalsystem, the geometric objects and tools in the state space are difficult to realize and utilizeand there is need to formulate the problems in a way which is more amenable to computation in large dimensions. For many of these systems like biological networks, there is aconsiderable amount of uncertainty in the state space models or there is even no model tostart with. In this case, we have to use the available data to construct an explicit or implicitmodel to be utilized in design, control etc.As a result of these demands, the field of dynamical analysis has started shifting towarda less model-based and more data-driven perspective. This shift is also boosted by theincreasing amount of data that is produced by today’s powerful computational resources andexperimental apparatus. In the next section, we introduce the Koopman operator theory,which is the general framework for connecting data to the state space modeling of dynamicalsystems.7
2Data-driven viewpoint and the Koopman operatorIn the context of dynamical systems, we interpret the data as knowledge of some vari-able(s) related to the state of the system. A natural way to put this into the mathematicalform is to assume that data is evaluation of functions of the state. We call these functionsobservables of the system. Let’s discuss an example: the unforced motion of an incompressible fluid inside a box constitutes a dynamical system; one way to realize the state space is tothink of it as the set of all smooth velocity fields on the flow domain that satisfy the incompressibility condition. The state changes with time according to a rule of evolution whichis the Euler equations. Some examples of observables on this system are pressure/vorticityat a given point in the flow domain, velocity at a set of points or the total kinetic energy ofthe flow. In all these examples, the knowledge of the state, i.e. the velocity field, uniquelydetermines the value of the observable. We see that this definition allows us to think of thedata from most of the flow experiments and simulations as values of observables. We alsonote that there are some type of data that don’t fit the above definition as an observableof the system. For example, the position of a Lagrangian tracer is not an observable of theabove system, since it cannot be determined by mere knowledge of the instantaneous velocityfield.Using the above notion, we formulate the data-driven analysis of dynamical systemsas follows: Given the knowledge of an observable in the form of time series generated byexperiment or simulation, what can we say about the evolution of the state?Consider the continuous-time dynamical system given in (2). Let g : S R be a realvalued observable of this dynamical system. The collection of all such observables forms a8
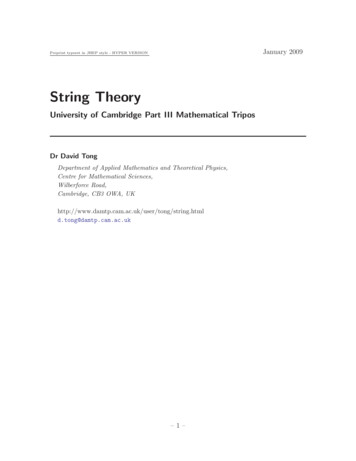
linear vector space. The Koopman operator, denoted by U , is a linear transformation onthis vector space given byU g(x) g T (x),(5)where denotes the composition operation. The linearity of the Koopman operator followsfrom the linearity of the composition operation, i.e.,U [g1 g2 ](x) [g1 g2 ] T (x) g1 T (x) g2 T (x) U g1 (x) U g2 (x).(6)for any two observables g1 and g2 . For continuous-time dynamical systems, the definitionis slightly different: instead of a single operator, we define a one-parameter semi-group ofKoopman operators, denoted by {U t }t 0 , where each element of this semi-group is given byU t g(x) g F t (x),(7)and F t (x) is the flow map defined in (3). The linearity of U t follows in the same way as thediscrete-time case. The semi-group property of {U t }t 0 follows from the semi-group propertyof the flow map for autonomous dynamical systems given in (4),U t U s g(x) U t g F s (x) g F t F s (x) g F t s (x) U t s g(x).(8)An schematic representation of the Koopman operator is shown in fig. 1. We can think of theKoopman operator viewpoint as a lifting of the dynamics from the state space to the space ofobservables. The advantage of this lifting is that it provides a linear rule of evolution — givenby Koopman operator — while the disadvantage is that the space of observables is infinitedimensional. In the next section, we discuss the spectral theory of the Koopman operatorwhich leads to linear expansions for data generated by nonlinear dynamical systems.9
Figure 1: Koopman viewpoint lifts the dynamics from state space to the observable space,where the dynamics is linear but infinite-dimensional.10
3Koopman linear expansionA naive but somewhat useful way of thinking about linear operators is to imagine them asinfinite-dimensional matrices. Then, just like matrices, it is always good to look at the theireigenvalues and eigenvectors since they give a better understanding of how they act on thespace of observables. Let φj : S C be a complex-valued observable of the dynamical systemin (1) and λj a complex number. We call the couple (φj , λj ) an eigenfunction-eigenvalue pairof the Koopman operator if they satisfyU t φj eλj t φj .(9)An interesting property of the Koopman eigenfunctions, that we will use later, is that if(φi , λi ) and (φj , λj ) are eigenfunction-eigenvalue pairs, so is (φi · φj , λi λj ), becauseU t (φi · φj ) (φi · φj ) F t (φi F t ) · (φj F t ) U t φi · U t φj e(λi λj )t φi · φj .(10)Let us assume for now that all the observables of the dynamical system lie in the linearspan of such Koopman eigenfunctions, that is,g(x) Xgk φk (x),(11)k 0where gj ’s are coefficients of expansion. Then we can describe the evolution of observablesastU g(x) Xgk eλk t φk (x),(12)k 0which says that the evolution of g has a linear expansion in terms of Koopman eigenfunctions. If we fix the initial state x x0 , we see that the signal generated by measuring g11
over a trajectory, which is given by U t g(x0 ) g F t (x0 ), is sum of (infinite number of)sinusoids and exponentials. This might sound a bit odd for nonlinear systems since sinusoidsand exponentials are usually generated by linear systems. But we keep in mind that thisexpansion has infinite number of terms.It turns out that Koopman linear expansion in (12) holds for a large class of nonlinearsystems, including the ones that have hyperbolic fixed points, limit cycles and tori as attractors. For these systems the spectrum of the Koopman operator consists of only eigenvalues,and their associated eigenfunctions span the space of observables. Now we consider some ofthese systems in more detail. We borrow these examples from [41] where more details onthe regularity of the system and related proofs can be found.3.1Examples of linear Koopman expansion for nonlinear systems1. Limit cycling is a nonlinear property in the sense that there is no linear system (ẋ Ax)that can generate a limit cycle. If a limit cycle has time period T , then the signalgenerated by measuring g(x) while x is moving around the limit cycle is going to beT -periodic. From Fourier analysis, we haveg(x(t)) Xgj eik(2π/T )tk 0where gj ’s are the Fourier coefficients. We can construct the eigenfunctions by lettingφk (x(t)) eik(2π/T )t , and eigenvalues by λk ik(2π/T ). It is easy to check that (φk , λk )satisfy (9), and the above equation is the Koopman linear expansion of g.2. Consider a nonlinear system with a hyperbolic fixed point, that is, the linearizationaround the fixed point yields a matrix whose eigenvalues don’t lie on the imaginary12
axis. There are a few well-known results in dynamical systems theory, such as HartmanGrobman theorem [64], which state that the nonlinear system is conjugate to a linearsystem of the same dimension in a neighborhood of the fixed point. To be more precise,they say that there is an invertible coordinate transformation y h(x) such that thedynamics on y-coordinate is given by ẏ Ay (with the solution y(t) eAt y(0)) andsuch that F t (x) h 1 eAt h(x) .In other words, to solve the nonlinear system, we can lift it to y-coordinate, and solvethe linear system, and then transform it back to the x-coordinates. We first show theKoopman linear expansion for the linear systems, and then use the conjugacy to derivethe expansion for the nonlinear system.Let {vj }nj 1 and {λj }nj 1 denote the eigenvectors and eigenvalues of A. The Koopmaneigenfunctions for the linear system are simply the eigen-coordinates , that isφ̃j (y) y, wj ,where wj ’s are normalized eigenvectors of A . To see this note that U t φ̃j (y) U t y, wj eAt y, wj y, eA t wj y, eλj t wj eλj t y, wj eλj t φ̃j (y). It is easy to show that φj (x) φ̃j h(x) are eigenfunctions of the Koopman operatorfor the nonlinear system. Other Koopman eigenfunctions can be easily constructedusing the algebraic structure noted in (10).13
To find the Koopman expansion for the nonlinear system it is easier to further transformy into a decoupled linear system. If the matrix A is diagonalizable and V is the matrixof its eigenvectors, then the state variables of the diagonal system are, not surprisingly,the Koopman eigenfunctions, i.e.,z [z1 , z2 , . . . , zn ]T V 1 y [φ̃1 (y), φ̃2 (y), . . . , φ̃n (y)]T [φ1 (x), φ2 (x), . . . , φn (x)]T . Now consider an observable of the nonlinear dynamical system g(x) g h 1 (y) g h 1 (V z) g̃(z) where g̃ is real analytic in z (and therefore y as well). The Taylorexpansion for of this observable in variable z readsXg(x) g̃(z) αk1 ,.,kn z1k1 z2k2 . . . znkn ,{k1 ,.,kn } NnX αk1 ,.,kn , φk11 (x)φk22 (x) . . . φknn (x),{k1 ,.,kn } NnUsing the algebraic property of the Koopman eigenfunctions in (10), we can write theKoopman linear expansion of g asU tg Xαk1 ,.,kn e(k1 λ1 k2 λ2 . kn λn )t φk11 φk22 . . . φknn .{k1 ,.,kn } NnRecall that the original Hartman-Grobman theorem for nonlinear systems is local [64],in the sense that we knew the conjugacy exists for some neighborhood of the fixed point.But the results in [40] has extended the conjugacy to the whole basin of attraction forstable fixed points using the properties of the Koopman eigenfunctions.3. Now consider the motion in the basin of attraction of a (stable) limit cycle. The Koopman linear expansion for observables on such system can be constructed by, roughly14
speaking, combining the above two examples. That is, observables are decomposed intoKoopman eigenfunctions, and each Koopman eigenfunction is a product of a periodiccomponent, corresponding to the limit cycling, and a linearly contracting componentfor the stable motion toward the limit cycle. The development of this expansion islengthy and can be found in [41].3.2Koopman mode decompositionA lot of times the data that is measured on a dynamical systems comes to us not froma single observable, but from multiple observables. For example, when we are monitoringa power network system, we may have access to the time series of power generation andconsumption on several nodes, or in the study of climate dynamics there are recordings ofatmospheric temperature at different stations around the globe. We can easily integratethese multiplicity of time-series data into the Koopman operator framework and Koopmanlinear expansion.We use g : S Rm to denote a vector-valued observable, i.e., 1 g g2 g . , . gmg j : S R, 1 j m.If we apply the linear Koopman expansion (12) to each g j , we can collect all those expansionsinto a vector-valued linear expansion for g,tU g(x) Xgk eλk t φk (x).k 015(13)
The above expansion is the Koopman Mode Decomposition (KMD) of observable g andgk is called the Koopman mode of observable g at the eigenvalue λk . Koopman modes arein fact the projection of observable onto the Koopman eigenfunctions. We can think of gkas a structure (or shape) within the data that evolves as eλk t with time. Let us examine theconcept of the Koopman modes in the examples mentioned above. In the context of powernetworks, we can associate the network instabilities with the Koopman eigenvalues that growin time, that is λk 0, and the entries of Koopman mode gk give the relative amplitudeof each node in unstable growth and hence predict which nodes are most susceptible tobreakdown. In the example of climate time series, the Koopman modes of temperaturerecordings give us the spatial pattern (depending on the location of stations) of temperaturechange that is proportional to eλk t , and therefore indicate the spots with extreme variations.In some physical problems, we have a field of observables, i.e., an observable that assignsa physical field to each element of the state space. A prominent example is a fluid flow. Thepressure field over a subdomain of the flow, or the whole vorticity field, are two examples offield of observable defined on a flow, since the knowledge of the flow state (e.g. instantaneousvelocity field) unqiuely determines those fields. We can formalize the notion of a field ofobservable as a function g : (S, Ω) R where Ω is the flow domain and g(x, z) determinesthe value of the field at point z in the flow domain when the flow is at state x. The Koopmanlinear expansion for g would betU g(x, z) Xgk (z)eλk t φk (x),(14)k 0where the Koopman mode gk (z) is a fixed field by itself, and similar to the Koopman modevectors, determines a shape function on Ω which grows with the amplitude eλk t in time. In16
a fluid flow, the Koopman modes of vorticity, are steady vorticity fields, and the whole flowcan be decomposed into such fields. with amplitudes that grow as eλk t .17
4Koopman continuous spectrum and chaosThe major class of dynamical systems for which the Koopman linear expansion doesnot hold is the class of chaotic dynamical systems. It turns out that for these systems,the eigenfunctions of the Koopman operator (even if they exist) do not span the space ofobservables and we cannot decompose fluctuations of the system all into exponentials andsinusoids. In such cases the Koopman operator usually possesses a continuous spectrum.The continuous spectrum of the Koopman operator coincides with the concept of powerspectrum for a stationary stochastic process if we think of evolving observables as stochasticprocesses [15]. Here we review this notion briefly and focus on connection with stochasticprocesses. Both discrete and continuous spectral forms are unified through the notion ofKoopman spectral measure which we do not discuss here but it can be found in [4,38,39,44].A remarkable property of many smooth dynamical systems is that in the asymptoticregime they naturally admit a probabilistic description. In a more precise statement, manyattractors of dynamical systems support a measure which is invariant under the dynamics:Let A be the attractor of the dynamical system, and let µ be the invariant measure of thesystem. We also assume µ(A) 1 which means that we can think of (A, µ) as a samplespace (with some suitable choice of events). The notion of dynamic invariance for measure µ means µ(B) µ F t (B) for any measurable B A. Now under these conditions, a(measurable) observable g : A R becomes a random variable, that is, the values of g takea meaningful distribution on R. The distribution function of this random variable is thengiven by 1Pg (a) : P g(x) a µ g ( , a) .18(15)
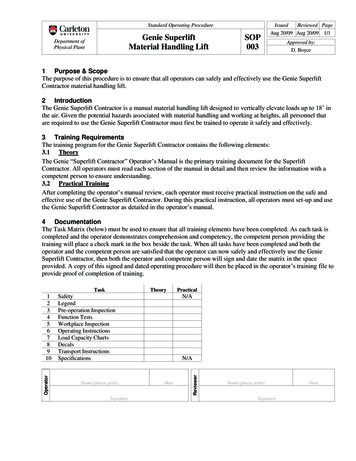
For such a random variable, the expected value can be computed asZE[g] Za dPg (a) g(x) dµ(x)(16)ARSimilar to above, one can show that U t g for any value of t is also a random variable withthe same distribution, and therefore {U t g}t R is an identically distributed stochastic process. Moreover, the measure-preserving property also makes this process strongly stationary(proved by looking at joint probabilities of (g, U t g), then (g, U t g, U s g) etc.). The spectraltheory of stationary stochastic processes [15] provides a spectral expansion for the covarianceof this stochastic process, that is, ZttE (g E[g])(U g E[U g]) eiωt dPg (ω).(17)RThe term Pg (ω) is called the power spectral distribution of the stochastic process, and ifwe think of ω as frequency here (because of the complex exponential term which represents oscillatory motion), then Pg [ω1 , ω2 ] gives an idea of how much of the energy of the processis contained within the frequency interval [ω1 , ω2 ]. It is often assumed that Pg is an absolutely continuous measure and therefore it can be represented by a density function, thatis, dPg (ω) ρg (ω)dω with ρg being called the the power spectral density of the stochasticprocess. Another name for ρg is Koopman spectral density of observable g.Note that unlike discrete spectrum there are no eigenfunctions associated with the continuous spectrum and therefore there are no Koopman modes — except the trivial modeassociated with the zero Koopman eigenvalue. Nevertheless, the spectrum fully characterizes all that can be discovered about the dynamics of the system through the lens of observable g (see Theorem 1 and following remark in [33]). For more discussion on continuousspectrum and its computation see [4, 33, 38]. We also note that chaos in measure-preserving19
?Figure 2: Koopman Mode Decomposition fully describes the evolution of observables onsystems with Koopman discrete spectrum, but not for chaotic systems which have continuousspectrum.system is associated with continuous spectrum, but continuous spectrum can also be seen innon-chaotic systems. See the cautionary tale in [41].What is more interesting is that some systems possess mixed spectra which is a combination of eigenvalues and continuous spectrum. For these systems the evolution of a genericobservable is composed of two parts: a quasi-periodic part associated with eigenvalues andeigenfunctions and a fully chaotic part corresponding to continuous spectrum. As such, thelinear expansion and the Koopman modes docomposition apply to a part of the data. This isspecially appealing for modeling real-world systems where strong periodic and quasi-periodictrends coexist with chaos and turbulence. Some classical examples of systems with mixedspectra are analyzed in [8, 43], and more applied examples from fluid mechanics and climatedata are studied in [4, 5].20
5History of Koopman operator theoryThe Koopman operator formalism originated in the early work of Bernard Koopmanin 1931 [29]. He introduced the the linear transformation that we now call the Koopmanoperator, and realized that this transformation is unitary for Hamiltonian dynamical systems(the “U ” notation comes from unitary property). This observation by Koopman inspiredJohn von Neumann to give the first proof for a precise formulation of ergodic hypothesis,known as mean ergodic theorem [24]. In the next year, Koopman and von Neumann wrote apaper together, in which they introduced the notion of the spectrum of a dynamical system,i.e. the spectrum of the associated Koopman operator, and noted the connection betweenchaotic behavior and the continuous part of the Koopman spectrum [30].For several decades after the work of Koopman and Von Neumann, the notion of Koopman operator was mostly limited to the study of measure-preserving systems; you couldfind it as the unitary operator in the proof of the mean ergodic theorem or discussions onthe spectrum of measure-preserving dynamical systems [36, 50]. It seldom appeared in otherapplied fields until it was brought back to the general scene of dynamical system by twoarticles in 2004 and 2005 [38, 43]. The first paper showed how we can construct importantobjects like the invariant sets in high-dimensional state spaces from data. It also emphasizedthe role of nontrivial eigenvalues of the Koopman operators to detect the periodic trends ofdynamics amidst chaotic data. The second paper discussed the spectral properties of theKoopman operator further, and introduced the notion of Koopman modes.In 2009, the idea of Koopman modes was applied to a complex fluid flow, namely, a jetin a cross flow [52]. This work showed the promise of KMD in capturing the dynamically21
relevant structures in the flow and their associated time scales. Unlike other decompositiontechniques in flows, KMD combined two advantageous properties: it made a clear connectionbetween the measurements in the physical domain and the dynamics of state space (unlikeproper orthogonal decomposition), and it was completely data-driven (unlike the global modeanalysis). The work in [52] also showed that KMD can be computed through a numericaldecomposition technique known as Dynamic Mode Decomposition (DMD) [54]. Since then,KMD and DMD have become immensely popular in analyzing the nonlinear flows [7, 27, 46,47,53–57]. A review of the Koopman theory in the context of fluid flows can be found in [39].The extent of KMD applications for data-driven analysis has enormously grown in otherfields too. Some of these applications include model reduction and fault detection in energysystems for buildings [17, 18], coherency identification and stability assessment in powernetworks [60, 61], hybrid mechanical systems [19], extracting spatio-temporal patterns ofbrain activity [9], background detection and object tracking in videos [16, 35], design ofalgorithmic trade strategies in finance [37], analysis of numerical algorithms [14] and trafficdata [6].Parallel to the applications, the computation of Koopman
continuous-time system until it pierces the plane again at the point T(x). The Poincar e map is given by x0 T(x) on that plane and can be used to study the properties of the limit cycle. The xed point of the Poincarmap occurs at the intersection of limit cycle and the plane. Stability of that xed point indicates the stability of the limit cycle.