Transcription
J Occup Rehabil (2011) 21:199-210DOI 10.1007/sl0926-010-9266-0What Types of Jobs Do People with Disabilities Want?Mohammad Ali · Lisa Schur · Peter BlanckPublished online: 6 October 2010 Springer Science Business Media, LLC 2010Abstract Introduction Do non-employed people withdisabilities want to work, and if so, what types of jobs dothey want? Researchers seeking to explain the lowemployment rate among people with disabilities havefocused primarily on skill gaps, employment disincentivesfrom disability income, accommodation mandates, and (toa lesser extent) employer attitudes and unwelcoming cor porate cultures. There has been little attention paid to theattitudes of non-employed people with disabilities. Meth ods This paper uses the 2006 General Social Survey, arepresentative national survey of US adults that has dis ability information and a special supplement on workerpreferences, to examine the above question. Results Wefind that, relative to their non-disabled counterparts, non employed people with disabilities are (a) as likely to want ajob but less likely to be actively searching, (b) as likely tohave prior job experience, and (c) similar in their views ofthe importance of income, job security, and other valuedjob characteristics. The results, which vary little by type ofimpairment, indicate that the low employment rate ofpeople with disabilities is not due to their reluctance towork or different job preferences. Conclusion CombinedM. Ali (C8J)School of Management & Labor Relations, Rutgers University,94 Rockafeller Road, Piscataway, NJ 08854, USAe-mail: maali1969@gmail.comL. SchurSchool of Management & Labor Relations, Rutgers University,50 Labor Center Way, New Brunswick, NJ 08901, USAe-mail: schur@work.rutgers.eduP. BlanckBurton Blatt Institute, Syracuse University, 900 Crouse Avenue,Crouse-Hinds Hall, Suite 300, Syracuse, NY 13244-2130, USAe-mail: pblanck@syr.eduwith evidence that a large share of new jobs can be per formed by people with disabilities, the findings pointtoward the value of dismantling barriers to employmentfacing many people with disabilities.Keywords Disability · Job preference · EmploymentbarriersDo non-employed people with disabilities want to work,and if so, what types of jobs do they want? Despite passageof the 1990 Americans with Disabilities Act (ADA) andother policy initiatives designed to improve employmentopportunities for people with disabilities, their employmentrates remain low [1-3). One recent estimate is that only40% of the 18 million working-age people with disabilitiesare employed, which is half the 80% rate for peoplewithout disabilities [4]. Their low employment rates con tribute to high rates of poverty [5-7). Employment isimportant not only for increasing economic resources butalso for its social and psychological effects, since it helpsincorporate people with disabilities fully into mainstreamsociety by increasing their social networks, civic skills,independence, citizenship behaviors, and sense of efficacyand inclusion from filling a valued social role [8].Among the possible reasons for the low employment ratesof people with disabilities, researchers have identified skillgaps and employment disincentives from disability income,particularly Social Security Disability Insurance (SSDI), ascontributing factors [2, 9). In addition, employer attitudesand unwelcome corporate cultures reflecting stigma andprejudice against disability may constrain their employmentopportunities [10-12). The attitudes of non-employedpeople with disabilities regarding work and employers,however, have received relatively little attention. If,gi Springer
200non-employed people with disabilities are reluctant to workor have unrealistic expectations about potential jobs, thismay contribute to their low employment levels. If, however,their attitudes and expectations are similar to those of non disabled people, then other factors appear to be primarilyresponsible for their low employment levels.While some recent studies explore the attitudes andexperiences of employed people with disabilities [3, 13], weare aware ofeno existing studies of the work-related attitudesof non-employed people with disabilities. One commonly cited statistic is that 63% of non-employed people withdisabilities would prefer to be working [14], although we donot have comparisons of this figure between people withand without disabilities. In this investigation we use thenationally-representative General Social Survey (GSS) toprovide recent data on the desire for jobs, and the impor tance of several job characteristics, among non-employedpeople with disabilities in the US. We make comparisonsbetween people with and without disabilities, and amongpeople with different types of impairments.Theory and Literature ReviewThere are several reasons that job preferences of people withdisabilities may differ from those of people without dis abilities. First, they may desire flexibility in work arrange ments to deal with health or mobility conditions. As notedby Schur: "Many people with disabilities experience fatigueand other health problems, making it difficult to work a full40-hour work week on a regular, predictable basis. Thosewith mobility impairments may have transportation prob lems, making flexible contingent work more attractive"[15]. People with disabilities are in fact more likely to bepart-time and temporary employees [15], although they arenot more likely to be in jobs with flexible hours [16].Second, people with disabilities have lower incomes onaverage, fewer assets, and are more likely to live in poverty[6], which may lead them to place a higher priority onincome in choosing a job. Third, their low incomes andgreater likelihood of living alone [6] may make them morerisk averse and lead them to place a higher value on jobsecurity, and thereby to decrease the chances their incomewill suffer an unexpected drop and they will not be able tomeet their basic needs.As noted, there is no prior research comparing the jobpreferences of people with disabilities to those withoutdisabilities, but there is a general literature on job prefer ences that yields insights. Research on job attribute pref erences has been conducted since the 1940s, but most ofthe early work was done to understand recruitment throughpotential employees' assessment of job and organizationalvariables [17]. In the studies of this era, particularly after'fl SpringerJ Occup Rehabil (2011) 21:199-210World War II, opportunity for advancement was found tobe more important than pay concerns [18].Since this early research a number of important studieshave been conducted to understand the phenomena of howindividuals perceive and select jobs. This extensive researchhas identified and analyzed a long list of variables includingjob characteristics such as pay, promotion opportunities,benefits, autonomy, flexibility, type of work, and lay-offpolicies [17, 19, 20]; organization characteristics suchas location, values, and recruiter characteristics [21]; indi vidual characteristics such as motivation (intrinsic andextrinsic), growth factors, and values [17, 22]; recruitercharacteristics, recruitment policy, and perception of therecruitment process [19, 23]; person-organization fit includ ing corporate image [21], perceived fit [19, 24, 25],ecological rating [17], and similar values [26]; and otherpersonal and situational factors including hiring expectancy[19]; job pursuit intention [17], and demographic and socialfactors such as culture, social change, and institutions [27].One important research stream is concerned withunderstanding and comparing job attitude preferences basedon gender. These studies are relevant to disability becausegender differences in job attribute preferences have beentheorized to result from different family responsibilities inthe non-work sphere of life [28]. Similarly, the preferencesof people with disabilities may reflect personal and familyconcerns (e.g., health issues, transportation difficulties,therapy schedules, medical appointments, need for personalassistance, and reliance on family members). Many ofthe studies on gender find differences in job preferencesbetween women and men. Jurgensen [18] conductedresearch on a "job preference form" that was created in theearly 1940s and was filled in by all applicants of the Min nesota Gas Company since 1945. Among other things, thestudy discovered that men's ranking of 10 factors that makejobs good or bad had security, advancement, and type ofwork as the top three variables; while women ranked type ofwork, company, and security as their top three preferences.Brenner and Tomkiewicz [29] reexamined prior work on sexdifferences in job orientation to see if they still existed, andfound significant differences on 8 of 25 job characteristics.Lacy et al. [30] studied five job attributes with reference togender: promotion, income, security, hours, and meaning fulness of work. They found minimal differences by sexes asboth genders rank ordered meaningfulness of work as themost impo1tant job attribute. Bigoness [31] conducted astudy drawing samples from 27 MBA programs. He dis covered professional growth, work environment, and salaryas three major job attributes. Out of these three job attributesfemales, contrary to previous research, placed moreemphasis on professional growth, males gave salary moreimportance, and there were no sex differences on jobattributes.
J Occup Rehabil (2011) 21:199-210More recent research based on role theory shows thatrole differences affect job attribute preferences in fourcategories: intrinsic, career 01ientation, work conditions,and parental responsibilities. Furthermore, job and orga nizational attributes that reduced role conflict were pre ferred more by women. Thomas and Wise [22] foundgender differences based on various job factors likediversity in the organization, and recruiter characteristics.Chapman et al. [19] conducted a meta-analysis of 71studies and found that men and women differ in their jobattribute preferences, especially regarding those job attri butes that reduce the conflict between work and non-workroles, such as flexible hours, on-site day cares, location,commute, and family friendly benefits. Furthermore,Chapman et al. [19] attributed these consistent differencesto "role conflict" as suggested by Wiersma [28]. Finally,Miller and Hayward [32] found that both sexes prefer jobsthat are stereotypical and are dominated by their respectivegenders. From the above review it is clear that with somesimilarities men and women do differ in job attributepreferences. But at the same time it would seem that theresearch on gender differences does not go beyond alimited number of job and organizational factors [22].The key conclusion from this literature for our purposesis that the non-work sphere of life can exert a stronginfluence on job preferences and attitudes, helping explainmany of the gender differences in job preferences [28].Similarly, as noted above, the need to accommodate non work concerns such as health and mobility issues may leadpeople with disabilities to prefer jobs with greater flexi bility, while their lower incomes and greater likelihood ofliving alone may lead them to prefer jobs with high incomeand job security.There are several studies that assess job preferences ofpeople with mental impairments with the aim of matchingtheir preferences with future jobs. The requirement formatching jobs with job preferences, especially for peoplewith mental impairments, is primarily based on require ments for vocational rehabilitation specified in the Reha bilitation Act of 1973, amended in 1998 [33]. Furthermore,assessment of job preference and choice is consistent withthe philosophy of self-determination that would lead tobetter job satisfaction and better quality of life [33, 34].Finally, assessment is considered an important componentof job matching that increases chances of employmentsuccess, creating higher levels of motivation for the jobseeker to improve skills, and respect for individual choice[34].Based on the above, there are some studies that assessthe use, validity, and reliability of assessment softwareused to ascertain job preferences of people with mental andintellectual disabilities. In all cases, the software programswere found to be useful as tools to match jobs with201preferences of the people with disabilities [33, 35, 36].Other than these eff01ts there is research that assessesaspects of rehabilitation programs for people with severemental illness (SMI). These studies find, for example:people with SMI have the desire to work more hours, andtheir job preferences stay stable over time [37]; job pref erence and actual jobs should match for job satisfaction[36]; and job preference assessment is an important tool tomatch jobs for people with mental disabilities [34].In sum, there is a research gap in the job attributepreference literature, with no studies compming the jobpreferences of people with and without disabilities. Thelittle work that has been done is limited to examiningoverall job preferences of people with mental disabilitiesfor the purposes of vocational rehabilitation.Data SourcerThe data source for this aticleis the 2006 General SocialSurvey (GSS). The GSS is a long-standing nationally representative survey of Americans age 18 or older, con ducted every year or two since 1972 by the NationalOpinion Research Center at the University of Chicago. 1The 2006 GSS had seven questions added to identifypeople with disabilities, which were drawn from the2001-2002 National Comorbidity Survey after an intensiveanalysis to determine the most efficient set of questions foridentifying people with disabilities [38]. The survey has atotal of 2,777 respondents with disability information, ofwhom 590 were identified with a disability representing aweighted disability rate of 19.2%. This disability rate issimilar to the rate of 17.6% using the same disabilityidentifiers in the 2001-2002 NCS, and to the 17.7% rateusing a different set of identifiers for those age 21 or olderin the 2006 American Community Survey conducted by theUS Census Bureau.2 When the GSS data are restricted tothose of working age (18-64), there are 2,273 respondentsof whom 391 were identified with a disability, representinga weighted disability rate of 15.9%. The seven questionsidentifying disability are presented in the "Appendix" tothis article. These questions allow identification of fourmajor categories of impairment: visual, hearing, mobility,and mental.The questions on job preferences are not part of the coreGSS, but part of a special module in 2006 conducted incoordination with the International Social Survey Pro gramme.3 The question wordings for the variables used are1 http://www.gss.norc.org/.2 Calculated from [39] using estimates for the 21-64, 65-74, and 75or older age categories.www.issp.org.,gi Springer
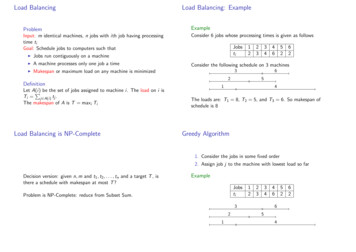
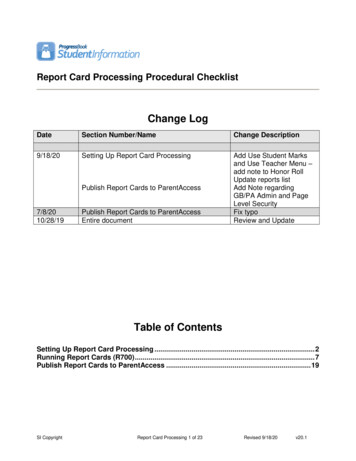
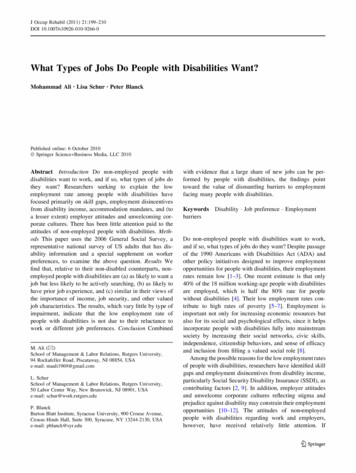
J Occup Rehabil (2011) 21:199-210202Table 1 Disability prevalenceand employment rates amongworking-age populationOverallAmong employedAmong non-employed(1)(2)(3)Employmentrate if conditionat left(4)Prevalence100.0100.0100.072.0No disability (%)84.188.772.775.6Disability (%)15.911.327.351.2***51.5***Overall (%)Type of disability*** Significant difference fromno-disability employment rateat P 0.001Visual impairment (%)3.72.76.3Hearing impairment (%)4.54.05.863.4***Mobility impairment (%)8.64.818.340.0***Mental impairment (%)7.64.216.239.7***Sample size2,273provided in the "Appendix" . Tables 1, 2, 3, 4 and 5 presenttabulations by disability status and type of disability, whileTable 6 presents OLS regressions controlling for a varietyof personal characteristics that may have independentinfluences on job preferences. All analyses are restricted tothose of working age (18-64).ResultsTable 1 shows the disability prevalence and employmentrates among the working age population. The table showsthat the employment rate among people with disabilities is51% compared to 75% among people with no disabilities.It further shows that the low level of employment persistsfor people with all types of disabilities, as compared withpeople with no disabilities, but it is especially low (40%)among people with mobility and mental impairments. Thelow employment rates are consistent with a wide variety ofother studies on employment of people with disabilities(e.g., [l-4]).The remaining tables focus on the non-employed, makingcomparisons between people with and without disabilities,and among those with different types of disability. Table 2presents descriptive data on demographic characteristicsand sources of economic support, showing several differ ences that may help explain job preferences. Non-employedpeople with disabilities are on average 7 years older thanindividuals with no disability (46.8 years as compared to39.5 years). Furthermore, individuals with disabilities haveon average fewer years of schooling as compared to indi viduals with no disability (12.5 years as opposed to13.3 years), and are only half as likely to have attained acollege degree. While differences in gender and maritalstatus are not significant, people with disabilities live insmaller households on average, and are less likely to livewith preteens.'fl Springer1,660612Lower levels of education and higher age may lead todifficulties in finding jobs, less income, and differentpreferences in jobs. Looking at the main sources of eco nomic support, non-employed people with disabilities areless likely than non-disabled people to receive supportfrom their spouses or partners (24 and 52%, respectively)and more likely to receive social assistance and welfare(23 and 6%). Last)y, the above results are found across alltypes of impairments.How many non-employed people with disabilities wantto work? Table 3 shows almost no difference betweenpeople with and without disabilities in the desire for paidwork. Four-fifths (80%) of non-employed people withdisabilities would like a job now or in the future, comparedto 78% among the non-disabled. The rate is especially highamong people with mental impairments (90% ). Given thatdisability income, pensions, and welfare assistance oftencreate disincentives for employment, we examine the dataseparately for those who do not receive such income, andfind that 78% desire to work, which is also almost identicalto the overall figure. The table further shows that peoplewith disabilities not only have the same desire to work buttheir desire to spend "much more" time in paid work issignificantly higher than for non-disabled people (42 and20%, respectively). Employment is a socially-valued activ ity which may cause these rates to be inflated by socialdesirability bias, but there is no reason to believe that thisbias would differ by disability status, so the comparisonsstill yield useful information.Despite their similar or greater desires for paid work,people with disabilities are not optimistic about gettingjobs. When asked how likely it is they would get a job, only25% said "very likely" , which is only half the rate ofnon-employed people without disabilities (51%). The rateis low across the four types of impairment. People withdisabilities are also less likely to be currently searching forjobs (20%) compared to non-disabled people (33% ), which
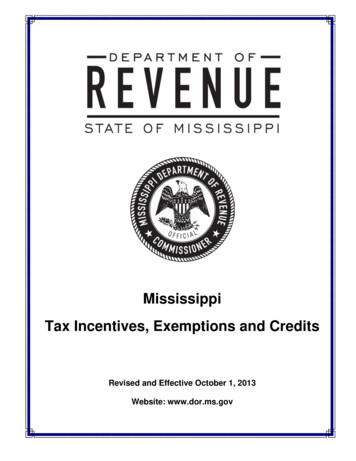
J Occup Rehabil (2011) 21:199-210203Table 2 Descriptive statistics for non-employed talimpairment(6)44.8***11.8AgeMeanSDGenderFemale .5***67.460.963.254.555.6**63.89.7White non-Hispanic (%)69.867.268.l69.669.l72.6Black (%)Hispanic 2.8**3.52.73.4***45.12.4***1.22.5***1.3Other (%)EducationMean yearsSD% with college degreeMarried, spouse present (%)Household 2.6***10.514.44.7**16.9Pension/social security (%)Unemployment benefits (%)11.011.64.83.7Spouse/partner (%)52.4Other family members (%)Social assistance/welfare (%)Occasional work (%)13.75.5Mean numberSD% w/preteens% w/teensMain source of economic supportOther (%)mSaplesizeDemographicsEconomic 1484012712015310624207163* Significant difference from no-disability figure at P 0.10, ** P 0.05, *** P 0.01may both reflect and contribute to their low optimism infinding a job. When asked about specific actions to find ajob in the past 12 months, people with disabilities were aslikely to have answered advertisements, registered atagencies, advertised for a job, or asked relatives, friends, orcolleagues about a job, but they were less likely to haveapplied directly to an employer (18% compared to 33% forpeople without disabilities). When broken out by impair ment type, people with visual impairments were less likelyto have taken four of the six specific actions to find jobs,while people with hearing and mobility impairments-butnot mental impairments-were less likely to have applieddirectly to employers.What prior employment experience and training do non employed people with disabilities have? Table 4 showsthat people with disabilities are as likely as non-disabledpeople to have had jobs in the past (87 and 83% respec tively). The table also shows that the average years sincethe last job ended are significantly higher for people withdisabilities (8.3 years compared to 4.7 years), suggestingthat there is a possibility of greater deterioration of jobskills, or perhaps job networking, among people with dis abilities. But if we look at training to improve skills inthe past 12 months we observe no significant differencebetween people with and without disabilities (13 and 16%,respectively), suggesting that at least some people with,gi Springer
J Occup Rehabil (2011) 21:199-210204Table 3 Desire and search for jobs among non-employedNodisabilityWould like paid job now or in future (%)If no pension, SS, or welfare (%)Would prefer to spend "much more" time in paid work (%)If no pension, SS, or welfare (%)"Very likely" to get job (%)If no pension, SS, or welfare (%)Searching for job (%)If no pension, SS, or welfare .010.8***25.315.l***38.lActions to find job in past 12 monthsRegistered at unemployment agency (%)17.113.24.1***27.512.l15.9Registered at private agency (%)1l.47.92.l***7.07.213.9Answered advertisements for jobs ed directly to employers (%)33.218.4**12.2**18.8**26.2Asked relatives, friends, or colleaguesto help find job (%)31.826.l14.3*23.l39.0Advertised for job (%)0.08.2***29.6Sample sizeAll15410725207263If no pension, SS, or welfare1216313114334* Significant difference from no-disability figure at P O.lO, ** P 0.05, *** P 0.0ldisabilities are trying to update their skills. Not surprisinglythe most likely reason cited for ending the last job amongpeople with disabilities is permanent disability (48%),while people without disabilities were most likely to citefamily responsibilities (37% ). The occupations of the mostrecent jobs between people with and without disabilitiesare fairly similar, so differences in job search and optimismcannot be accounted for by differences in occupationalexperience.What types of jobs do people with disabilities prefer?Table 5 presents simple tabulations to a variety of ques tions about important job characteristics. The results showthat people with disabilities are not significantly differentfrom non-disabled people on any of the questions, exceptthat they are less likely to prefer a private business to agovernment job (64% compared to 75%). Possible expla nations for this preference may be that people with dis abilities may believe that government agencies are lesslikely to practice discrimination in hiring and work prac tices, or that government agencies provide better and morestable benefits, perhaps due to their union status.The simple comparisons in Table 5, however, may maskunderlying differences in job preferences by disabilitystatus, due to the confounding influence of differences inage, education, and household size found in Table 2.Table 6 provides a more rigorous analysis of job prefer ences of people with disabilities, using multiple regressionwith controls for a variety of these demographic variables'fl Springer(listed at the bottom of the table). The findings from theregressions do not, however, change the basic findingsdescribed earlier: there are no significant differences in jobpreferences, except for a greater desire for government jobsamong people with disabilities (column 21).Contrary to expectations and popular belief, people withdisabilities are not more likely to desire flexibility, highincome, or job security, at least as compared to peoplewithout disabilities controlling for certain demographicfactors. There are several significant coefficients whendisability is broken into the four major types of impair ments. People with mental impairments, for instance, areless likely than non-disabled people to say that high incomeor promotion chances are important in a job, and morelikely to say that helping others and helping society isimportant. People with mobility impairments are morelikely to report that high income is important, but also morelikely to say that they would enjoy work even if they werenot paid. An important caveat regarding these few signif icant findings is that some of the coefficients will have highT-statistics and resultant significance levels even if the nullhypothesis is true (a Type I error). In the absence ofconsistent patterns, we are reluctant to interpret these fewsignificant findings associated with specific impairments.This problem is not due to sample size; in fact, a largersample would increase the chances of incorrectly rejectingthe null hypothesis. Further research in this area should besensitive to this issue, using multiple methods to validate
J Occup Rehabil (2011) 21:199-210205Table 4 Prior employment and recent training among non-employedEver had job for 1 year or more [% (n)]When last paid job endedMean # of years ago (n)Main reason job endedRetirement age (%)Retired early by choice (%)Retired early not by choice impairment(6)83.2 (153)86.7 (108)85.7 (25)71.3 (21)96.3*** (72)85.1 (63)4.74 (127)6.413.61.4Became permanently disabled (%)Place of work shut down (%)9.514.1Dismissed (%)Term of employment/contract ended (%)Family responsibilities (%)6.310.0I got married [% (n)]Occupation of most recent jobManagement (%)Mgt-related (%)Professional (%)Technical (%)36.62.1 (125)5.94.0Service (%)16.73.312.018.921.5Agricultural (%)Blue-collar [% (n)]Sales (%)Clerical (%)Had training to improve job skillsin past 12 months [% (n)]8.25*** (91)10.98*** (21)9.23* (16)8.07*** (66)9.00*** .817.4***2.514.217.l*3.37.427.36.14.813.5***2.6 (89)6.71.1**2.4 (21)10.90.04.9***5.05.544.3***7.68.57.321.8*0.0 (15)3.4 (66)0.0 12.332.7*0.617.l (365)2.522.2 (162)0.017.2 (37)2.931.7 (29)3.7*24.1 (110)3.921.1 (99)16.4 (150)13.4 (107)17.6 (20)10.3 (72)12.3 (63)9.5*1.611.82.0*** (25)* Significant difference from no-disability figure at P 0.10, ** P 0.05, *** P 0.0 Iany significant relationships and establish patterns that tella consistent and meaningful story.ConclusionThis evidence strongly indicates that the low employmentrate of people with disabilities is not due to their reluctanceto work or to different job preferences. Non-employedpeople with disabilities are as likely as their counterpartswithout disabilities to report they want a job now or in thefuture, and do not express generally different preferencesover the characteristics of jobs.While people with disabilities are as likely as thosewithout disabilities to express the desire for a job, they areless likely to be actively looking for a job, apparently dueto less optimism about finding a suitable job. This loweroptimism may reflect the very real recognition that one'simpairments often constrict productivity in a number ofjobs so that fewer suitable jobs are available, particularly ifone has low education and training levels. Importantly, thelower optimism may also reflect perceptions that employerattitudes or culture-including prejudice, disc1imination,and reluctance to make workplace accommodations-oftendecrease the chances of a job offer, promotion, or suc cessful retention [13]. While it is clear that the disabilityincome system plays a strong role in the employmenttrends for people with disabilities [9, 40], in this sample wefind the same pattern of preferences for a job and optimismover finding one even when restricting the sample to peoplewho do not receive disability, pension, or welfare income.The finding that job preferences are similar betweenpeople with and without disabilities is somewhat surpris ing, given that flexibility in the hours or days that oneworks may be of special benefit to many people with dis abilities. It is consistent with evidence that people withdisabilities are no more or less likely to have flexible workschedules [16]. A concern for flexibility may nonethelessbe exp
School of Management & Labor Relations, Rutgers University, 50 Labor Center Way, New Brunswick, NJ 08901, USA e-mail: schur@work.rutgers.edu P. Blanck Burton Blatt Institute, Syracuse University, 900 Crouse Avenue, Crouse-Hinds Hall, Suite 300, Syracuse, NY 13244-2130, USA . e-mail: pblanck@syr.edu