Transcription
FOULING MONITORING AND CLEANING OPTIMISATIONIN A HEAT EXCHANGER NETWORK OF A CRUDE DISTILLATION UNITAndrea Heins1, Ramón Veiga1, Carlos Ruiz2, Andrés Riera21Argentinean Technology Center (CTA) - REPSOL YPFBaradero S/N (1925), Ensenada, Pcia. de Buenos Aires, Argentinaaheinsd@repsolypf.com; raveigam@repsolypf.com2SOTEICA, Ideas & TechnologyÁlvarez Thomas 796 4B, Buenos Aires, Argentinacarlos.ruiz@soteica.com; g in preheat networks of crude distillation units(CDU) plays an important role in energy consumption. Inthis work a procedure to monitor the performance of the heatexchanger network (HEN) and to optimize the cleaning ispresented.The procedure is based on a rigorous simulation of theHEN using Hysys (from Aspen Technology). The simulationis used to estimate the service overall heat transfercoefficient with real operational data acquired from theunit’s Plant Information System (PI). The clean overall heattransfer coefficient is calculated for each one of theindividual heat exchangers with a rigorous simulation usingTASC (rigorous heat exchanger simulator also from AspenTechnology), embedded into Hysys. A comparison betweenthe service and clean overall heat transfer coefficientsprovides the actual performance for each individual heatexchanger and for the complete HEN.The first step is to collect the HEN operative data fromthe Plant Information System and to perform an ad-hoc preprocessing of each individual exchanger data (i.e., feed andproduct inlet and outlet temperatures and flow rates) in orderto identify stable periods from which the mentionedcalculations will be performed. As the feed/products flowrates and unit operating conditions are constantly changing,the steady intervals detection is a very important taskbecause calculations performed with data of unstableoperation time intervals could be erroneous and producenon-sense results.The overall procedure is managed from an Excelenvironment, which performs the needed calls to PI andHysys/TASC simulators in order to calculate each exchangerfouling and HEN overall performance under the actualfouling situation. Excel also commands the evaluation of thecleaning policies economics, searching between several predefined cleaning alternatives.Results of the above mentioned methodology applied toa complex feed preheat HEN of the Topping IV CDU ofREPSOL YPF Luján de Cuyo Refinery, Argentina, arepresented.In the refining industry, the heat exchangers used forenergy recovery suffer a progressive heat transfer efficiencyloss due to fouling. The immediate consequences of this lossare a major consumption of energy in the furnaces and, incertain cases, the need to reduce throughput to compensatethe low efficiency of the preheat train. In addition,Atmospheric and Vacuum units represent between 35% and40% of the total process energy consumption in a refinery.Due to this, any saving that could be achieved in these unitswill have a great impact in reducing operating costs andgreenhouse effect related gaseous emission.The main objective of this work is to develop andimplement a methodology to perform the heat exchangersnetwork monitoring and cleaning optimisation, as well as theevaluation of the economic impact due to cleaningstrategies. Also, to implement the software and informationarchitecture needed to carry on those tasks in a periodic,routine and non-attended way.DATA PROCESSINGThe methodology was developed based on a particularcase study for Topping IV Unit, at REPSOL YPF Luján deCuyo Refinery, located in Mendoza Province, Argentina.The first stage of the study consisted of a pre-processingof the historical data available to assure that the informationto be used in the calculations belonged to a "stable"operating period of the Unit and that they did not containgross measurements errors.Initially it was considered the possibility of classify thequality of the information and stability of the process usingstatistical criteria (standard deviation) or the rangecalculated from maximum and minimum during a givenperiod. They were collected from the historical informationaverage on a daily basis, but after reviewing them, poorresults were observed, possibly due to the accumulativeeffect of the disturbances suffered by the Plant along theday. As a consequence, it was decided to collect data on aHeat Exchanger Fouling and Cleaning – VII, July 1 - 6, 2007, Tomar, Portugal
shorter basis (every 1 minute) to detect process steadyperiods to perform the calculations. Also, the usage ofstandard deviation as a possible index of steadinessdetection was discarded, because it turned out to be a poortool for detecting signal stability (as steady state refers).Standard deviation was more related to the signal noise thanto its steadiness.The steadiness of each time interval is defined using therange (maximum - minimum) during the period of study anda criterion of stability defined for every particular variable.The average values of all the variables, during the stableperiods, are calculated in a space corresponding to a certainfraction of the given interval. For example, if the stabilityperiod lookup was for 2 hours, the average values werecalculated for the last 30 minutes of this period.As a second stage of data checking, once steadiness wasdetected, heat balances are calculated for both sides of everyheat exchanger. The goal is to check if the heat exchangedon each side match. As a reference, it was pointed out that atype J thermocouple has a range from 0 to 750 ºC, with anuncertainty of 2.25 ºC and that the rates measured by plateorifice have an uncertainty of 5 % (Tonin et al.). Therefore,the major total uncertainty in the heat duty calculation ofeach side is 7.5 %. Considering this previous value, themaximum technically expected error would be 15 %. Heatdifferences between both sides of the exchanger bigger thanthis percentage can indicate that the measurements wouldnot be acceptable for calculations. This acceptancepercentage was considered in our methodology as a startingvalue, but other percentages can be used for gross errorsdetection. In fact, for some particular equipment, the heatcalculation errors can be significantly bigger than thementioned 15 % due to diverse factors (for example, errorsin both flow and temperature measurements bigger than thetechnically expected maximum percentage).perform the required calculations. Hysys model includes thenecessary information to carry on all the calculations, fromthe heat exchangers mechanical design and crude oil andproducts characterization up to the pre-flash columnsimulation that removes light compounds from crude,located before the last section of HEN, prior to the feedfurnace.In the calculation steps where a more rigoroussimulation of the heat exchangers is necessary, TASC isinvoked from the Hysys model.The application manager performs, as first task, the datacollection from PI, the detection of the steady periods andcalculation of the average values to be used into thecalculations.The stability information is stored in files that werecreated by the automated data process applications. Thesefiles look like the one shown in Fig. 1.Fig. 1The required information to execute the model runs isprovided in another Excel spreadsheet where thisinformation will be loaded to allow the interaction betweenthe application and the simulator (Fig. 2).DEVELOPED SOFTWARESeveral software tools were developed to execute all thesteps and necessary calculations for the projectimplementation. The objective was that the whole sequence,from data collection and validation, up to the heatexchangers train simulations and fouling factors calculation,as well as the results write back again in the PI system,could be performed automatically. The tasks sequence iscontrolled from a main application developed in VisualBasic and embedded in Excel. The calculation sequence isinitiated from the VB application every time the procedureis executed (daily or weekly) according to a user definedfrequency.The presented methodology involves the building of asingle Hysys simulation file containing the model needed toHeat Exchanger Fouling and Cleaning – VII, July 1 - 6, 2007, Tomar, PortugalFig. 2
Also, an output information template is filled up with theresults of the execution to be retrieved. Fig. 3 exemplifiesthe columns results.from the main Excel application where calculation forthe equipments involved in each case study are defined.Files containing the different cleaning alternativeseconomical impact are generated.Actual fouling factors calculationThe methodology mentioned in step 4. above includes thefollowing steps:Fig. 3CALCULATION METHODOLOGYAs a first step for heat exchanger fouling monitoring theactual global heat transfer coefficients (Ua) are usuallycalculated over time. Then, calculation of the fouling factorRf is carried out, comparing the former with the value of Ucorresponding to the clean equipment (Uc).In our methodology, a time varying Uc will be estimatedfor each exchanger from the inlet conditions of shell andtubes sides (rates and inlet temperatures of both fluids).Therefore, Uc will not remain constant in time, becauseprocess conditions are constantly changing or modified(different rates and inlet temperatures as consequence ofchanges in the unit operation).The data processing sequence and calculations carriedout by the application are as follows:1. Collection of historical information of the neededsignals sampled every 1 minute, during the period understudy. Historical raw data files are generated.2. Data processing for the calculation of auxiliary orcomplementary variables (e.g., average of redundanttemperatures, sum of several flow-rates, etc). Historicaldata processed files are generated.3. Steady state intervals searched during the consideredperiod or fixed periodic sampling with a givenfrequency (both options are available). Averaged datavalues files containing the samples of the steady periodsare generated.4. Actual fouling factor calculations for each heatexchanger, using the methodology explained bellow.Fouling factor and calculation results files aregenerated.5. Results of fouling factors validation and writing backvalidated calculated data into the plant informationsystem.6. Evaluation of cleaning alternatives. Impact evaluationfor a given set of a-priori defined cleaning alternativesin terms of energy consumption in the furnace. This isdone activating and deactivating Hysys model linesa. Average heat duty calculation for each heat exchangerSimple heaters / coolers in the Hysys model are used tocalculate the heat exchanged through each side of all theequipments. The comparison between the heats of hot andcold sides is externally done, from the Excel embeddedapplication manager.The overall exchanged heat should be calculated by theaverage of both sides but, as mentioned before, errors abovethe technically expected 15% maximum could appear.Therefore, a confidence factor (Cf) is used in the calculation.If Cf 1, the heat duty calculated for the crude side is morereliable. If Cf 0 the confidence is 100% on the product sideheat duty calculation. If Cf is near 1 the temperaturescalculated during the overall heat exchanger train simulationfor the crude side will be more similar to the measured ones,but the fouling factor calculation will be more disperse (seeFig. 16 on Results section). The confidence factor is a userdefined parameter that must be configured for each one ofthe heat exchangers.b. Clean global heat transfer coefficient calculation usingrigorous simulationTo calculate the clean global heat transfer coefficient, arigorous simulation is employed. TASC rigorous simulatoris used for this step, with actual rates and inlet temperaturesgiven as input for each heat exchanger, defining a foulingfactor equal to 0.0. The “clean” outlet temperatures arecalculated and the Uc is reported. It is equivalent to calculatethe individual film heat transfer coefficients for each side ofthe heat exchanger.c. Actual global heat transfer coefficientThe actual global heat transfer coefficient (Ua) neededto exchange the average heat duty estimated in a) iscalculated using the Adjust operation in Hysys and a simplemodel for heat exchangers.d. Fouling factor calculationThe fouling factors for each piece of equipment arecalculated with the actual and clean global heat transfercoefficients determined in b) and c), respectively.Heat Exchanger Fouling and Cleaning – VII, July 1 - 6, 2007, Tomar, Portugal
Effect of cleaning individual heat exchangers on theperformance of the whole trainThe cleaning cases have been pre-programmed inadvance supposing the heat exchangers can be one by oneindividually cleaned, cleaned by pairs or groups or all thetrain simultaneously. The objective is to determine theimpact of cleaning on the inlet temperature of the furnaceand so, on the energy consumption of the unit.The simulation case is the one that includes thecomplete HEN with the values of Ua calculated in step c),except for those heat exchangers that are being cleaned. Inthis cases Uc are used, but this value is not necessarily the Ucorresponding to deep clean condition (Rf 0.0), because thefouling factor after cleaning depends on the cleaningmethod. Even the Uc or Rf values after cleaning can be fixedby the user, and a good reference could be the Ua valueobtained for each equipment after a given cleaningprocedure, calculated from historical data.CASE STUDY: TOPPING IV, LUJÁN DE CUYOREFINERYThe methodology developed in this project was appliedto the particular case of Topping IV CDU at REPSOL YPFLuján de Cuyo Refinery. This Unit has an 18 heatexchangers train used to preheat the crude before the feedfurnace. The process diagram of the HEN is shown in Fig. 4,5 and 6.The white triangles represent existing ratemeasurements, and the yellow ones are temperaturemeasures.Heat exchangers previous to desalter: CE-3AB (crude / LGO from LGO stripper, two shellsin series, simulated together because there is notintermediate temperature measurement on crude side)Between desalter and pre-flash column:Fig. 5 CE-4 (desalted crude / HGO PA, two shells in series,simulated together because there are not intermediatetemperature measurements, it is called CE-4AB). CE-5D / CE-5C / CE-5B / CE-5A (desalted crude /VHGO, four shells in series, simulated measurements on both sides, crude and product)Between preflash column (flashed crude) and furnace:Fig. 6 CE-6E / CE-6D (two shells in series, flashed crude /asphalt, simulated individually because there areintermediate temperature measurements on both sides) CE-6BC (flashed crude / asphalt, two shells in series,simulated together because there is not intermediatetemperature measurement on product side) CE-6A (flashed crude / asphalt)In all cases there are redundant temperaturemeasurements, the average was assumed.Several views of the Hysys model developed for thiscase study are presented:Fig. 4 CE-34 (crude / LGO from CE-3B) CE-2B / CE-2A (crude - kerosene PA, two shells inseries, simulated individually because there areintermediate temperature measurements on both sides,crude and product) CE-35 (crude / VLGO PA) CE-1 (crude / kerosene product)In the first line simple heaters / coolers are used tocalculate the duty exchanged on both sides of each heatexchanger.Heat Exchanger Fouling and Cleaning – VII, July 1 - 6, 2007, Tomar, Portugal
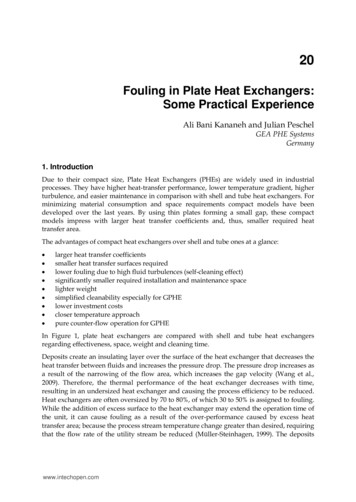
In line #2 there is rigorous simulation models callingTASC, to calculate the Uc under actual operation conditions.In line #3, the Ua needed to exchange the actual duty iscalculated using the available Adjust operations in Hysys.Finally, line #4, where overall HEN is simulated, isused to evaluate the impact of cleaning cases on the inletfurnace temperature.Steady state detectionFor a tags collection list (approximately 70 existing tagsin PI) chosen from the Topping IV diagram, data wascollected once a minute since January 2005 up to January2007. Raw data was inspected and analyzed in order todetermine an appropriate period of time in which maximum,minimum, range, average and stability could be calculatedproperly (e.g., 120 minutes).Fig. 7 shows an example corresponding to two days ofApril, 2005, data collection period for the CE-1 heatexchanger. Red vertical lines show periods of detectedsteadiness.Grey bands in Fig. 7 show the 120 minutes intervalswhere steadiness for a particular heat exchanger wasdetected. It could be seen that data was stable during thoseperiods (more or less horizontal flat lines) while unstablezones did not fulfilled the detection criteria.Fig. 7In Fig. 8 two months of data (June / July, 2005) areshown for all of the CE-6E heat exchanger tags. Verticallines show stable operation periods. As it could be noticed, abig variables values variation is produced during theconsidered period. There is a region where steady pointswere not detected, approximately in the first third of theabove mentioned period; it could be noted by the verticallines and grey zones absence.Fig. 9 shows a detailed portion of Fig. 8, correspondingto the final third of the 2 months period initially presented.Simultaneous steadiness periods of 1 hour have beenhighlighted. For the overall explored period, all the variablesaverages to be used in the Rf calculation for this heatexchanger were calculated. It could be noticed that themethodology used, based in the range of each variable, wasable to detect periods where the curves are flat (steady) anddiscard others where the curves have notorious variations.Heat Exchanger Fouling and Cleaning – VII, July 1 - 6, 2007, Tomar, Portugal
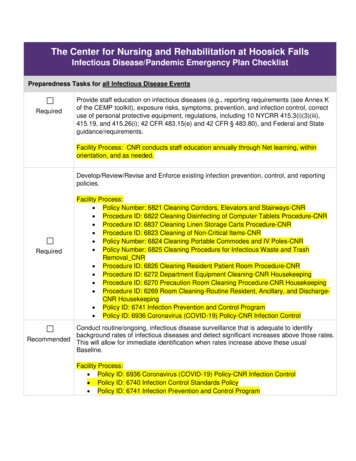
RESULTSThe results obtained by the methodology application tothe Case Study are the following.Fouling Factors calculation with “stable” dataFig. 8An ad-hoc calculation procedure was developed toinspect all the sampled data and find the steady periods. Thesteadiness for all the variables related to a given heatexchanger was simultaneously searched. The range (i.e.,maximum minus minimum value) of a given moving backhorizon time period was inspected. A given tolerance wasdefined for each tag or variable. Once all the variables(typically, 2 flow-rates and 4 temperatures per heatexchanger) were found to be stable, the proper averagevalue is calculated at a fraction of the assumed movingperiod. For a Crude Unit, 120 minutes period was usedbecause such a period is approximately the time needed toreach steady state after a disturbance.As an example, in Fig. 10 can be shown the calculatedfouling factors for CE-2B heat exchanger during March /August, 2006 period. Black squares correspond to constant,equally spaced data, every 23 hrs, without stabilityestimation. White squares correspond to calculationsperformed during steady periods detected with the abovedescribed methodology. It can be clearly seen the non-steadysamples calculated points (black squares) are much moredisperse that the others. Encircled are the calculated pointswith the higher and notorious differences with respect to thestable (steady) periods. In this particular heat exchanger, theuse of stability considerations to search the steady datasamples helps to calculate smoother and coherent foulingfactors.Fouling Factor for CE-2B Heat -03Stable Samples2,1E-03Equally Spaced SamplesFig. -0620-Apr-0630-Apr-06DateFig. 10Similarly, on a long term plot, as presented in Fig. 11for the heat exchanger CE-5A, the fouling factors calculatedunder a period of more than one year using stable samplesHeat Exchanger Fouling and Cleaning – VII, July 1 - 6, 2007, Tomar, Portugal
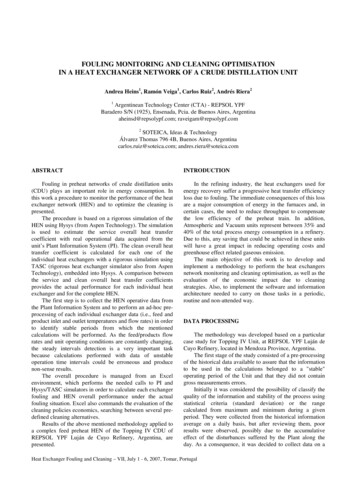
do not show noise. The calculations using equally spacedsamples show noise and a bigger dispersion.Fouling Factor for CE-4AB Heat Exchanger3,4E-022,9E-02Fouling Factor for CE-5A Heat ExchangerCleaningperiod2,4E-02Equally Spaced SamplesRf3,6E-031,9E-023,1E-03Stable -0610-Oct-06Date6,0E-041,0E-0425-Oct-05Fig. Oct-0619-Dec-06Fouling factors based on Uc calculated with actualprocess conditions versus Uc constant design valueDateFig. 11Impact of cleaning on fouling factorIn the next figures, the effect of a chemical cleaning onHeat Exchangers CE-5C and CE-5D is shown. The effect ofsuch a cleaning was clearly captured by our proposedmethodology. It is interesting to note how much smootherboth plots are after the cleaning, especially for heatexchanger CE-5C, whose plot was noisy in the time periodprevious to the cleaning.Also, Fig. 13 shows the effect of cleaning on CE-4AB.Fouling Factor for CE-5C and CE-5D Heat Exchangers2,0E-021,8E-02Rf 08 CE-5D 23h1,6E-02Rf 09 CE-5C 23hTo produce a trend for the heat exchangers foulingfactors involves usually the calculation of the actual globalheat transfer coefficients (Ua) over time and comparing themwith the design clean heat transfer coefficient (Uc). This Ucshould only be valid for process conditions similar to thoseof design, but not for others. Under our methodology,however, Uc is not supposed to remain constant but updatedbased on the current process conditions (feed rates and inlettemperatures).Comparison between fouling factors calculated with aconstant overall heat transfer coefficient (black squares)versus our methodology (white squares) is shown in Fig. 14,where some periods of time with very different noise andvariability of both trends can be seen (Periods 1 and 2).Fouling Factor for CE-6A Heat Exchanger1,4E-02Period 2Period -Jan-0702-Feb-07Rf based on Uc calculated under present conditionsRf based on design UcMoving average - Rf based on design UcMoving average - Rf based on Uc calculated under present conditionsDate3,0E-03Fig. y-0602-Jun-0602-Jul-06DateFig. 14Also, moving averages smoothing trends have been plotted(continuous lines). It can be shown how smoother the plot ofour proposed calculation methodology is against the one thatuses a “fixed nominal” global heat transfer coefficient tocompute the fouling factor. During Period 1, the statisticalvariance of fouling calculated by the traditional method wasHeat Exchanger Fouling and Cleaning – VII, July 1 - 6, 2007, Tomar, Portugal
10 times higher than the variance of our proposedcalculation. During period 2 it was 4 times higher.Similar smoothness curves can be see for exchangerCE-6BC, as shown in Fig. 15 (note the smoother averagingcurves for our proposed calculation methodology).Fouling Factor for CE-6BC Heat Exchanger5,0E-03Rf based on Uc calculated under present conditionsRf based on design Uc4,5E-03Moving average - Rf based on Uc calculated under present conditionsfrom one piece of equipment to the other, perhaps giving, atthe end of the train, as a result of accumulated effects, a bigerror on the furnace inlet temperature calculation. As one ofthe main objectives of this work is to predict heatexchangers cleaning influence on the furnace inlettemperature, seems to be a good practice to use confidencefactors between 0.5 and 1.0, preferably close to 1.0 (i.e.,more confidence on crude side temperatures). Choosing theconfidence factor close to 1.0 will tend to minimize thefurnace inlet temperature calculation mismatch.Moving average - Rf based on design c-0629-Dec-06DateFig. 15Fouling Factor calculation with different ConfidenceFactorsEvery heat exchanger can be provided with aconfidence factor as a configuration parameter as part of theproposed calculation methodology. This value is used toevaluate the overall heat duty based on the individuallycalculated duties for both sides of the equipment (shell andtubes). Several calculations over the analyzed period weremade to evaluate the confidence factor influence on thefouling factor (Rf) calculation, concluding that calculationdispersion is lower when confidence factor is nearest to0.50. Dispersion was evaluated based on the global transfercoefficient standard deviation.A methodology within an industrial, practicalapplication framework, as opposite to an academictheoretical treatment, was developed. The calculationmethodology and procedures used both already availablecommercial standard software and several pieces of ad-hocprogrammed routines. In particular, REPSOL YPF hascorporate network licenses of the commercial software usedand no extra cost in licenses was incurred.Processing a good portion of the historic data alreadystored in the plant information system provided a goodrepresentation of the HEN fouling factors evolution duringtime and the historical cleaning procedures and effects werevery well identified.Performing the calculations with data from stable,steady periods, generated less disperse and more coherentresults, minimizing the impact of process instability on thecalculated fouling factors.The data and results for individual heat exchangers mustbe analyzed particularly for each case, with engineeringcriteria, to determine the confidence factor that better fitseach exchanger.The proposed methodology of calculating the Uc fromactual process conditions, instead of using an Uc designvalue, generates fouling factors curves with no variationsdue to changes in unit operation (rates and temperaturesdifferent from design).To have confidence calculations for fouling factorsallows the user to simulate the complete HEN underdifferent cleaning scenarios in order to choose the one withmajor economic benefit.FURTHER WORKFig. 16Due to real time data uncertainties, duty calculateddifferences will result in a mismatch between calculatedtemperatures and actual process data. The error propagatesFuture work will try to find a practical way to predictfouling factors trends over time using the historicallycalculated data. This prediction would be used to analyzedifferent future cleaning scenarios, anticipate the need ofcleanings and evaluate their economic impact.Heat Exchanger Fouling and Cleaning – VII, July 1 - 6, 2007, Tomar, Portugal
NOMENCLATURECfHGOLGOPAQRfUVLGOConfidence factorHeavy Gas OilLight Gas OilPump AroundDutyFouling factorGlobal heat transfer coefficientVacuum Light Gas OilSubscriptccleanaactualREFERENCESF. dos Santos Liporace and S. Gregório de Oliveira,2005, June 5 – 10, Real time fouling diagnosis and heatexchanger performance, ECI Symposium Series, VolumeRP2: Proceedings of 6th International Conference on HeatExchanger Fouling and Cleaning, Kloster Irsee, Germany.H. Rodera, D.L. Westphalen, H.K. Shethna, 2003, Amethodology for improving heat exchanger networkoperation, Applied Thermal Engineering 23.P.C. Tonin, C.O. Negrão, L.G. Lima, 2003, Anapproach for monitoring the thermal performance of heatexchanger network, Proc. 2º Congresso Brasileiro de P&Dem Petróleo e Gás, Rio de Janeiro, June 2003.L.G. Lima, C.O. Negrão, 2003, The effect ofThermophysical Properties of Work Fluids on the HeatExchanger Effectiveness (in Portuguese), Procedures of theVII Scientific and Technological Initiation Seminar ofCEFETPR, pp. 180-183, 13-15/Aug, Curitiba, BrazilD. Palmerio, 2004, Estudio de Performance de un Trende Intercambio de Calor, XIX AADECA, Buenos Aires.Heat Exchanger Fouling and Cleaning – VII, July 1 - 6, 2007, Tomar, Portugal
b. Clean global heat transfer coefficient calculation using rigorous simulation To calculate the clean global heat transfer coefficient, a rigorous simulation is employed. TASC rigorous simulator is used for this step, with actual rates and inlet temperatures given as input for each heat exchanger, defining a fouling factor equal to 0.0.