Transcription
HEIZMX0B 013185755X.QXD5/4/052:39 PMPage 691Quantitative ModuleLinear ProgrammingBModule OutlineREQUIREMENTS OF A LINEARPROGRAMMING PROBLEMDiet Problem ExampleFORMULATING LINEARPROGRAMMING PROBLEMSLabor Scheduling ExampleShader Electronics ExampleGRAPHICAL SOLUTION TO A LINEARPROGRAMMING PROBLEMGraphical Representation of ConstraintsIso-Profit Line Solution MethodCorner-Point Solution MethodSENSITIVITY ANALYSISSensitivity ReportChanges in the Resourcesor Right-Hand-Side ValuesChanges in the Objective FunctionCoefficientSOLVING MINIMIZATION PROBLEMSLINEAR PROGRAMMING APPLICATIONSProduction-Mix ExampleProduction Scheduling ExampleTHE SIMPLEX METHOD OF LPSUMMARYKEY TERMSUSING SOFTWARE TO SOLVE LP PROBLEMSSOLVED PROBLEMSINTERNET AND STUDENT CD-ROM EXERCISESL EARNING O BJECTIVESWhen you complete this module youshould be able toDISCUSSION QUESTIONSACTIVE MODEL EXERCISEPROBLEMSINTERNET HOMEWORK PROBLEMSIDENTIFY OR DEFINE:Objective functionCASE STUDY: GOLDING LANDSCAPING AND PLANTS, INC.ConstraintsADDITIONAL CASE STUDIESFeasible regionBIBLIOGRAPHYIso-profit/iso-cost methodsCorner-point solutionShadow priceDESCRIBE OR EXPLAIN:How to formulate linear modelsGraphical method of linear programmingHow to interpret sensitivity analysis
HEIZMX0B 013185755X.QXD6925/4/05MODULE B2:40 PMPage 692L I N E A R P RO G R A M M I N GThe storm front closed in quickly on Chicago’s O’Hare Airport, shutting it down without warning. The heavythunderstorms, lightning, and poor visibility sent American Airlines passengers and ground crew scurrying.Because American Airlines uses linear programming (LP) to schedule flights, hotels, crews, and refueling, LP has adirect impact on profitability. As the president of AA’s Decision Technology Group says, “Finding fast solutions toLP problems is essential. If we get a major weather disruption at one of the hubs, such as Dallas or Chicago, then alot of flights may get canceled, which means we have a lot of crews and airplanes in the wrong places. What weneed is a way to put that whole operation back together again.” LP is the tool that helps airlines such as Americanunsnarl and cope with this weather mess.Linear Programming(LP)A mathematicaltechnique designed tohelp operations managersplan and make decisionsrelative to the trade-offsnecessary to allocateresources.Many operations management decisions involve trying to make the most effective use of an organization’s resources. Resources typically include machinery (such as planes, in the case of an airline),labor (such as pilots), money, time, and raw materials (such as jet fuel). These resources may beused to produce products (such as machines, furniture, food, or clothing) or services (such as airlineschedules, advertising policies, or investment decisions). Linear programming (LP) is a widelyused mathematical technique designed to help operations managers plan and make the decisionsnecessary to allocate resources.A few examples of problems in which LP has been successfully applied in operations management are1.2.3.4.5.6.7.8.Scheduling school buses to minimize the total distance traveled when carrying students.Allocating police patrol units to high crime areas to minimize response time to 911calls.Scheduling tellers at banks so that needs are met during each hour of the day whileminimizing the total cost of labor.Selecting the product mix in a factory to make best use of machine- and labor-hours available while maximizing the firm’s profit.Picking blends of raw materials in feed mills to produce finished feed combinations atminimum cost.Determining the distribution system that will minimize total shipping cost from severalwarehouses to various market locations.Developing a production schedule that will satisfy future demands for a firm’s product andat the same time minimize total production and inventory costs.Allocating space for a tenant mix in a new shopping mall so as to maximize revenues to theleasing company. (See the OM in Action box “Using LP to Select Tenants in a ShoppingMall.”)
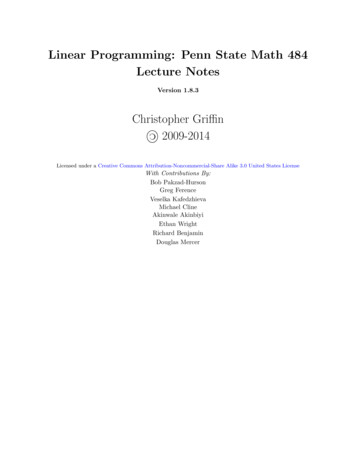
HEIZMX0B 013185755X.QXD5/4/052:40 PMPage 693F O R M U L AT I N GLINEARP RO G R A M M I N G P RO B L E M S693OM IN ACTIONUsing LP to Select Tenantsin a Shopping MallHomart Development Company is one of the largestshopping-center developers in the U.S. When starting anew center, Homart produces a tentative floor plan, or“footprint,” for the mall. This plan outlines sizes, shapes,and spaces for large department stores. Leasing agreements are reached with the two or three major department stores that will become anchor stores in the mall.The anchor stores are able to negotiate highly favorableoccupancy agreements. Homart’s profits come primarilyfrom the rent paid by the nonanchor tenants—the smallerstores that lease space along the aisles of the mall. Thedecision as to allocating space to potential tenants is,therefore, crucial to the success of the investment.The tenant mix describes the desired stores in the mallby their size, general location, and type of merchandiseor service provided. For example, the mix might specifytwo small jewelry stores in a central section of the malland a medium-size shoe store and a large restaurant inone of the side aisles. In the past, Homart developed aplan for tenant mix using “rules of thumb” developedover years of experience in mall development.Now, to improve its bottom line in an increasinglycompetitive marketplace, Homart treats the tenant-mixproblem as an LP model. First, the model assumes thattenants can be classified into categories according tothe type of merchandise or service they provide.Second, the model assumes that for each store type,store sizes can be estimated by distinct category. Forexample, a small jewelry store is said to contain about700 square feet and a large one about 2,200 squarefeet. The tenant-mix model is a powerful tool for enhancing Homart’s mall planning and leasing activities.Sources: Chain Store Age (March 2000): 191–192; Business World (March18, 2002): 1; and Interfaces (March–April 1988): 1–9.REQUIREMENTS OF A LINEAR PROGRAMMING PROBLEMAll LP problems have four properties in common:1.Objective functionA mathematicalexpression in linearprogramming thatmaximizes or minimizessome quantity (oftenprofit or cost, but anygoal may be used).ConstraintsRestrictions that limitthe degree to whicha manager can pursuean objective.LP problems seek to maximize or minimize some quantity (usually profit or cost). We referto this property as the objective function of an LP problem. The major objective of a typical firm is to maximize dollar profits in the long run. In the case of a trucking or airline distribution system, the objective might be to minimize shipping costs.2. The presence of restrictions, or constraints, limits the degree to which we can pursue ourobjective. For example, deciding how many units of each product in a firm’s product line tomanufacture is restricted by available labor and machinery. We want, therefore, to maximizeor minimize a quantity (the objective function) subject to limited resources (the constraints).3. There must be alternative courses of action to choose from. For example, if a companyproduces three different products, management may use LP to decide how to allocateamong them its limited production resources (of labor, machinery, and so on). If there wereno alternatives to select from, we would not need LP.4. The objective and constraints in linear programming problems must be expressed in termsof linear equations or inequalities.FORMULATING LINEAR PROGRAMMING PROBLEMSOne of the most common linear programming applications is the product-mix problem. Two or moreproducts are usually produced using limited resources. The company would like to determine howmany units of each product it should produce to maximize overall profit given its limited resources.Let’s look at an example.Active Model B.1This example is furtherillustrated in Activemodel B.1 on theCD-ROM and in theexercise on page 713.Shader Electronics ExampleThe Shader Electronics Company produces two products: (1) the Shader Walkman, a portableCD/DVD player, and (2) the Shader Watch-TV, a wristwatch-size internet-connected color television. The production process for each product is similar in that both require a certain number ofhours of electronic work and a certain number of labor-hours in the assembly department. EachWalkman takes 4 hours of electronic work and 2 hours in the assembly shop. Each Watch-TVrequires 3 hours in electronics and 1 hour in assembly. During the current production period, 240
HEIZMX0B 013185755X.QXD6945/4/05MODULE B2:40 PMPage 694L I N E A R P RO G R A M M I N Ghours of electronic time are available, and 100 hours of assembly department time are available.Each Walkman sold yields a profit of 7; each Watch-TV produced may be sold for a 5 profit.Shader’s problem is to determine the best possible combination of Walkmans and Watch-TVs tomanufacture to reach the maximum profit. This product-mix situation can be formulated as a linearprogramming problem.TABLE B.1 Shader ElectronicsCompany ProblemDataDEPARTMENTElectronicAssemblyProfit per unitHOURS REQUIRED TO PRODUCE 1 UNITWALKMANSWATCH-TVS(X1)(X2)42 7AVAILABLE HOURS THIS WEEK31 5240100We begin by summarizing the information needed to formulate and solve this problem (seeTable B.1). Further, let’s introduce some simple notation for use in the objective function and constraints. LetWe name the decisionvariables X1 and X2 herebut point out that anynotation (such as WM andWT) would be fine as well.X1 number of Walkmans to be producedX2 number of Watch-TVs to be producedNow we can create the LP objective function in terms of X1 and X2:Maximize profit 7X1 5X2Our next step is to develop mathematical relationships to describe the two constraints in this problem. One general relationship is that the amount of a resource used is to be less than or equal to ( )the amount of resource available.First constraint: Electronic time used is Electronic time available.4X1 3X2 240 (hours of electronic time)Second constraint: Assembly time used is Assembly time available.2X1 1X2 100 (hours of assembly time)Both these constraints represent production capacity restrictions and, of course, affect the totalprofit. For example, Shader Electronics cannot produce 70 Walkmans during the production periodbecause if X1 70, both constraints will be violated. It also cannot make X1 50 Walkmans andX2 10 Watch-TVs. This constraint brings out another important aspect of linear programming; thatis, certain interactions will exist between variables. The more units of one product that a firm produces, the fewer it can make of other products.GRAPHICAL SOLUTION TO A LINEARPROGRAMMING PROBLEMGraphical solutionapproachA means of plotting asolution to a two-variableproblem on a graph.The easiest way to solve a small LP problem such as that of the Shader Electronics Company is thegraphical solution approach. The graphical procedure can be used only when there are twodecision variables (such as number of Walkmans to produce, X1, and number of Watch-TVs to produce, X2). When there are more than two variables, it is not possible to plot the solution on a twodimensional graph; we then must turn to more complex approaches described later in this module.Graphical Representation of ConstraintsDecision variablesChoices available to adecision maker.To find the optimal solution to a linear programming problem, we must first identify a set, orregion, of feasible solutions. The first step in doing so is to plot the problem’s constraints on agraph.
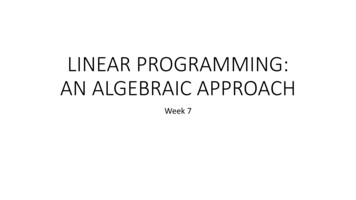
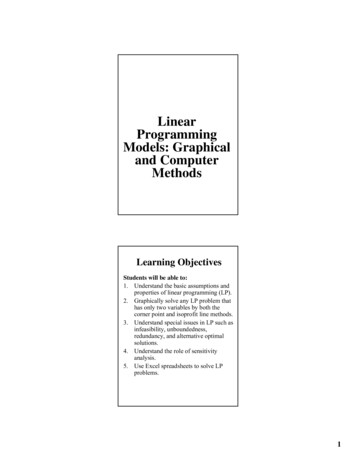
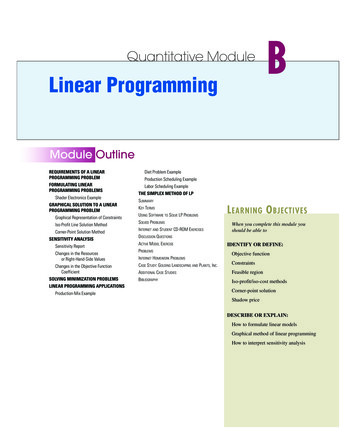
HEIZMX0B 013185755X.QXD5/4/052:40 PMPage 695GRAPHICAL SOLUTIONTO AL I N E A R P RO G R A M M I N G P RO B L E M695The variable X1 (Walkmans, in our example) is usually plotted as the horizontal axis of the graph, andthe variable X2 (Watch-TVs) is plotted as the vertical axis. The complete problem may be restated as:Maximize profit 7X1 5X2Subject to the constraints4 X1 3 X2 240 (electronics constraint )2 X1 1X2 100 ( assembly constraint )These two constraints arealso called thenonnegativity constraints.X1 0 (number of Walkmans produced is greater than or equal to 0)X2 0 (number of Watch-TVs produced is greater than or equal to 0)The first step in graphing the constraints of the problem is to convert the constraint inequalities intoequalities (or equations).Feasible regionThe set of all feasiblecombinations of decisionvariables.Constraint A:4X1 3X2 240Constraint B:2X1 1X2 100The equation for constraint A is plotted in Figure B.1 and for constraint B in Figure B.2.To plot the line in Figure B.1, all we need to do is to find the points at which the line 4X1 3X2 240intersects the X1 and X2 axes. When X1 0 (the location where the line touches the X2 axis), it impliesthat 3X2 240 and that X2 80. Likewise, when X2 0, we see that 4X1 240 and that X1 60. Thus,constraint A is bounded by the line running from (X1 0, X2 80) to (X1 60, X2 0). The shaded arearepresents all points that satisfy the original inequality.Constraint B is illustrated similarly in Figure B.2. When X1 0, then X2 100; and when X2 0,then X1 50. Constraint B, then, is bounded by the line between (X1 0, X2 100) and (X1 50,X2 0). The shaded area represents the original inequality.Figure B.3 shows both constraints together. The shaded region is the part that satisfies bothrestrictions. The shaded region in Figure B.3 is called the area of feasible solutions, or simplythe feasible region. This region must satisfy all conditions specified by the program’s constraints and is thus the region where all constraints overlap. Any point in the region would be afeasible solution to the Shader Electronics Company problem. Any point outside the shaded areawould represent an infeasible solution. Hence, it would be feasible to manufacture 30 WalkmansX2X2100100( X1 0, X2 100)Number of Watch-TVsNumber of Watch-TVs( X1 0, X2 80)806
A few examples of problems in which LP has been successfully applied in operations manage-ment are 1. . Developing a production schedule that will satisfy future demands for a firm’s product and at the same time minimize total production and inventory costs. 8. Allocating space for a tenant mix in a new shopping mall so as to maximize revenues to the leasing company. (See the OM in Action .