Transcription
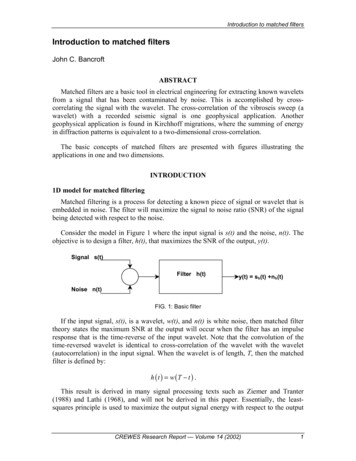
Introduction to matched filtersIntroduction to matched filtersJohn C. BancroftABSTRACTMatched filters are a basic tool in electrical engineering for extracting known waveletsfrom a signal that has been contaminated by noise. This is accomplished by crosscorrelating the signal with the wavelet. The cross-correlation of the vibroseis sweep (awavelet) with a recorded seismic signal is one geophysical application. Anothergeophysical application is found in Kirchhoff migrations, where the summing of energyin diffraction patterns is equivalent to a two-dimensional cross-correlation.The basic concepts of matched filters are presented with figures illustrating theapplications in one and two dimensions.INTRODUCTION1D model for matched filteringMatched filtering is a process for detecting a known piece of signal or wavelet that isembedded in noise. The filter will maximize the signal to noise ratio (SNR) of the signalbeing detected with respect to the noise.Consider the model in Figure 1 where the input signal is s(t) and the noise, n(t). Theobjective is to design a filter, h(t), that maximizes the SNR of the output, y(t).Signal s(t)Filter h(t)y(t) sh(t) nh(t)Noise n(t)FIG. 1: Basic filterIf the input signal, s(t), is a wavelet, w(t), and n(t) is white noise, then matched filtertheory states the maximum SNR at the output will occur when the filter has an impulseresponse that is the time-reverse of the input wavelet. Note that the convolution of thetime-reversed wavelet is identical to cross-correlation of the wavelet with the wavelet(autocorrelation) in the input signal. When the wavelet is of length, T, then the matchedfilter is defined by:h ( t ) w (T t ) .This result is derived in many signal processing texts such as Ziemer and Tranter(1988) and Lathi (1968), and will not be derived in this paper. Essentially, the leastsquares principle is used to maximize the output signal energy with respect to the outputCREWES Research Report — Volume 14 (2002)1
Bancroftnoise energy. The matched filter improves the SNR by reducing the noise’s spectralbandwidth to that of the wavelet, and in addition, reduces the noise within the wavelet’sbandwidth by the shape of the wavelet’s spectrum.The duration of the wavelet can be small, as used in radar or sonar, and it can be muchlarger when used with the vibroseis source with the acquisition of seismic data. Otherapplications may involve the detection of weak signals from satellite transmissions, or thedetection of military equipment from visual images. In addition, Kirchhoff migration is aform of 2D or 3D matched filtering that estimates the location, size, and shape ofscattered or diffraction energy.EXAMPLESExample with a short waveletThe first example is a short wavelet added to noisy traces. In this situation, the signalto-noise ratio (SNR) is defined by taking the peak amplitude of the wavelet and dividingit by the root-mean-squared (RMS) measure of the noise (standard deviation).Various amplitudes of the wavelet in Figure 2 are added to ten noisy traces and areillustrated in Figure 3. The SNR of these traces varies from 2.0 at the top to 0.2 at thebottom as indicated on the left side of the figure.FIG. 2: Wavelet, only first 100 ms (50 points) used.The cross-correlation of the known wavelet in Figure 2 with the traces in Figure 3produces the corresponding matched-filter traces in Figure 4. Note the improved SNR ofthe traces, and that even the bottom trace with an initial SNR of 0.2 demonstrates a higherprobability of detection.2CREWES Research Report — Volume 14 (2002)
Introduction to matched filtersSNR211/3½2/51/32/7¼2/91/5FIG. 3: Ten noisy traces and wavelets with a SNR that varies from 2.0 to 0.2.FIG. 4: Results of a matched filter from cross-correlating the wavelet in Figure 2 with the noisysignals in Figure 3,CREWES Research Report — Volume 14 (2002)3
BancroftFigure 4 illustrated the attenuation of the noise and the preservation of the waveletenergy. The shape of the wavelet, however, has been modified to zero-phase,corresponding to the cross-correlation of the wavelets being an auto-correlation. The peakof the zero-phase wavelet identifies the beginning of the initial wavelet.Example with a longer chirp waveletThe above experiment is repeated with a chirp wavelet shown in Figure 5 and thenoisy signals in Figure 6. This wavelet is longer and contains higher frequencies than theshort wavelet. These higher frequencies also define the shape of the matched filter andwill allow higher frequencies of the noise to pass as observed in the matched-filter resultin Figure 7.FIG. 5: Chirp wavelet.FIG. 6: Noisy traces and chirp wavelet.4CREWES Research Report — Volume 14 (2002)
Introduction to matched filtersFIG. 7: Match-filtered result of the noisy chirps.With a larger energy wavelet, there is more energy in the cross-correlation, and betterdetection. Note that the input SNRs was the same as in the shorter wavelet example.2D dataThe same principles apply to detecting a 2D wavelet in a 2D signal. Such applicationsare used to detect potential military equipment in video or optical images. In geophysics,it can be used to detect seismic diffractions in a process we know as seismic migration.Note that the matched filter concept tells us that we need to cross-correlate with the samesize and amplitude of the “object” being detected.Consider the noisy section, the 2D wavelet, and the matched filter result in Figure 8.The noisy section in (a) has 100 by 100 samples, and contains one barely detectablewavelet. The wavelet in (b) has 21 by 21 samples and is much narrower when insertedinto the grid of the noisy section. The cross-correlation in (c) shows a significantimprovement in the matched filter result.CREWES Research Report — Volume 14 (2002)5
Bancrofta)b)c)FIG. 8: Example of 2D matched filtering with a) the noisy section containing the wavelet and b)matched filter.6CREWES Research Report — Volume 14 (2002)
Introduction to matched filtersCOMMENTSIn the cross-correlation process, the amplitudes of the input wavelets or events aresquared and will represent some form of energy.Seismic migration is similar to the detection process. Both processes try to collapsethe energy in a diffraction to the smallest possible point with the highest energy.In migration, the diffraction stack algorithm cross-correlates a time and spatiallyvarying diffraction with a seismic section. For maximum detection, the Kirchhoffoperator should match the shape and amplitude of the diffractions in the section. Notethat the amplitudes on the migrated section would now represent the energy, and in theexploding reflector model, the energy is proportional to the reflectivity of the interfaces.This heuristic or ad hoc approach to migration coincides with the Kirchhoff integralsolution to the wave equation.The reflectivity coefficients vary with the angles of incidence, reflection andtransmission. The inclusion of these amplitude factors in the weighting of the summationdiffraction can improve the signal-to-noise ratio of specific targets in the migratedsection. This has been demonstrated in the migration of P-P Class 2 AVO data and in themigration of converted-wave data (Beckett and Bancroft, 2002).In Class 2 AVO, the reflection coefficient varies from a positive to a negative value,and summing (or stacking) these amplitudes tends to give a very small amplitude, relativeto the surrounding reflectors. Including these amplitude weightings in the prestackmigration operator (the diffraction shape) will boost the amplitude of the Class 2 event,and attenuate the amplitudes of the data with a constant amplitude with offset. Thisfiltering should then aid in the detection of these events.Converted-wave reflection amplitudes tend to zero at zero-offset and increase inmagnitude with offset. In addition, the noise toward zero-offset may be large andcontribute significant noise to the migrated section. Using the matched filter concept tobias the migration operator with the same weighting will tend to attenuate the near zerooffset noise to produce a migrated section with less noise.Authors such as Claerbout (1992), point out that the inclusion of these AVOweightings in prestack migrations will prevent further evaluation of subsequent AVOparameters in any following prestack measurements.CONCLUSIONMatched filters are designed to extract the maximum SNR of a signal that is buried innoise. Some applications in geophysics are in the cross-correlation of vibroseis data, andin Kirchhoff migration.ACKNOWLEDGEMENTSWe acknowledge NSERC and the CREWES sponsors for their continued support.CREWES Research Report — Volume 14 (2002)7
BancroftREFERENCESBeckett, J. and Bancroft, J.C., 2002, Event detection in prestack migration using matched filters, CREWESResearch Report, 14Claerbout, 1992, Earth Soundings Analysis, Blackwell Scientific Publications.Ziemer, R.E., and Tranter, W.H., 1988, Principles of Communications, John Wiley and Sons, pages 465468.8CREWES Research Report — Volume 14 (2002)
1D model for matched filtering Matched filtering is a process for detecting a known piece of signal or wavelet that is embedded in noise. The filter will maximize the signal to noise ratio (SNR) of the signal being detected with respect to the noise. Consider the model in Figure 1 where the input signal is s(t) and the noise, n(t). The