Transcription
OR-94-18-1AIVC 11974OZONE-REMOVAL EFFICIENCIESOF ACTIVATED CARBON FILTERSAFTER MORE THAN THREE YEARSOF CONTINUOUS SERVICECharles J. Weschler, Ph.D.Helen C. ShieldsABSTRACTThis paper evaluates the efficiency with which commer cial charcoal filters remove ozone. Three different applica tions have been examined: a test plenum, an air handlerproviding outside air to a Class JOO clean room, and aplenum downstream of an air handler providing outside airto another Class /()() clean room. After 37 months, thecharcoal in the test plenum has decreased in removalefficiency from 95% to 90%. After 37 months, the charcoalservicing the first clean room has decreased in efficiencyfrom 85% to 60%. After 24 months, the charcoal servicingthe second clean room is still removing 95% of the ozone inthe airstream. The charcoal filters associated with the testplenum and the second clean room are better protected fromsubmicron panicles than those associated with the firstclean room. The accumulation of fine panicles on thecharcoal appears to influence service life. This work is anextension of the preliminary results (20 months of service)thal were reponed for the filters associated with the testplenum and the first clean room (Weschler et al. 1993).INTRODUCTIONGround-level ozone (03) has both acute and chronic.Datta V. Naik, Ph.D.indoor surfaces. At higher air exchange rates, indoor lev1arc an even greater fraction of outdoor levels. If the reco1mcndations presented in ANSJ/ASHRAE 62, Ventilation JAcceptable Indoor Air Quality (ASHRAE 1989), afollowed, high air exchange rates are expected in locatiowhere the occupant densities arc high (e.g., cstaurantransportation waiting areas, etc.). High air exchange ratalso are encountered in buildings that use direct cvaporafrcooling. Indeed, a recent study by Stock and Venso (199reports indoor 03 concentrations that are a large fraction·outdoor levels in such buildings. Additionally. large 2exchange rates arc encountered in facilities that use big;velocity exhaust hoods (e.g.; semiconductor and biotcchnol1gy laboratory buildings).If ozone can be removed from the ventilation air, iipossible to have elevated air c g . a cs wijhout co1comitant elevated indoor/outdoor (/10) ozone ratios. ChacoaJ filters have been advocated for such applicationHowever, there is a scarcity of literature evaluating chacoal's ability to remove ozone from an airstrcam. Althougthere are studies that have measured indoor and outd0 ozone levels in museums that contain carbon filters in theheating, ventilating, and air-conditioning (HVAC) systcrrhealth effects (Lippmann 1989). lt also can contribute to the(Cass ct al. 1988), the authors know of only one cxtcnshdamage of sensitive materials, including cultwal artifacts(Shaver ct al. 1983) and electronic equipment (ISA 1985).study explicitly designed to measure the ability of charcoiThe National Ambient Air Quality Standard (NAAQS) forto remove ozone from ventilation air (Shair 1981). Sineozone is 120 parts per billion (ppb). In 1989, 67 millioncharcoal filters for the removal of 03 in buildings witMay 1990, the authors have been evaluating commcrcicpeople lived in areas that exceeded this standard (NRCmechanical ventilation systems. This paper updates rcsull1992). These figures reflect the fact that most majorpresented in Weschler ct al. (1993). In that paper. measuremetropolitan regions in the continental United States exceedremoval efficiencies were reported for ozone (and othethe NAAQS.pollutants) for a test plenum and an actual facility employIndoor settings offer some protection from outdooring charcoal filtration. Those results covered the first 21ozone, but the amount of protection decreases with increas months of charcoal use. In this paper, ozonc-rcm lv2ing air exchange rates. lndoor 03 concentrations approach50% of outdoor levels at air exchange rates on the order ofefficiencies are presented for the same filters after they havthree to four air changes per hour (ACH) (Wcschlcr ct al.been in continuous use for more than 37 months. Results ari1989), depending on the rate at which 03 is scavenged bycharcoal filters have been in use for 24 months.Charles J.also presented for an additional test site-a facility whcriWeschler is a distinguished member of the professional staff and Helen C. Shields is a member of the technical staffBcUcorc, Red Banlt, NJ. Datta V. Naik is a professe1o1 f chemistry at Monmouth College, West Long Branch, NJ.ASHRAE Transactions: Symposiaa1121
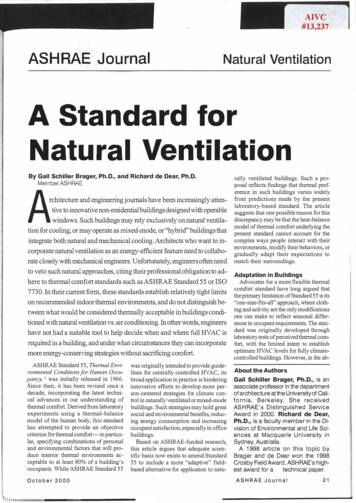
, ,'II'!It '.EXPERIMENTALTest PlenumThe test plenum is approximately 7.5 ft (2.3 m) long.The first five feet ( 1.5 m) arc rectangular (24 in. by 12 in.inner diameter [i.d.]). The next foot is cylindrical, taperingfrom the rectangular section to the final section, which is1.5 ft (.46 m) long and 14 in. (.36 m) in diameter. Theaverage airflow through the plenum is 600 cfm (0.28 m3/s).The plenum contains 30% particulate filters, followed by85% filters (ASHRAE dust-spot rating, ANSI/ASHRAE 52. 11992 [ASHRAE 1992]). Downstream of the particulatefilters is a "half' filter cell that contains six individualcarbon panels arranged in a zig-zag configuration within the24-in. by 12-in. housing. Each panel (24 in. by 29 in. by 1in.) holds 7.5 lb (3.4 kg) of virgin coconut shell activatedcarbon ( 4 x 8 mesh) rated at 60% wt carbon tetrachlorideactivity (ASTM 3467-89). The test duct was initiallyoperated with and without charcoal filters. Since mid-August1990, the charcoaJ filters se.rvicing the test plenum havebeen in continuous use. Ozone concentrations have beenmeasured upstream (at the intake of the test duct) anddownstream (two inches beyond the charcoal filters).Upstream of the test plenum, an ozone generator and asmall mixing fan were used to occasionally elevate ozoneconcentrations above ambient levels. Ambient indoor ozone,with no deliberate additions, also has been used to evaluatethe removal efficiencies.Clean Room #1Clean room #1, a Class 100 device-fabrication facility,is located at an office-laboratory complex in Red Bank,New Jersey, approximately 27 air-miles from Manhattan and6.5 air-miles west of the Atlantic Ocean. This clean room22has a floor area of 4,543 ft (423 m ), and indoor air is ex changed with outdoor air at a rate of 30 air changes perhour (ACH). Following the initial benchtop studies, 24"half' filter cells (each containing 45 lb [20 kg] of activatedcarbon) were installed in the air-handling unit servicingclean room #I. This air-handling unit treats only outside air;no recirculated air passes through the unit. The airflowthrough this unit is 2 1,700 cfm ( 10.2 m 3/s). Filters withASHRAE dust-spot ratings of 30% were installed upstreamof the carbon filters, and filters with a- rating of 85% wereinstalled downstream of the carbon filters. The installationoccurred on July 20, 1990. In the course of this study, 03concentrations were simultaneously monitored inside cleanroom #1 and outdoors.Clean Room #2Clean room #2, a Class 100 lithography facility, islocated within the same office-laboratory complex as cleanroom # l . It is significantly smaller than the olJi'cr facility,112222with a floor area of 352 ft (33 m ). The air exchange rateis high, 64 ACH, reflecting the use of high-velocity exhausthoods in a relatively small room. In September 1991, two"full" filter cells (each containing 90 lb [4 I kg] of activatedcarbon) were installed in the plenum that provides outdoorair to this facility. The volwn lric flow rate through these3filters is 3,000 cfm ( 1.4 m /s). Filters with an ASHRAEdust-spot rating of 30%, followed by filters with a rating of85%, as well as cooling coils, arc located upstream of thecarbon filters. 03 concentrations were measured a fewinches upstream and downstream of the charcoal filters.Ozone MeasurementsThe sampling details for ozone have been presentedelsewhere (Weschlcr et al. 1989). In brief, ozone concentra tions were measured with ultraviolet (UV) photometricanaly:zcrs (wavelength: 254 nm; range: 0 to 500 ppb;precision: 1% or 1 ppb, whichever is greater). For theinitial plenum studies, conducted in 1990, separate instru ments were used for upstream and downstream 03 measure ments. Separate instruments also were used for the indoorand outdoor measurements associated with clean room #1.In each case, the instruments were interfaced to personalcomputers; data were collected at one-minute intervals andstored on magnetic media. In addition to the raw data, theaverage and standard deviations of the previous 30 readings(half-minute intervals) were recorded every 15 minutes. Forthe upstream-downstream plenum measurements made in1993 and the analogous measurements made for the charcoalfilters servicing clean room #2, a single instrument w used. This instrument was interfaced to a computer and 2three-port solenoid valve; the latter was used to altcmatfsampling between upstream and downstream on a 15-minuttcycle. At the start of each downstream or upstream cyclethe sampling line was purged for IO minutes, 03 value were then read at 30-second intervals for the next 5 minutesand, finally, the average of the IO readings was recorded.RESULTSBenchtop StudiesWhen commercial charcoal filters were initially installoin the plenum (May 1990), their measured removal efficicncy for 03 was 95% (Wcschlcr ct al. 1993). For challengconcentrations varying from 20 to 300 ppb, this rcmov efficiency was independent of 03 concentration. After twyears of service, the removal efficiency had declined onlslightly, to 92%. After more than three years of service,.difilters were still quite effective. Figure 1a shows upstreaJand downstream ozone concentrations for the week of Jul9, 1993. Figure lb shows ozone-removal efficiencies vcrstupstream ozone concentrations for the period from Julythrough July 22, I 993. The removal efficiencies arc caJculaed as (1 - [D/V]), where D is the downstream 03 concc1ASHRAE Transactions: Symposi
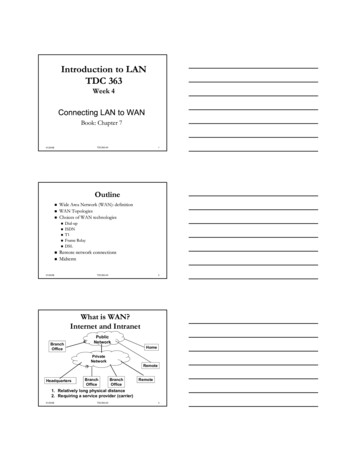
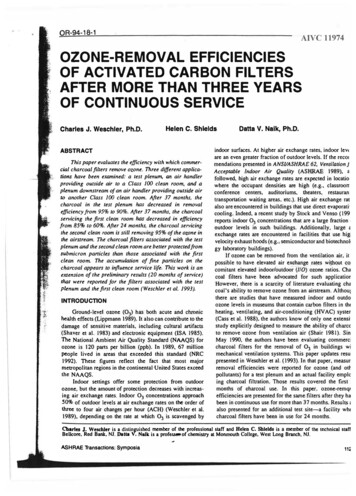
installation of the charcoal filters. At this time, indoorUpstream Downstream40levels were a significant fraction of the outdoor lev1reflecting the large air exchange rate {outdoor air) at tfacility. Figure 2b shows indoor and outdoor o3 concen1tions for the week of August I, 1990, just after the instaltion of the charcoal tilters. The indoor 03 levels were n1only a small fraction of the outdoor values, indicating dthe charcoal filters were removing a large amount of thecontained in the ventilation air. Figure 2c shows indoor aoutdoor 03 concentrations for the week of August :1993-more than three years after the installation of 1charcoal filters. It is apparent that the indoor levels10(a)100%i - c::Q)·o!Ew«iE Q)a::111312July, 1993w. 80%'! .- · ···-ozone-removal efficiency of the charcoal filters at tilocation has declined. Figure 3 shows indoor o3 concentitions divided by the concurrent outdoor 03 conccntratio(110) versus the outdoor 03 concentration for four separ.periods. The first period is July 1990, prior to the instalti on of the charcoal filters; the second is August 1 shortly after charcoal installation; the third is August 1 13 months after charcoal installation; and the fourth60%August 1 993, 37 months after charcoal installation. (/,values are only plotted for those periods when the outdo40%concentration is relatively constant; hence, the y-axislabeled "steady-state 110.") The plots in Figure 3 iUustrithat the 110 value for a given period is relatively consta20%over a large range of outdoor ozone concentrations (from :0% --'- --'- 50403020100Upstream Ozone ConcentrationJuly 2 - July 22, 1993(b)Figure 11closer to the outdoor levels than they were in 1 990; IEvaluation of charcoal filters contained in thetest plenum. Results shown are after 37nwnths of continuous use. (a) Upstream anddownstream ozone concentrations (ppb). (b)Removal efficiencies (I - [D/U]) versus up stream ozone concentrations.to 120 ppb). Prior to charcoal installation, the 110 ratio ha median value of 0.67 (the open circles in Figure 3). JLafter charcoal installation, the 110 ratio has decreasedramatically; the median value is 0. 1 2 (the solid circlesFigure 3). Thirteen months after charcoal installation, ti110 ratio has a median value of 0.1 2 (the asterisks in Figu3). Thirty-seven months after charcoal installation, the IIratio has a median value of 0.32 (the squares in Figure :iThe superposition of the data points for the second and thi:periods (solid circles and asterisks) indicates that there w:no detectable decrease in filter efficiency during the first Imonths of charcoal use. However, the subsequent increa:in the 110 ratio to 0.32, after 37 months of service, indicat1tration and U is the upstream 03 concentration. Onlymoderatelyintervals when the upstream concentrations arc not orquickly and that arc greater than 10 ppb are plotted. InFigures I a and 1b, the upstream concentrations arc simplyClean Room #2 Studiesthe existing indoor ozone levels at the time of measurement.(The indoor ozone concentrations at the plenum location areIn September 1991, charcoal filtration was provided f a significant fraction of those outd ?Ors [Wcschlcr ct al.a second clean room at the office-laboratory complex. Tt1 989).) The median removal efficiency in Figure 1 b is closecharcoal filters servicing this site were situated in suchto 90%. Hence, over a period of more than three years ofway that 03 concentrations could be monitored immediate!charcoal in the plenum has declined from 95% to 90%.benchtop experiments incorporating the test plenum. Thiscontinuous operation, the ozone-removal efficiency of theupstream and downstream of the filters, similar to tl:a more direct measurement of filter removal efficicncicClean Room #1 StudiesFigure 2a shows indoor and outdoor 03 concentrationsfor the week of July 3, 1 990, in clean room #1 -prior to theASHRAE Transactions: Symposiathan trying to calculate removal efficiencies from //1values. Due to instrument constraints, the first measuremen1at this site were not made until August 1 993. Figure 4shows upstream and downstream 03 concentrations for th112
JULY 'IOAIJO 'IOAUG 'ItAUG '13NO OIARCXW. C WIC W. OWICOAI. OWICOAI.Outdgor Cleanroom #1'j140.----,---,1i' 1200.E; 100,g 80c:ecg0(.)'"'6040200345678910010July, 1990Figure 3(a)Steady-state indoor/outdoor ozone ratiosbefore (O ), immediately after ( ), 13 monthsafter (*), and 37 months after ( ) the charcoalfilters were installed in the air-handling systemfor the clean room. 1i' 100E;80c:0.gcr:60 c:40(.)2000week of September 15, 1993. It is apparent that concen trations downstream are much less than those upstream.Figure 4b shows 03 removal efficiencies versus upstream012345!,·- · .-·-- - ,67August, 1990(b)03 concentrations for the period from September 14 toOctober 5, 1993. (As was done in the benchtop studies, lheplotted points have an upstream concentration greater lhan10 ppb and cover periods when the concentration is notchanging rapidly.) The median value is approximately 95%.Hence, after two years of continuous service, the charcoal160filters servicing clean room #2 are removing 95% of the 03.-------.in the airstream.-140g 120.0DISCUSSIONCalculated 03 Removal Efficienciesfor Clean Room #1c:100 c:80 60§(.)40The charcoal filters servicing clean room #1 are situated20in a location where it would be difficult to directly measure.Q02s26272829303132August, 1993(c)Figure 21124Outdoor (solid line) and indoor (dashed line)ozone concentrations (ppb) measured in cleanroom #1. (a) Shortly before charcoal filterswere installed in the air-handling unit. (b)Shortly after charcoal filters were installed inthe air-handling unit. (c) Thirty-seven monthsafter charcoal filters were installed in the air handling unit.upstream and downstream ozone concentrations. As asubstitute, simultaneous indoor and outdoor 03 concentra tions have been measured for clean room #1. From the ratioof the indoor and outdoor (110) ozone concentrations, it ispossibletocalculatetheremovalefficiencies for thecharcoal servicing this site. The calculations arc accom plished using a one-compartment mass-balance model.Given the operational parameters of the HVAC system thatservices clean room #1 (continuous fan operation, norecirculated air, negligible infiltration of untreated air, andno known indoor sources of 03), the 110 value for 03 under steady-state conditions, is given by110 Ex(l -F1)/(viAIV) E11)(1)ASHRAE Transact ions: Symposia
whereEx F, vJAIV) air exchange rate (in clean room #1, Ex 30h-1, i.e., 30 ACH);fractional efficiency of the carbon filters forthe removal of 0 ; and3rate at which 0 is removed by indoor surfac 3es (the product of the deposition velocity andthe surface-to-volume ratio); in clean room #1,the measured value is 2 x 10⁻³·s-1 or 7.2 h-1(Nazaroff et al. 1993).As outlined in the "Results" section, Figure 3 presentssteady-state 110 values for ozone in clean room #1 fordifferent periods in the service life of the charcoal. Substi tuting these values in Equation 1 yields removal efficiencies,F1, for each of these periods. Immediately after charcoalUpstream Downstream&:040c.gc:30 20c:0(.)1016171819202122September. 1993(a)ij'c:80% ----- 60% ------l.9?lw 40% ------1- ------·20% -------i-- --'----- - 03 01020304050September14Upstream Ozone Concentration- October 5. 1993(b)Figure 4Evaluation of charcoal filters servicing cleanr()()m #2. Results shown are after 24 months ofcontinuous use. (a) Upstream and downstreamozone concentrations (ppb). (b) Removalefficiencies (I - [D/U]) versus upstream ozoneconcentrations.ASHRAE Transactions: Symposiawas installed at this location, the calculated removalefficiency was 85%. After 13 months of service, there hadbeen no detectable change in the removal efficiency; it wasstill 85%. However, in the next 24 months of service, thecalculated removal efficiency declined from 85% to 60%(i.e., after 37 months of continuous service, the removalefficiency was 60% ).Comparisons Among the Three StudiesTable 1 lists the measured and calculated ozone-removalefficiencies, at different times, for the charcoal filters in thetest plenum, as well as the charcoal filters servicing cleanrooms #1 and #2. After 37 months of service, the removalefficiency of the filters in the test plenum has decreasedonly slightly, from 95% to 90%. On the other hand, thefilters servicing clean room #1 have decreased in efficiencyfrom 85% to 60% over a similar 37-month interval. In thecase of clean room #2, the only measured value for theremoval efficiency is after 24 months of service. This value,95%, is equal to that measured in the plenum when thecharcoal filters were first installed. Presumably, the removalefficiency of the filters servicing clean room #2 was closeto 95% immediately following installation (i.e., similar tothose in the test plenum) and the efficiency has not de creased significantly in the intervening two years of continu ous use.In comparing these results, it is important to appreciatevarying factors that may affect the efficiencies and servicelives of the charcoal filters. Table 2 summarizes two suchfactors: the normalized airflow (i.e., the airflow per unitmass of charcoal) and the position of the charcoal filters·r-etative to other elements iri the air-handling system.The normalized airflows vary from 13.3 cfm/lb (0.014m3/s ·kg) of charcoal for the filters in the test plenum, to20.l cfm/lb (0.021 m3/s ·kg) for the filters servicing cleanroom #1, to 16. 7 cfm/lb (0.017 m3 /s ·kg) for the filtersservicing clean room #2. Hence, during the same length ofservice, a pound of charcoal in the air handler for cleanroom #1 is exposed to one-and-a-half times more air than apound of charcoal in the test plenum. This may partiall)explain the observation that the filters servicing clean room#1 have decreased in efficiency faster than those in the tes1plenum. Furthermore, because of the higher flow rate pe1unit mass of charcoal, the amount of time that filtered air i!in contact with the surface of the charcoal is proportionate!)less for clean room #1 compared to the test plenum. Thedecreased contact time, coupled with some filter bypass fo1the 24 "half' filter cells servicing clean room #1, ma)explain the difference in initial removal efficiencies betweerclean room #1 and the test plenum (85% versus 95%).,The position of the charcoal filters relative to th1particulate filters is important since soiling of activateccarbon filters by submicron particles can significantl degrade filter performance (Raber 199 1 ). The air enterin1the test plenum is indoor air that has already passed througl112
TABLE 1'Ozone-Rem oval EfficienciesTime in ServiceTesl Plenum0 months95'1.85\111--85\111-24 months92\111-95\111months90'1.60\111-1337 I;jIIi.I;·II'TABLE 2Normalized Airflow through Charcoal FiltersmonthsC&kulatedClcanroomC leanroomfrom measured indoor/ouldoor ratios using Equation112to PartJculate Filters and Cooling CoilsAirflow/W eicbtPosition of Charcoal Fillersof CharcoalTest PlenumClcanroom#ICleanroom11213.3 cfmllb20.l30'lli, 85 \Iii, charcoalcfmllb30\111, charcoal, 85\111, coolioc coils16.7 cfmllb30\111, 85\111, cooling coils, charcoalI.the building's particulate filters; this air then passes through30% and 85% particulate filters associated with the plenum(see Table 2) before encountering the charcoal. The airentering the air handler for clean room #1 is untreatedoutdoor air and subsequently passes through only 30%particulate filters before encountering the charcoal; thecharcoal filters are located upstream of the 85% filters andthe cooling coils (see Table 2). Hence, the charcoal filtersservicing clean room #1 are continuously exposed to a muchhigher concentration of submicron particles than are thefilters in the test plenum. This. in tum, is also expected tocontribute to a faster degradation in removal efficiencies forthe charcoal servicing clean room #1 compared with that inthe test plenum.In the arrangement for clean room #2, the charcoalfilters arc located near the end of the plenum that deliversoutdoor air to the clean room, downstream of the 30% and85% particulate filters and the cooling coils (sec Table 2).The removal efficiency of the charcoal filters has remainedquite high (95%) after 24 months of service. Presumably,this reflects efficient removal of fine particles upstream ofthe charcoal filters and a lower normalized flow rate thanthat experienced by the fitters in the air handler for cleanroom #1. It will be instructive to monitor the removalefficiency of these same filters after they have been inservice for 37 months.Given that the filters for clean room #2 are downstreamof the cooling coils, the relative humidity of the airstreampassing through these filters tends to be quite high duringthe summer. When the warm, humid summer air is cooledto 58 F (16 C), the relative humidity approaches 100%immediately upstream of the charcoal filters. The effect ofthe elevated humidity on 03 removal efficiency has not beendetermined. However, as will be discussed in a future paper,the elevated humidity is expected to decrease the removalefficiency for volatile organic compounds and increase theremoval efficiency for sulfur dioxide.There is an additional difference among these threecharco8l installations. The filters in the test plenum experi ence a relatively constant temperature (70 F o 74 F)throughout their service life. The filters in the air handler1126and Poaltlon of Charcoal Filters Relativefor clean room #I experience variable outdoor temperatures(-5 F to 100 F). The filters that service clean room #2experience a constant temperature of 58 F since they arcsituated downstream of the cooling coils that condition thesupply air. At present, we do not know if these different (inrelation to temperature) environments measurably influencethe ability of charcoal filters to remove 03.Comparisons with Other StudiesThe authors are aware of only one other extensiveevaluation of charcoal filters for the removal of 03. Thisstudy was conducted by Shair (1981) and used the sametype of commercial charcoal filters employed in the currentstudy. The charcoal filters were installed in an "auxiliaryfiltration system" located upstream of the main ventilationsystem that serviced a laboratory on a university campus inCalifornia. To extend the life of the charcoal filters andconserve energy, outdoor air passed through the auxiliarysystem only when the outdoor ozone concentration exceeded80 ppb; at other times, the outdoor air passed directly intothe main ventilation system. As a result of this arrangement,the charcoal filters were in service for about 1,200 hours peryear.The auxiliary filtration contained nine "full filter cells"of charcoal (810 lb (367 kg)); the airflow through the3charcoal filters was 14.000 cfm (6.5 m ts); hence. the3nonnalized airflow was 17.3 cfmltb (.017 m /s·kg) ofcharcoal. This is less than the nonnalized airflow experi enced by the charcoal servicing clean room # I (20.1 cfm/lb3[.021 m /s·kg)) and close to the nonnalized airflowexperienced by the charcoal servicing clean room #2. Theonly particulate filters upstream of the charcoal filters were30% filters. As previously noted, this arrangement provideslittle protection from soiling by fine-mode particles. In thisregard, the arrangement resembles that for the filtersservicing clean room #I and differs significantly from tha tfor the test plenum or clean room #2 (sec Table 2).The initial 03 removal efficiency measured in Shair'sstudy was 95%. At the end of the first, second, and thirdyears of operation, the removal efficiencies were 95%, 80%.ASHRAE Transactions: Symposia
and 50%, respectively. These values arc similar to thosemeasured for the tilters servicing clean room # 1 (see TableI). In both cases, no significant decrease in performancewas observed during the first year of operation. After threeyears of operation, the relative decrease in removal efficien cy was slightly greater in Shair's study (95% to 50%) thanfor clean room # 1 (85% to 60%).Despite these similarities, there are two importantdifferences between these trials, and each is expected toaffect filter life. First, the charcoal filtration system in theCalifornia laboratory was only operating 1,200 hours peryear, whereas the filtration systems in the current studywere operating 8,760 hours per year. Second, Shair' sfiltration system is located in Pasadena, California; thecurrent system is located in Red Bank, NJ. Compared withRed Bank, Pasadena has much higher airborne concentra tions of fine particles and various organic compounds{especially during the time when Shair's studies wereconducted-1975- 1978). The service life of activatedcharcoal filters is affected by the accumulation of fineparticles, semi-volatile organic compounds, and volatileorganic compounds in the charcoal's pores. (Total exposureto ozone is not expected to have a major effect on filterlife.) These two differences-yearly operating hours andpollutant levels-apparently counteract one another, with thenet result that the observed service lives are comparable.It is significant that in both the California study and theclean room #1 study, the charcoal filters had only marginalprotection from fine particles. In the cases of the testplenum and clean room #2, the additional protection fromfine particles (85% particulate filters) appears to havesignificantly slowed the decline in removal efficiency of thecharcoal filters.Recently, a report was issued that describes the abilityof chemically treated filters to remove o :lonc and other gas phase pollutants (Kelly and Kinkead, 1993). The filtersevaluated were dry processed carbon composite (DPCC)adsorbers "of both the 14 13 and 1073 designations. Theformer incorporate reagents specific for the removal offormaldehyde; the latter incorporate reagents specific for theremoval of sulfur dioxide, nitrogen dioxide and ozone."These filters were arranged in series ( 1073 followed by1413) in a test plenum. During an 80-hour test, the filterswere challenged with a mixture of pollutants, including 03.The upstream 03 concentration averaged 1 18 ppb during the80-hour test. The downstream 03 concentration was notstatistically different from zero. Hence, in this 3.3-day test,the filters demonstrated a high removal efficiency for 03"even at very low contaminant levels." This study was notdesigned to evaluate filter life. However, the authors notethat there was no loss in efficiency during the test. Thechemically treated filters depend on irreversible chemicalreactions for the removal of ozone and, hence, these resultscannot be directly compared with those of the current study.However, this is another example of successfulremovalat challenge concentrations typical of polluted urban areas. . AS.H RACONCLUSIONS·The efficacy of charcoal filters for 03 removal has beenevaluated in benchtop studies and in two separate air handling systems for Class 100 clean rooms (clean rooms #Iand #2). The results demonstrate that commercial charcoalfilters, properly sized, can efficiently remove 03 from theoutdoor air in mechanically ventilated buildings. After 37months of continuous use, charcoal filters in a test plenumremove 90% of the 03 in the airstrcam (initial efficicn cy-95%). After the same length of time, charcoal filtersservicing clean room # 1 remove 60% of the o3 in the air strcam (initial efficiency-85%). In the case of clean room#2, charcoal filters continue to remove 95% of the o3 in theairstrearn after 24 months of continuous service. In eachapplication, the removal efficiencies are independent of 03concentrations. which range from 20 to 140 ppb. Theseresults are consistent with those reported in an earlier studyby Shair ( 198 1).The effective service life of the charcoal filters isexpected to depend on both the rate at which air flowsthrough the charcoal and the rate at which airborne
The volwn lric flow rate through these filters is 3,000 cfm (1.4 m 3 /s). Filters with an ASHRAE dust-spot rating of 30%, followed by filters with a rating of 85%, as well cooling coils, arc located upstream of the carbon filters. 03 concentrations were measured a few inches upstream a