Transcription
Quant Mark Econ (2011) 9:211–257DOI 10.1007/s11129-011-9096-1A structural model of sales-force compensationdynamics: Estimation and field implementationSanjog Misra · Harikesh S. NairReceived: 6 September 2009 / Accepted: 3 February 2011 / Published online: 12 March 2011 Springer Science Business Media, LLC 2011Abstract We present an empirical framework to analyze real-world salesforce compensation schemes, and report on a multi-million dollar, multiyear project involving a large contact lens manufacturer at the US, wherethe model was used to improve sales-force contracts. The model is built onagency theory, and solved using numerical dynamic programming techniques.The model is flexible enough to handle quotas and bonuses, output-basedcommission schemes, as well as “ratcheting” of compensation based on pastperformance, all of which are ubiquitous in actual contracts. The model explicitly incorporates the dynamics induced by these aspects in agent behavior.We apply the model to a rich dataset that comprises the complete details ofsales and compensation plans for the firm’s US sales-force. We use the modelto evaluate profit-improving, theoretically-preferred changes to the extantcompensation scheme. These recommendations were then implemented at thefocal firm. Agent behavior and output under the new compensation plan isfound to change as predicted. The new plan resulted in a 9% improvement inoverall revenues, which translates to about 12 million incremental revenuesannually, indicating the success of the field-implementation. The results bearout the face validity of dynamic agency theory for real-world compensationdesign. More generally, our results fit into a growing literature that illustratesthat dynamic programming-based solutions, when combined with structuralS. MisraSimon School of Business Administration,University of Rochester, Rochester, NY, USAe-mail: sanjog.misra@simon.rochester.eduH. S. Nair (B)Graduate School of Business,Stanford University, Stanford, CA, USAe-mail: harikesh.nair@stanford.edu
212S. Misra, H. S. Nairempirical specifications of behavior, can help significantly improve marketingdecision-making, and firms’ profitability.1 IntroductionPersonal selling via sales-forces is an important part of the economy. In theUS, nearly 12% of the total workforce is employed in full-time sales occupations (Zoltners et al. 2001). In a review of sales-force practice, Albers andMantrala (2008) note,“Dartnell’s 30th Sales-force Compensation Survey: 1998–1999 reports the average company spends 10% and some industries spend asmuch as 40% of their total sales revenues on sales-force costs.” In total, the USeconomy is estimated to spend 800 billion on sales-forces, almost three timesthe amount spent on advertising in 2006 (Zoltners et al. 2008). The academicliterature has recognized this practitioner interest, and the design of plans tocompensate sales-forces is now one of the most visible and successful salesforces applications of agency theory in real-world business settings (Mantralaet al. 1994). Surprisingly however, the richness of the theory (reviewed later),contrasts sharply with the sparsity of empirical work on the topic, stemmingpartly from the lack of detailed data on agent’s compensation and sales. Theneed for more empirical work is accentuated by the importance of accountingfor several important features of real-world compensation schemes in evaluating and optimizing sales-force performance. Actual schemes in practicetend to be discrete and kinked, featuring quotas, bonuses and ceilings. Ina survey of Fortune 500 firms, Joseph and Kalwani (1992) report that 95%of compensation schemes they survey had some combination of quotas andcommissions, or both. These aspects complicate the analysis of contracts bygenerating dynamics in the actions of agents. A proper accounting of thesedynamics then becomes critical to the evaluation and improvement of thesales-force scheme.The goals of this paper are two fold. First, we present a framework thatcan help evaluate the dynamic effects of compensation contracts on salesagent output. Our approach is to develop a dynamic structural model ofagent behavior which we use, along with compensation and sales data, toestimate structural primitives underlying agent behavior. We discuss how thevariation induced by the dynamics, in combination with rich data on actualcompensation are useful in helping us learn about these primitives. Our secondgoal is to demonstrate how the model can be used to improve extant compensation schemes, and to cast empirical light on how compensation plans affectoutput. We demonstrate how the structural model may be used to simulateagent behavior and firms’ outcomes to uncover potentially better sales-forceplans, and to assist in plan design. Our framework can handle the rich varietyin quotas, bonuses and commissions schemes observed in practice, and canhelp decision-makers improve these plans. We present an application to thestudying the sales-force contracts of a Fortune 500 contact lens manufacturer,and report on a multi-million dollar, multi-year collaboration, as part of which
A structural model of sales-force compensation dynamics213the recommendations based on the model were implemented at the firm. Therecommendations involved changes to the nature and slope of output basedincentives, and resulted in a new sales-force plan at the firm starting January2009. Under the new plan, revenues to the firm increased by about 12 millionincremental per year (a 9% improvement overall), indicating the success ofthe field implementation.1 Agent behavior and the distribution of output isalso found to change as predicted by the model. We interpret these resultsas reinforcing the practical value of structural agency-theoretic models forcompensation design in real-world settings. We believe our study is one ofthe first to demonstrate the external validity of dynamic structural modelsfor improving marketing decision-making via direct field interventions. Theresults fit into a new literature that has illustrated the value of structuralmodels, more generally, for firm’s decisions (e.g. Mantrala et al. 2006; Choand Rust 2008).The compensation plan in our data features a straight salary paid out irrespective of effort, as well as a marginal compensation on any sales generatedabove a “quota”, and below a “ceiling”. Such quotas are ubiquitous in salesforce compensation and have been justified in the theory literature as a tradeoff between the optimal provision of incentives versus the cost of implementingmore complicated schemes (Raju and Srinivasan 1996), or as optimal underspecific assumptions on agent preferences and the distribution of demand(Oyer 2000). Ceilings or caps on compensation have been rationalized as aresponse to demand uncertainty on the part of the firm. To the extent thatcompensation should reflect effort, a ceiling may help the firm hedge againstthe payout of “windfall” compensation to agents for sales that were unrelatedto effort.While quotas are advantageous, they can also generate inefficiencies due theincentives of agents to time the allocation of effort. For instance, in a “salary commission” scheme such as ours, sales-agents who achieve the quota requiredfor earning the commission in the current compensation cycle may have aperverse incentive to postpone additional effort to the future. Essentially, themarginal effort expended has higher marginal benefit when postponed, as itcontributes to attaining the quota in the next compensation cycle. Similardistortions arise if agents perceive they have no hope of beating quota ina cycle. In some settings, it is possible that such intertemporal reallocationof effort or “gaming” may negate the effort-inducing benefits from utilizingoutput-based compensation schemes. Similarly, ceilings have the obvious disadvantage of destroying the desirable convexity of the plan (e.g., Basu et al.1985), thereby reducing the incentive to expend effort at high levels of output.A priori therefore, the elimination or enhancement of quotas or ceilings in aplan can either beneficial or detrimental to the firm. As this is an empirical1 Thesenumbers may be viewed conservatively as a lower bound on the effect of the new plan dueto the recession in 2009–2010.
214S. Misra, H. S. Nairquestion, one of the questions we address is to empirically evaluate whetherthe profitability of the firm may be improved by changes to the compensationplan along these dimensions. A second question is whether reducing quotasand eliminating ceilings altogether may be better. A third question is how thesechanges may be implemented taking into account organizational and culturebased constraints faced by the firm. Together, these aspects serve to illustratethe economic and managerial implications of the framework. We focus onthese aspects specifically as they are features of the plan in our data, but thereader should note that the proposed framework is flexible enough to considerother changes to the compensation plan as well, including the introduction ofbonuses and the provision of other nonlinear, output-dependent commissionschemes.2The main challenge in the analysis arises from the need to account forthe dynamics in agents’ actions induced by the shape of the compensationschedule. The source of the dynamics is the inherent nonlinearity of theplan. Quotas and ceilings generate curvature in the relationship betweencompensation and output. The curvature generates an incentive for effortbunching: more is gained by the agent by expending a large effort in onemonth, than by spreading the same effort across many months. This in turnimplies that a forward-looking perspective drives agent’s effort allocationdecisions. A second dynamic arises because of a common practice termed“ratcheting” whereby quotas for future periods are updated according to theagent’s currently observed performance. Such ratcheting has been documentedin several real world compensation schemes (e.g. Weitzman 1980; Leone et al.2004), and is also a feature of the plan used by the firm in our empiricalapplication. Ratcheting implies that the agent’s current effort has an effect onhis payoffs in future quarters, thereby making his effort allocation problemdynamic. Ratcheting can help the firm fine-tune quotas to the agent’s trueproductivity or territory potential; but can result in harmful distortions tobehavior if forward-looking agents shade current effort in order to induce favorable, future quotas. A careful consideration of these dynamics are essentialto the estimation of the agent’s preferences, and the simulation of his behaviorunder alternative compensation plans.Estimation of the model is complicated by the fact that effort is unobserved.This is endemic to empirical analysis of all moral-hazard problems. It is ofparticular relevance to structural work, as the inference of the primitivesindexing the model from observed data relies on a credible backing out ofhow the agent expended effort when facing differing scenarios. We introducea methodology that exploits the richness of our data, an informative structure,and recent advances in estimation methods to facilitate the identification ofthis latent construct. In particular, following the intuition in Copeland andMonnett (2009), we describe how intertemporal linkages helps identify effort2 Solving for the optimal plan is outside of the scope of the current analysis, and is an important,but methodologically challenging, direction for future research.
A structural model of sales-force compensation dynamics215from sales data in sales-force compensation settings. Our strategy essentiallyinvolves using the dynamics induced by the nonlinearity and the ratcheting inthe contract for identification of hidden actions. We model agents as maximizing intertemporal utility, conditional on the current compensation scheme, andtheir expectations about the process by which quotas would be updated basedon their chosen actions. Our empirical approach is to estimate, in a first stage,the structural parameters involving the sales person’s utility function. Wethen simulate, in a second stage, his behavior given a changed compensationprofile. The estimator for the 1st stage of our empirical strategy is based onthe recent literature on two-step estimation of dynamic decisions (Hotz andMiller 1993; Bajari et al. 2007). Our approach is to semiparametrically estimateagent-specific policy functions, and use these, along with the conditions for theoptimally of the observed actions, to estimate the structural parameters. Wediscuss how an individual rationality constraint as well as the assumption ofagent optimality identifies agent preferences. We use our estimates to generatethe empirical distribution of agent preferences, which we use to simulate thebehavior of the agent-pool under counterfactual compensation profiles.A practical concern with the use of two step estimators has been the presence of unobserved serially correlated state variables which prevent consistentnonparametric estimation of first-stage policy functions and transitions. Inparticular, this ruled out models with persistent unobserved heterogeneity(though see Arcidiacono and Miller 2008 for a recent approach that handlesdiscrete unobserved heterogeneity). We are able to address this problem dueto the availability of panel data of relatively long cross-section and durationfor each agent, which facilitates estimation agent-by-agent. This enables anonparametric accommodation of unobserved heterogeneity analogous to theintuition proposed by Evdokimov (2009) in the context of panel data models.Given the estimates from the first stage, we evaluate agent behavior and salesunder the counterfactual by solving the agents’ dynamic programming problemnumerically.Our descriptive analysis of the data reveals evidence that the current planmay be inefficient. In particular, we find the incentives inherent in the currentplan are too weak, and there is evidence for shirking by agents in the early partof the compensation cycle. The model predicts that reduction or elimination ofquotas, and reduction of the length of the quota cycle reduces this perverseincentive; this aspect is borne out in the realized sales from the new plan.We also find evidence that the extent of demand uncertainty may not behigh enough to warrant the ceiling imposed on incentive compensation in thecurrent plan. Indeed, in the new plan, ceilings are eliminated, and realized salessignificantly exceed the caps from the old plan, as predicted by the model.Overall, our prediction from the model is that overall sales will rise from theelimination of quotas and ceilings, which is validated by the data from thenew plan. The fact that overall quarterly sales increased suggests the old planwas inef f icient, and that gaming resulted in reduction in aggregate orders, andnot simply intertemporal substitution. The model also predicts that under thenew plan, output variation within the months of the old compensation cycle
216S. Misra, H. S. Nairwill be eliminated, i.e. shirking in the early sales will reduce, and effort fromthe later part of the cycle will be reallocated to earlier months. The new datacorroborates these predictions. Further, the differences in sales across monthsis not statistically significant under the new plan. Overall, these results stronglyestablish the out of sample validity and statistical power of the predictions fromthe proposed model.Our paper adds into a small empirical literature that has explored thedynamic effects of incentive schemes. Despite the preponderance of nonlinearincentive schemes in practice, the empirical literature analyzing these, andthe effect of quotas on sales-force effort in particular, has remained sparse.Part of the reason for the paucity of work has been the lack of availabilityof agent-level compensation and output data. The limited empirical work hasprimarily sought to provide descriptive evidence of the distortionary effect ofpayment schemes on outcomes (e.g. Healy 1985, in the context of executivecompensation; Asch 1990, in the context of army-recruiters; and Courty andMarschke 1997, in the context of federal job-training programs). Oyer (1998)was the first to empirically document the timing effects of quotas, by providingevidence of jumps in firms’ revenues at the end of quota-cycles that are unrelated to demand-side factors. On the theory side, it is well known (Holmstrom1979; Lazear 1986) that nonlinear output-based contracts, in general, havethe beneficial effect of inducing agents to exert effort, even when effort isunobservable by the firm. However, surprisingly little is known about the roleof quotas in motivating agents effort.3 In the sales-force context there is a largeliterature that investigates the design and implementation of compensationplans that induce optimal levels of sales-force effort, and examines the role ofvarious factors on the nature and curvature of the optimal contract (see for e.g.Basu et al. 1985; Lal and Srinivasan 1993; Misra et al. 2005; Rao 1990). Most ofthis literature, however, has little to say about quotas (Coughlan 1993).A related literature also seeks to empirically describe the effect of incentives, more broadly, on output (e.g. Chevalier and Ellison 1997; Lazear 2000;Hubbard 2003; Bandiera et al. 2005; see Pendergast 1999 for a review).We complement this literature by detecting and measuring the dynamicinefficiencies associated with compensation schemes. The descriptive evidenceon quotas are mixed. Using data from a different context, and a differentcompensation scheme, Steenburgh (2008) reports that agents facing quotas ina durable-goods company do not tend to reduce effort in response to lumpsum bonuses. In contrast, Larkin (2010) reports on the distortionary effects ofcompensation schemes on the timing and pricing of transactions in technologymarkets. The differences accentuate the need for more empirical work. Our3 Analternative motivation of output-based contracts is that it may help attract and retain the bestsales-people (Lazear 1986; Godes 2003; Zenger and Lazzarini 2004). This paper abstracts awayfrom these issues since our data does not exhibit any significant turnover in the sales-force.
A structural model of sales-force compensation dynamics217paper is also related to the work of Ferrall and Shearer (1999), Paarschand Shearer (2000), Lee and Zenios (2007), and Jiang and Palmatier (2009),who estimate static, structural models of agent behavior, while modeling theoptimal contract choice by the firm; and to Dufflo et al. (2010) who estimatea structural labor supply model of teachers decision to work, given nonlinearfinancial incentives they engineered as part of a randomized trial. The closestpaper to ours in spirit is Copeland and Monnett (2009) who estimate a dynamicmodel to analyze the effects of nonlinear incentives on agents’ productivity insorting checks. Our institutional context, personal selling by sales-force agents,adds several aspects that warrant a different model, analysis, and empiricalstrategy from Copeland and Monnet’s context. Unlike their industry, demanduncertainty plays a key role in our setting; this generates a role for riskaversion, and a trade-off between risk and insurance in our contracts. Further,ratcheting, an important dynamic affecting agent effort in our setting, is not afeature of their compensation scheme. Ratcheting generates a dynamic acrosscompensation periods, in addition to dynamics induced within the period bythe nonlinearity.The methods we develop here can also be used to analyze compensationissues in other business contexts. For example, Chung et al. (2010) has usedthe framework developed here to analyze the role of bonuses in a durable goodselling context. In contrast to our application, their plan has lump-sum bonusesand a progressive incentive scheme, but no ratcheting. As limited panel datais available per agent, they use the algorithm proposed by Arcidiacono andMiller (2008) to accommodate unobserved heterogeneity. More generally, ourapproach can be used to investigate the dynamics of agent behavior undermany situations where agents optimize relative to deadlines or thresholds (e.g.,cell-phone consumption in tariff plans with pre-specified allowances of freecalls: Yao et al. 2010).Finally, our paper also adds to the theoretical literature on sales-forcecompensation by offering a computational framework in which to examinemore realistic comparative dynamics that involve arbitrarily complex anddynamic compensation plans and effort policies of agents that respond tothese dynamics. The rest of this paper is structured as follows: We beginwith a description of our data and some stylized facts. We then introduceour model followed by the estimation methodology. We then discuss resultsand predictions for an improved plan. We then discuss results from the fieldimplementation and then conclude.2 Patterns in the data and stylized factsIn this section, we start by presenting some stylized facts of our empiricalapplication, and also provide descriptive evidence for the effect of quotas onthe timing of effort allocations by sales-agents in our data. We use the reducedform evidence and the stylized facts presented here to motivate our subsequentmodel formulation and empirical strategy.
218S. Misra, H. S. Nair2.1 Data and compensation schemeOur data come from the direct selling arm of the sales-force division of alarge contact lens manufacturer in the US with significant market-share inthe focal category (we cannot reveal the name of the manufacturer due toconfidentiality reasons). Contact lenses are primarily sold via prescriptionsto consumers from certified physicians. Importantly, industry observers andcasual empiricism suggests that there is little or no seasonality in the underlyingdemand for the product. The manufacturer employs 87 sales-agents in the U.S.to advertise and sell its product directly to each physician (also referred to as a“client”), who is the source of demand origination. The data consist of recordsof direct orders made from each doctor’s office via a online ordering system,and have the advantage of tracking the timing and origin of sales precisely.Agents are assigned their own, non-overlapping, geographic territories, andare paid according to a nonlinear period-dependent compensation schedule.We note in passing that prices play an insignificant role for output since thesalesperson has no control over the pricing decision and price levels remainedfairly stable during the period for which we have data.4 As noted before, thecompensation schedule involves salaries, quotas and ceilings. Commissionsare earned on any sales exceeding quota and below the ceiling. The salaryis paid monthly, and the commission, if any, is paid out at the end of thequarter. The sales on which the output-based compensation is earned are resetevery quarter. Additionally, the quota may be updated at end of every quarterdepending on the agent’s performance (“ratcheting”). Our data includes thehistory of compensation profiles and payments for every sales-agent, andmonthly sales at the client-level for each of these sales-agents for a period ofabout 3 years (38 months).Quarterly, kinked compensation profiles of the sort in our data are typicalof many real world compensation schemes. Consistent with the literature, ourconversations with the management at the firm revealed that the primary motivation for quotas and commissions is to provide “high-powered” incentives tothe sales-force for exerting effort in the absence of perfect monitoring. We alsolearned that the motivation for maintaining a “ceiling” on the compensationscheme is consistent with the “windfall” explanation mentioned in the introduction. The latter observation suggests that unanticipated shocks to demandare likely important in driving sales.The firm in question has over 15,000 SKU-s (Stock Keeping Units) ofthe product. The product portfolio reflects the large diversity in patientprofiles (e.g. age, incidence of astigmatism, nearsightedness, farsightedness orpresbyopia, corneal characteristics, eye-power etc.), patient needs (e.g. daily,disposable, sports use, cleaning frequency) and contact lens characteristics (e.g.4 In other industries, agents may have control over prices (e.g. Bhardwaj 2001). In such situations,the compensation scheme may also provide incentives to agents to distort prices to “make quota”.See Larkin (2010), for empirical evidence from the enterprise resource software category.
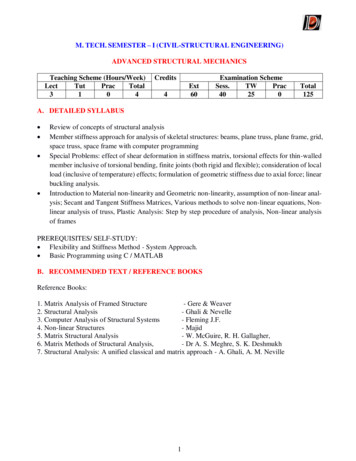
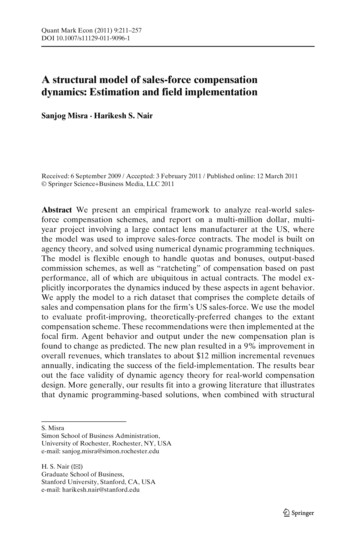
A structural model of sales-force compensation dynamics219hydrogel, silicone-hydrogel, moistness, color etc.). The product portfolio ofthe firm is also characterized by significant new product introduction and lineextensions reflecting the large investments in R&D and testing in the industry.New product introductions and line extensions reflect both new innovations aswell as new usage regimens for patients uncovered by fresh trials and testing.The role of the sales-agent is primarily informative, by providing the doctorwith updated information about new products available in the product-line,and by suggesting SKU-s that would best match the needs of the patientprofiles currently faced by the doctor. While agents’ frequency of visitingdoctors is monitored by the firm, the extent to which he “sells” the productonce inside the doctor’s office cannot be monitored or contracted upon. Inaddition, while visits can be tracked, whether a face-to-face interaction with adoctor occurs during a visit in within the agent’s control (e.g., an unmotivatedagent may simply “punch in” with the receptionist, which counts as a visit,but is low on effort).5 In our application, we do not separately model thesedimensions of sales-calls, and interpret all factors by which an agent shifts adoctors’ sales as effort.2.2 The timing of effortWe start by checking whether dynamics are an important consideration forunderstanding agents’ behavior under this contract. We start by looking in thedata to see whether there exists patterns consistent with agent’s shifting theallocation of sales within the compensation cycle in manners consistent withincentives. First, as Oyer (1998) pointed out, when incentives exist for agentsto manipulate timing, output (i.e. sales) should look lumpy over the course ofthe sales-cycle. In particular, we expect to see spikes in output when agentsare close to the end of the quarter (and most likely to be close to “makingquota”). Figure 1 plots the sales achieved by month of quarter across salesagents. Figure 1 reveal significant increase at the end of quarters suggestingthat agents tend to increase effort as they reach closer to quota. In the absenceof seasonality, this suggests the possibility of shirking early in the quarter.In Fig. 2, we present plots at the agent-level that suggest that agents alsotend to reduce effort within the quarter. We plot patterns in sales (normalizedby total sales across all months in the data) for four agents. The shaded regionsin Fig. 2 highlights quarters in which sales fell in the last month of the quarter,perhaps because the agent realized a very large negative shock to demandearly in the quarter and reduced effort, or because he “made quota” earlyenough, and hence decided to postpone effort to the next sales-cycle.6 We now5 Thefirm does not believe that sales-visits are the right measure of effort. Even though sales-callsare observed, the firm specifies compensation based on sales, not calls.6 One alternative explanation for these patterns is that the spikes reflect promotions or pricechanges offered by the firm. Our extensive interactions with the management at the firm revealedthat prices were held fixed during the time-period of the data (in fact, prices are rarely changed),and no additonal promotions were offered during this period.
220S. Misra, H. S. NairFig. 1 Sales per week bymonth of quarter60000Sales50000400003000020000123MonthAgent 3.04.04Sales-share.06.08Sales-share.06.08.1.1Agent 1369Month12151836121518121518Agent 4Sales-share0 .02 .04 .06 .08 .1Sales-share.05 .06 .07 .08 .09 .1Agent 29Month369Month1215Patterns suggesting agent 'gave up'Fig. 2 Agents reduce effort within quarters18369Month
A structural model of sales-force compensation dynamics221explore how these sales-patterns are related to how far the agent is from hisquarterly quota. Figure 3 shows kernel smoothed estimates of the relationshipbetween sales (y-axis) and the distance to quota (x-axis), computed across allthe sales-people for the first two months of each quarter in the data. We defineCumulative Sales at beginning of month-quota)the distance to quota as (. From Fig. 3, wequotasee that the distance to quota has a significant influence on the sales profile.Sales (proportional to effort) tend to increase as agents get closer to quota,suggesting increasing effort allocation, but fall once the agent reaches about40% of the quota in the first 2 months, suggesting the agent anticipates hewould “make the quota” by the end of the quarter. The decline in sales asthe agent approaches quota is also consistent with the ratcheting incentive,whereby the agent reduces effort anticipating his quota may be increased inthe next cycle, if he exceeds the ceiling this quarter. To further explore theeffect of quotas, we present in Fig. 4, nonparametric plots of the % quotaattained by the end of month T 1 versus the % quota attained by the end ofmonth T ( 2, 3), across all agents and quarters. Figure 4 suggests patterns thatare consistent with intertemporal effort allocation due to quotas. In particular,when far away from quota in month T 1 (x 0.2,0.4), the profile is convex,suggesting a ramping up of effort. When the agent is close to quota in monthT 1 (x 0.5,0.8), the profile is concave suggesting a reduction in the rateof effort alloc
pations (Zoltners et al. 2001). In a review of sales-force practice, Albers and Mantrala (2008) note,"Dartnell's 30th Sales-force Compensation Survey: 1998- 1999 reports the average company spends 10% and some industries spend as much as 40% of their total sales revenues on sales-force costs." In total, the US