Transcription
INL/CON-15-37068PREPRINTOn-road andDynamometer Evaluationof Vehicle AuxiliaryLoads2016 SAE World CongressBarney Carlson(Idaho National Laboratory)Kevin Stutenberg(Argonne National Laboratory)Jeff Wishart(Intertek CECET)October 2015This is a preprint of a paper intended for publication in a journal orproceedings. Since changes may be made before publication, thispreprint should not be cited or reproduced without permission of theauthor. This document was prepared as an account of worksponsored by an agency of the United States Government. Neitherthe United States Government nor any agency thereof, or any oftheir employees, makes any warranty, expressed or implied, orassumes any legal liability or responsibility for any third party’s use,or the results of such use, of any information, apparatus, product orprocess disclosed in this report, or represents that its use by suchthird party would not infringe privately owned rights. The viewsexpressed in this paper are not necessarily those of the UnitedStates Government or the sponsoring agency.
2016-01-0901On-Road and Dynamometer Evaluation of Vehicle Auxiliary LoadsRichard “Barney” Carlson, Idaho National LaboratoryJeffrey Wishart, Intertek Testing Services NA Inc.Kevin Stutenberg, Argonne National LaboratoryAbstractIntroductionLaboratory and on-road vehicle evaluation is conducted on fourvehicle models to evaluate and characterize the impacts to fueleconomy of real-world auxiliary loads.As part of the testing and data collection support to the U.S.Department of Energy’s (DOE) Advanced Vehicle Testing Activity(AVTA) [1], Idaho National Laboratory, Argonne NationalLaboratory, and Intertek Center for Evaluation of Clean EnergyTechnology (CECET) test advanced technology vehicles in on-roadfleets, on test tracks, and in laboratory settings in order to determinethe real-world petroleum consumption reduction potential of variousadvanced vehicle technologies. One strategy for petroleumconsumption reduction is to reduce the auxiliary, 12 V loads of thevehicle. This strategy has been explored in recent research [2-5] andseveral U.S. automotive manufacturers are also interested indeveloping novel methods for improved fuel economy.The four vehicle models in this study include the Volkswagen JettaTDI, Mazda 3 i-ELOOP, Chevrolet Cruze Diesel, and Honda CivicGX (CNG). Four vehicles of each model are included in this; sixteenvehicles in total. Evaluation was conducted using a chassisdynamometer over standard drive cycles as well as twelve months ofon-road driving across a wide range of road and environmentalconditions.The information gathered in the study serves as a baseline to quantifyfuture improvements in auxiliary load reduction technology. Theresults from this study directly support automotive manufacturers inregards to potential “off-cycle” fuel economy credits as part of theCorporate Average Fuel Economy (CAFE) regulations, in whichcredit is provided for advanced technologies in which reduction ofenergy consumption from vehicle auxiliary loads can bedemonstrated.The observed on-road auxiliary load varied from 135 W to over 1200W across a wide range of ambient conditions and utilization patterns.The annual average auxiliary load varied across vehicle models from310 W to 640 W. Ambient temperature was the most predominantfactor to impact auxiliary load since air conditioner (A/C) operationis prevalent at high ambient temperature and heating systemoperation is prevalent at cold ambient temperatures. Additionally theimpact of auxiliary load on vehicle fuel economy was determined tobe typically between 7.5% and 18% of the fuel consumed during onroad operation of the four vehicle models in this study.During dynamometer testing, auxiliary loads were captured fromseveral key locations along the low-voltage bus, including thealternator output, the low-voltage battery, and select other locationsdependent upon the vehicle configuration. Dynamometer testing wasthen conducted on both certification and custom constant-speed drivecycles at three ambient temperatures (-7 oC, 23 oC, as well as 35 oCwith 850 W/m2 of solar emulation). This instrumentation and testmethodology provides an accurate understanding of the energy useby the accessory system from these four vehicle technologies.This paper details and discusses the dynamometer and on-roadevaluation results of the auxiliary load from the sixteen vehicles overthe twelve month period.Page 1 of 8Vehicle auxiliary load data collection, analysis, and characterizationwere conducted on sixteen non-electrified vehicles as part of theAVTA on-road vehicle evaluation. This auxiliary loadcharacterization study directly supports automotive manufacturers inregards to potential “off-cycle” fuel economy credits that are part ofthe U.S. CAFE regulations, in which credit is provided for advancedtechnologies that reduce the energy consumption from vehicleauxiliary loads. A few examples of these advanced technologies areadvanced alternators, HVAC systems, active aerodynamics systems(such as movable grille shutters that close at high speeds), andlighting systems. The data collection and analysis details the auxiliaryload data collected during the on-road operation of 126,000 miles of16 non-electrified vehicles (four Volkswagen Jetta TDI, four Mazda3 i-ELOOP, four Chevrolet Cruze Diesel, and four Honda Civic GX(CNG) vehicles).Chassis dynamometer testing was conducted on the same four vehiclemodels noted above, over several standard drive cycles (e.g., UDDS,HWFET, and US06) at three separate temperatures of -7 C, 23 C,as well as 35 C with 850 W/m2 of solar emulation. Instrumentationwas installed on each vehicle prior to dynamometer evaluation inorder to capture 12 V power flow and energy consumption by thevehicle accessories. This was used to correlate and cross referencethe on-road data collection across varying ambient conditions andtemperatures.Vehicle Models EvaluatedThe sixteen vehicles in this study include four 2013 Volkswagen JettaTDI, four 2012 Honda Civic CNG, four 2014 Mazda 3 i-ELOOP, andfour 2014 Chevrolet Cruze Diesel vehicles. The vehicles are operatedon-road in document delivery courier fleets and taxi fleets in Arizona,Texas, and Oklahoma. Routine maintenance is performed on thevehicles per the manufacturer’s maintenance schedule.INL/CON-15-37068
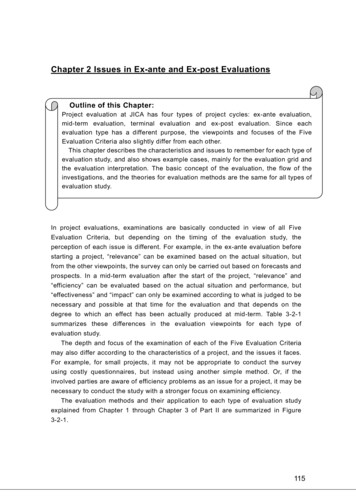
The test vehicles selected for the project were diesel vehicles (JettaTDI and Cruze Diesel), natural gas vehicles ((NGVs) Civic CNG),and an advanced conventional vehicle (3 i-ELOOP). The vehicleswere chosen because of automotive OEM requests to study nonelectrified vehicles auxiliary load characteristics during on-roadoperation. The ultra-capacitor of the Mazda 3 i-ELOOP helps reducedemand on the 12 V battery, but the vehicle architecture was deemedsufficiently conventional to be included in the study. Furthermore,each vehicle model has unique features which are of interest and areshown in Table 1. The Jetta TDI and Chevy Cruze Diesel both utilizea four-cylinder, turbo diesel engine. The Jetta TDI has a six-speed,dual-clutch transmission, whereas the Cruze Diesel has aconventional six-speed, automatic transmission. The Honda CivicCNG utilizes compressed natural gas (CNG) as the sole fuel source.Of importance, the Civic CNG does not use a fuel pump, which isimportant with respect to auxiliary load. The Mazda 3 i-ELOOPutilizes a direct-injection, gasoline engine and a six-speedtransmission. Additionally, the Mazda 3 i-ELOOP uses a 25 Vcapacitor and power electronics to supplement and aid the alternatorsystem in providing electrical power to the auxiliary loads to improveoperating efficiency.Table 1. Test vehicle descriptionsVehicle Model2013 VW Jetta TDI2014 Chevrolet Cruze Diesel2012 Honda Civic CNG2014 Mazda 3 i-ELOOPNotable CharacteristicsFeaturesandTurbo diesel engine with dualclutch transmissionTurbo diesel engine withautomatic transmissionCNG naturally aspirated enginewith automatic transmission25 V capacitor and powerelectronics system to aidalternator efficiency performanceTesting OverviewThe sixteen vehicles (four of each vehicle model) were instrumentedwith current and voltage sensors as well as controller area network(CAN) message monitoring equipment. On-board data acquisition(DAQ) systems from Isaac Instruments were installed in the vehiclesto record the current, voltage, and CAN messages. This informationwas used to determine the vehicle operating conditions, utilizationpatterns and the auxiliary loads during those conditions.Prior to testing, all features of the tests vehicles which can apply asubstantial load to the 12 V system were identified. For each featureidentified, the amperage rating for the fuse through which powerflows to that feature’s hardware was also documented. The vehiclestate (i.e., key on, engine off/key on, engine on) during which eachfeature becomes functional was also determined.In order to conduct the characterization of the loads on the 12 Vsystem, the vehicle was instrumented using current sensors on thecables leading to the various feature hardware. The current sensorswere connected to the Isaac Instruments DAQ systems, and the datawere set to capture at a 1 Hz rate. The current sensor data were alsocorroborated using signals that were deciphered from the vehicleCAN system.only with the engine on because the engine power is required. Thepower draws that were measured are shown in Table 2 (power drawoccurring only with the engine on are indicated by blue shading).Table 2. Tested individual power drawsParking lightsCabin fan (at all available speeds)Dashboard lightsRadio (at high volume)Headlights (low and highWindshield wipers (low and highbeam)speed)Dome lightsWindshield washer (front and rear)Moon roof (open andDriver’s windowclose)Taxi light and meter*DAQ power drawDriver and passenger seatAir conditioning (ECO, Normal,heatersand MAX, with varying fan speeds)Front and Rear defrostersElectric power steeringBrake lightsReverse lights* Some of the test vehicles are in taxi fleetsThe test vehicles were deployed into AVTA project partner fleets inseveral locations:xxxxPhoenix, AZ: VW Jetta TDIDallas and Houston, TX: Chevrolet Cruze DieselOklahoma City, OK: Honda Civic CNGPhoenix, AZ: Mazda 3 i-ELOOPThe vehicles operate within these fleets in the same manner as othervehicles within the same fleet, except that the drivers maintain a logof all refueling, and all maintenance is recorded.The fleets are couriers that accumulate up to 500 miles per day, andthis rapid accumulation helps provide a large amount of on-roadoperation data in a condensed period of time. The vehicles are drivenby multiple drivers to avoid driver bias, and the vehicles are driven ina wide variety of drive cycles, from intra-city to urban to highway tointerstate roads, with topographical variation, although there is nopre-determined driving pattern that is forced upon the fleets. Further,the vehicles are driven year-round, with results in significanttemperature variation.The Isaac DAQ systems capture the on-road operation data, and thebase of operations for each fleet is equipped with Wi-Fi routers thatallow for automatic data upload whenever the vehicle is in thevicinity. In this way, the 12 V load characterization data wereuploaded on a nearly a daily basis to ensure data continuity and datacompleteness.Individual Load Benchmark EvaluationA specific auxiliary load test was completed on each vehicle model tomeasure the load of individual accessories and components.Additionally, the base auxiliary load of the vehicle was measuredwith all driver controlled accessories in the off position with theengine off and with the engine idling. Figure 1 shows the measuredvalues for the individual auxiliary loads. Note the Honda Civic CNGis not equipped with seat heaters, rear defroster, or electric powersteering.The 12 V power draws were separated into two categories: (1) powerdraws during engine off, and (2) power draws during engine on.There was some overlap between the two groups, with some powerdraws occurring in both cases, while other power draws occurringPage 2 of 8INL/CON-15-37068
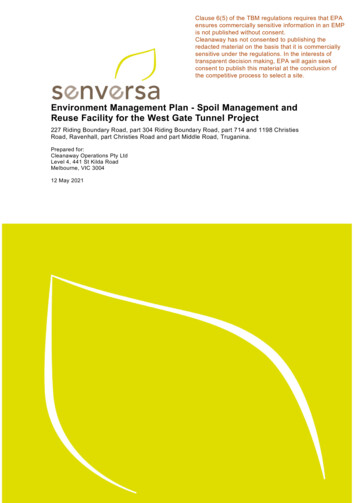
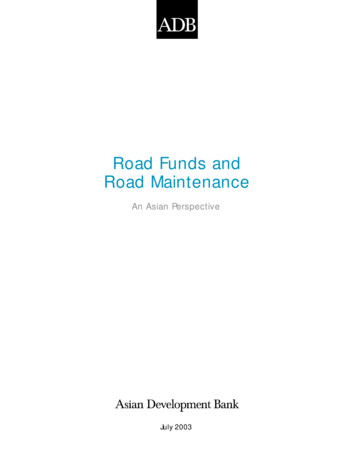
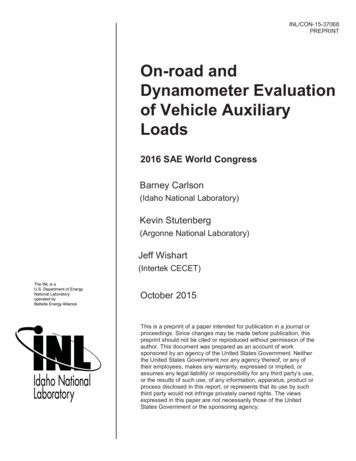
Figure 2. Vehicle during Chassis Dynamometer Testing at Argonne NationalLab’s Advanced Powertrain Research FacilityCertification drive cycles were utilized in order to provide a base forthe variation in accessory loads that can be compared and contrastedwith the variation seen in the on-road test results. These certificationcycles included the UDDS, HWFET, US06, and SC03, with all butthe SC03 cycle performed at the test cell temperatures of -7 C, 23 C, as well as 35 C with solar emulation of 850 W/m2.Instrumentation of each vehicle, which focused on accessory loadmeasurements, included a voltage tap across the vehicles 12 Vbattery, a current clamp on the cable providing vehicle power fromthe alternator, and a separate current clamp on the negative side ofthe 12 V battery. Power at each location was calculated using aHioki 3390 power analyzer, and logged at a frequency of 10 Hz.Accessory load average power was determined by subtracting theenergy delivered to the 12 V battery from energy supplied by thealternator, and divided the result by the time duration of the cycle.Figure 1. Individual auxiliary load characterizationTable 3 shows the minimum auxiliary load when the engine is idlingand all driver controlled accessories are in the off position. Note thewide range of auxiliary load across the vehicle models. The HondaCivic CNG has the lowest auxiliary load of the four vehicle models inpart due to not having a fuel pump. Also of note, the two vehicleswith turbo diesel powertrains have quite similar auxiliary loads at idle(256 W and 258 W) when all accessories are turned off.Table 3. Minimum auxiliary load with Engine idling (all accessories off)Vehicle ModelSteady State Auxiliary Loadwith Engine Idling and AllAccessories Off (W)2013 VW Jetta TDIVehicle accessories remained in the standard conditions when thevehicle was operated on the dynamometer cycles. This included theHVAC system turned off at the test temperature of 23 C, and set toan automatic setting of 22 C when at the test temperatures of -7 Cand 35 C. The vehicle radio remained off during all tests, and alllights were left at the settings in which the vehicle defaulted to uponthe “key on” state.The average power required for each vehicle model over the standarddrive cycles can be seen in Figure 3 including cold start (CS) and hotstart (HS) drive cycles.2582014 Chevy Cruze Diesel2562012 Honda Civic CNG1362014 Mazda 3 i-ELOOP206Chassis Dynamometer TestingThree of the vehicles were also tested on a chassis dynamometer inorder to provide a thorough evaluation while under controlled,repeatable conditions within a temperature controlled environmentalchamber. The standard U.S. certification drive cycles were run, aswell as customized drive cycles to capture the steady-state vehicleaccessory load. This testing was conducted at Argonne NationalLab’s Advanced Powertrain Research Facility as shown in Figure 2.Page 3 of 8Figure 3. Average auxiliary load power over the standard drive cycles atvarying temperaturesINL/CON-15-37068
Calculation of the vehicle energy consumption over the standarddrive cycles is another metric that allows for a direct comparison withenergy useage during on-road operation. The results of thiscomparison are shown in Figure 4.Figure 4 that variations in ambient temperature result in a wideranging addition of accessory loads. This was further quantified withthe collection of on-road data from the same vehicle models.On-Road Data Collection and AnalysisOver a twelve month period, September 2014 through August 2015,data was recorded and analyzed from the sixteen vehicles whileoperating in the on-road fleet. The auxiliary load was measured fromthe 12V system of each vehicle and energy consumption wascalculated. Table 4 shows that the annual average auxiliary load foreach vehicle model varies from 310 W to 640 W across the vehiclemodels. This variation is due to differences in accessory powerconsumption variation between the four vehicle models as well asdriver variability in accessory utilization.Table 4. Fleet average on-road auxiliary load per vehicle modelVehicle ModelFigure 4. Energy consumption over the standard drive cycles at varyingtemperaturesIn order to capture the vehicles’ steady-state energy consumption, at22 C and at a constant speed, a custom cycle was developed forvehicle operation on the dynamometer. This drive cycle consisted ofvehicle preconditioning to operating temperature with a 55 mphsteady-state speed, followed by the drive cycle in which the vehiclespeed was increased, in increments of 10 mph, from 10 mph to 80mph, and then reduced, again in increments of 10 mph, from 80 mphto 10 mph. Each speed was held for 30 seconds duration. Duringeach steady-state speed, auxiliary load was measured for each vehiclemodel. The results from this steady state dynamometer testing areshown in Figure 5.Average Auxiliary Load (W)2013 VW Jetta TDI639.72014 Chevy Cruze Diesel561.22012 Honda Civic CNG309.82014 Mazda 3 i-ELOOP425.0The average auxiliary load on a quarterly basis is determined andshown in Figure 6. The auxiliary load varies across the four seasonsand is significantly different between the vehicle models. All of thevehicle models showed the highest auxiliary load during the summermonths primarily due to increased air conditioning usage. In contrast,the lowest auxiliary load was the lowest during the winter months foronly two of the four models (Jetta TDI and Civic CNG). The othertwo models did not have minimum auxiliary loads during wintermonths likely due to increased defroster operation, heated seats, andother cold weather accessories.Figure 5. Auxiliary load measured at steady state speedsAfter accounting for slight variations due to battery charging, theaverage accessory load of each of the three test vehicles was found toremain within 15 W from the mean value through the duration of thesteady-state speeds. Additionally, these values fall in line with theaverage values seen on the 23 C drive cycles, thought slight offsetswere seen to occur due to varying vehicle operational requirementssuch as cooling fan loading, and other powertrain-related systems.Through the duration of dynamometer testing on the three vehiclemodels, accessory load remained consistent with the results from thestandard drive cycles. Meanwhile, it can be seen in Figure 3 andPage 4 of 8Figure 6. Seasonal variation of average on-road auxiliary load by vehiclemodelOn-road operation resulted in a wide range of auxiliary load powerthat varied in measurement from 135 W to over 1200 W. Figure 7shows a histogram of the auxiliary load from each vehicle over theone year on-road data collection period. The results shown are theaverage auxiliary load for each driving trip which is defined as a keyon to key-off event in which a minimum distance of 0.5 miles wasINL/CON-15-37068
traveled. There is notable similarity amongst the four vehicles of eachmodel, but the results are not identical, likely due to naturalvariability in driver choice of accessory operation, ambienttemperature, driving patterns, and many other factors (as opposed todifference in power consumption of auxiliary loads within a vehiclemodel).required by the compressor for the working fluid is not included inthe auxiliary loads as measured in this study. However, during A/Coperation there are several electrical loads operating including theinterior cabin fan, the condenser fan, and the electrically operatedclutch on the A/C compressor. These auxiliary loads are included inthe measurements of this study and will increase as compressor andcondenser fan cycles at a greater rate at higher temperatures andwhen the driver operates the interior fan at a higher fan speed.For the Jetta TDI this impact of ambient temperature on auxiliaryload doubled the auxiliary load from 470 W at 20 oC to 956 W at 45oC. Other vehicle models showed lesser impact on auxiliary load dueto ambient temperature. For instance the Honda Civic CNG showed avariation from 290 W to 360 W across the range of temperatureencounter during the year of driving. This smaller impact by ambienttemperature as compared to the other vehicle models may partially beexplained by the fact that these four Honda Civic CNG vehicles werenot equipped with heated seats, rear defroster or other accessoriesthat are typically used at cold temperatures.Figure 7. Histogram of on-road auxiliary load of each vehicleFigure 8 shows the vehicle model average of the results displayed inFigure 7. This more clearly shows the auxiliary load differencesbetween vehicle models including single and multi-modaldistributions. The Honda Civic CNG shows a single modedistribution with a mode of 250 W. In contrast, the other vehiclesshow a multiple mode distribution. The Mazda 3 i-ELOOP forinstance has two modes, one near 285 W and the other near 500 W.This variation reinforces the wide range of accessory operation asdetermined by the driver preferences.Figure 9. Impact of ambient temperature on auxiliary loadFigure 8. Histogram of on-road vehicle model averaged auxiliary loadTo determine overall impact to vehicle energy consumption, theauxiliary load energy consumption was calculated from the on-roaddata. This is determined from the same on-road data as shown inFigures 7 through 9, but it is determined as an energy per distancebasis. Figure 10 shows the energy consumption results from the fourvehicle models. It is observed that the overall trend of auxiliary loadenergy consumption is the same as auxiliary load power whencomparing Figure 9 to Figure 10. In Figure 10 however, morevariability in the results can be seen. This is again due to variation isdriving patterns such as city versus highway driving, amount of idletime, trip distance, and many other factors. Figure 10 shows that thenominal auxiliary load energy consumption is between 10 and 35Wh/mi across the four vehicle models. Also, as seen previously fromauxiliary load power, the auxiliary load energy consumption doublesat high temperatures for the VW Jetta TDI up to 70 Wh/mi.Analysis of the on-road data showed that ambient temperature wasthe single largest factor to impact auxiliary load during the twelvemonth on-road evaluation. Figure 9 shows the auxiliary load of thefour vehicle models across a wide range of ambient temperature fromthe on-road data collection. As expected the auxiliary load is at aminimum between 15 oC and 30 oC. At colder and hottertemperatures the auxiliary load increased due to increased use ofclimate control, defroster, heat seats and other accessories. All fourvehicle models utilize air conditioner (A/C) compressors that are beltdriven from the engine accessory drive belt. This means the powerPage 5 of 8INL/CON-15-37068
importance of the potential energy saving improvements that couldbe made by improving alternator efficiency or reducing auxiliaryloads.Table 6. Auxiliary Load impact on Vehicle Fuel EconomyVehicleModel2012 HondaCivic CNG2014 Mazda 3i-ELOOP2013 VWJetta TDI2014 ChevyCruze .Load(Gal/mi)Aux Load %of Total FuelConsumption36.3 [8].0275.001967.5%31.7 [9].0315.0030710.2%35.5 [10].0282.0048418.1%35.6 [11].0281.0032012.0%Figure 10. Impact of ambient temperature on auxiliary energy consumptionThe average on-road auxiliary load energy consumption wasdetermined for each vehicle model over the one-year data collectionperiod. The results are shown in Table 5.Table 5. Fleet average on-road auxiliary load energy consumption per vehiclemodelVehicle ModelAverage On-road Auxiliary LoadEnergy Consumption (Wh/mi)2012 Honda Civic CNG2014 Mazda 3 i-ELOOP2013 VW Jetta TDI2014 Chevy Cruze Diesel14.122.139.626.2The on-road data collection provided detailed data and results thatshowed the wide variability in auxiliary load across vehicle models aswell as the impact of many factors, especially ambient temperature.Impact of Auxiliary Load on Fuel EconomyFrom literature review, it is know that typical alternator efficiency is55% [6], typical maximum engine efficiency is up to 40% [6], andtypically accessory drive belt efficiency is 98% [6]. This results in anapproximate power conversion from fuel energy to electrical energyefficiency of 21% [6]. The fuel economy impact from the auxiliaryload energy consumption can therefore be estimated from themeasured on-road auxiliary load energy consumption and measuredon-road fuel consumption.Given the lower heating value for diesel is 36.0 kWh/gal [7] andgasoline (as well as CNG gasoline gallon equivalence) is 31.8kWh/gal [7], the auxiliary load energy consumption (Wh/mi) can beconverted into gallons per mile. These results can be used todetermine the auxiliary load percent of energy consumption from thetotal vehicle energy consumption. This was accomplished by usingthe average auxiliary load energy consumption as shown in Table 5.Table 6 shows the measured average on-road fleet fuel economy andfuel consumption of the four vehicle models [8-11] that weredetermined during the same on-road testing of the AVTE program.Table 6 also includes the auxiliary load energy consumption, and thepercent contribution of auxiliary load on total on-road fuelconsumption. The percent of total on-road fuel consumption that isconsumed by the vehicle auxiliary loads varies from 7.5% to 18.1%as shown in table 6. Since the auxiliary load consumes a significantamount of fuel during real world on-road driving, this reinforces thePage 6 of 8Comparison of Auxiliary Load Results: On-roadOperation and Chassis DynamometerDynamometer testing was conducted on the various vehicle modelsto determine the auxiliary load power and energy consumption duringstandard drive cycles. These results are compared to the results fromthe on-road driving data collection and analysis. Additionally thedynamometer testing was conducted at three ambient temperatureswhich enables the analysis of temperature impact on auxiliary loadover standard drive cycles as well as comparison to the impact ofambient temperature on auxiliary load during on-road operation.During dynamometer testing the driver controlled accessories areused in accordance to standardized test procedures. For examplewhen testing at 23 oC ambient temperature, all accessories are placedin the off position including radio, lights, and HVAC controls. Fortesting at ambient temperatures of -7 oC and 35 oC, the HVAC isplaced in the automatic setting at 22 oC. In contrast, on-roadaccessory operation is chosen by the driver and can vary widely dueto personal preference.For comparison between on-road results and dynamometer results,the on-road driving route type percentage was determined for eachvehicle model as percent city driving and percent highway driving.This was determined using the SAE J2841 definition based onvehicle speed of 42 mph to distinguish between city and highwayoperation. Table 7 shows the percent on-road route type forcomparison to dynamometer test results from standard drive cycles.Table 7. On-road driving characteristics: city vs. highway driving routeVehicle ModelCityHighway2014 Mazda 3 i-ELOOP [12]47.0%53.0%2013 VW Jetta TDI [13]91.3%8.7%2014 Chevy Cruze Diesel [14]55.8%44.2%The dynamometer results from all of the vehicle models show theexpected trend of the minimum auxiliary load occurring at moderatetemperature (23 oC) and higher auxiliary loads at colder and hotterambient temperatures.Figure 11 shows the comparison of the dynamometer test results andthe on-road driving results for the 2013 VW Jetta TDI. It is observedthat the on-road results are within the range of the dynamometerINL/CON-15-37068
drive cycle results at 35 oC and -7 oC. It is likely that the on-roaddrivers chose to operate the HVAC controls to create a comfortabledriving environment which is similar to the HVAC settings duringdynamometer testing at 35 oC and -7 oC. In contrast the on-roadaverage auxiliary load is higher than dynamometer results at 23 oCagain likely due to the driver preference to use accessories andHVAC to create comfortable driving conditions.Figure 13. Dynamometer and On-road Comparison of Temperature Impact onthe 2014 Mazda 3 i-ELOOPFigure 11. Dynamometer and On-road Comparison of Temperature Impact onthe 2013 VW Jetta TDIFigure 12 shows the comparison of the dynamometer test result andthe on-road operation results for the 2014 Chevy Cruze Diesel. Theon-road results are comprised of an approximately even mix of cityand highway driving. The on-road results show reasonablecorrelation to the dynamometer results for the 23oC and -7oC testingfor the UDDS hot start and HWFET drive cycles but divergesignificantly at 35oC. The on-road results appear to show reasonablecorrelation to the US06 cycle at 35oC.The correlation between on-road results and dynamometer resultsshows the value from both data sources. One is a highly accurate andrepeatable industry standard, where the other is the actual operationduring real world driving with variability ranging from ambientconditions to driver’s choice of accessory operation. Together thecorrelation provides a high level of confidence on the data qualityand robustness.SummaryVehicle auxiliary load data collection, analysis, and characterizationwere conducted on sixteen non-electrified vehicles as part of the U.S.Department of Energy’s Advanced Vehicle Testing Activity(AVTA). The information gathered in the study serves as a baselineto quantify future improvements in auxiliary load reductiontechnology. This study directly supports automotive manufacturers inregards to potential “off-cycle” fuel economy credits that are part ofthe U.S. CAFE regulations, in which credit is provided for advancedtechnologies that reduce the energy consumption from vehicleauxiliary loads.Data was collected during the on-road operation of the sixteenvehicles over a one-year timeframe, as
The four vehicle models in this study include the Volkswagen Jetta TDI, Mazda 3 i-ELOOP, Chevrolet Cruze Diesel, and Honda Civic GX (CNG). Four vehicles of each model are included in this; sixteen vehicles in total. Evaluation was conducted using a chassis dynamometer over standard drive cycles as well as twelve months of