Transcription
RHESSI DATA ANALYSIS SOFTWARE: RATIONALE AND METHODSR. A. SCHWARTZ1 , A. CSILLAGHY2,3,4, A. K. TOLBERT1 , G. J. HURFORD2 ,J. McTIERNAN2 and D. ZARRO51 NASA Goddard Space Flight Center/SSAI, Greenbelt, MD 20771, U.S.A.2 Space Sciences Laboratory, University of California, Berkeley, CA 94720, U.S.A.3 Institute of Astronomy, ETH Zurich, CH-8092 Zürich, Switzerland4 University of Applied Sciences, CH-5210 Windisch, Switzerland5 NASA Goddard Space Flight Center/L3 Corp., Greenbelt, MD 20771, U.S.A.(Received 14 September 2002; accepted 16 September 2002)Abstract. The Reuven Ramaty High-Energy Solar Spectroscopic Imager (RHESSI) performs imaging spectroscopy of the Sun with high spatial and spectral resolution from 3 keV to 17 MeV usingindirect Fourier-transform techniques. We review the rationale behind the RHESSI data analysissoftware, and explain the underlying structure of the software tools. Our goal was to make the largedata set available within weeks after the RHESSI launch, and to make it possible for any member ofthe scientific community to analyze it easily. This paper describes the requirements for the softwareand explores our decisions to use the SolarSoftWare and Interactive Data Language programmingpackages, to support both Windows and Unix platforms, and to use object-oriented programming. Wealso describe how the data are rapidly disseminated and how ancillary data sets are used to enhancethe RHESSI science. Finally, we give a schematic overview of some of the data flow through thehigh-level analysis tools. More information on the data and analysis procedures can be found at theRHESSI Data Center website, http://hesperia.gsfc.nasa.gov/rhessidatacenter.1. IntroductionThe Reuven Ramaty High-Energy Solar Spectroscopic Imager (RHESSI) is aNASA Small Explorer (SMEX) mission to study the acceleration and transportof high-energy particles in solar flares (Lin et al., 2002). Observationally this isaccomplished by high-resolution imaging spectroscopy of X-rays and gamma-raysfrom 3 keV through 17 MeV. This energy range requires the use of indirect imaging techniques. In this case a set of rotating modulation collimators encodes theimaging information into a time-modulated lightcurve (Hurford et al., 2002). Aprimary function of the data analysis software is to decode this modulated waveform back to a quantitative estimate of the original image. An additional challengeis the recovery of high-resolution spectra that require background subtraction andthe deconvolution of the instrument response to yield the incident spectrum as afunction of time with 1 keV resolution up to 100 keV (increasing to 5 keV resolution at 17 MeV). Additional data products include the generation of conventionallight curves (parameterized by energy), and imaging spectroscopy in the form offeature-based light curves and spectra.Solar Physics 210: 165–191, 2002. 2002 Kluwer Academic Publishers. Printed in the Netherlands.CDROM
166R. A. SCHWARTZ ET AL.This type of imaging spectrometer poses several distinct challenges and opportunities in the design of a data analysis system. The first challenge arises from thelarge volume of information that must be processed to make either the basic imagesor spectra. The imaging and spectroscopy both start from a Level-0 database of 4byte ‘photon-tagged events’ that encode the detector ID, arrival time, and energyfor each detector count, as well as some live-time information (Curtis et al., 2002).(We refer to these events as photon events in this paper, although they includeparticle events as well.) The data set for some flares consists of hundreds of millionsof these photon-tagged events, with rates up to a half million per second. Once calibrated using the aspect solution, the modulated count rates contain information thatis equivalent to a set of Fourier components of the source distribution. From thatstage, the image reconstruction task is comparable to that in radio interferometry.One helpful factor is that (unlike the case of radio interferometry) the RHESSIinstrument response does not vary significantly with time. However, imaging spectroscopy, achieved by the interpretation of data cubes resolved into spatial, energy,and temporal coordinates, does place stringent requirements on the photometricaccuracy of the resulting images.A second challenge is posed by supporting the fraction of the RHESSI usercommunity not familiar with either indirect imaging techniques or with many ofthe instrumental issues associated with X-ray or gamma-ray spectroscopy. Thisis particularly important since the RHESSI data are made freely available onlinewithin a few days of observation and it is imperative that interested users be ableto analyze the data without waiting for secondary databases to be generated. At aminimum, they should be able to obtain lightcurves and to reconstruct images andphoton spectra with minimum knowledge about the inner workings of the software.Therefore, it is essential that the user interface provide the option of performing theimage reconstruction or spectral acquisition in a manner that does not burden suchusers with the details of those processes.A third challenge is that the RHESSI mission relies on data obtained in otherwavelength regimes by other instruments to provide the context information onwhich much of the RHESSI science is dependent. Therefore, special emphasisis placed on enabling convenient comparisons with external data sets. This lattertask is eased somewhat by the intrinsic absolute accuracy and stability of RHESSIimage locations to 1 arc sec and times to one millisecond.A unique opportunity is also afforded by the photon-tagged nature of theRHESSI data set. In most imaging-spectroscopy instruments, difficult tradeoffsmust be made during the instrument design phase or during operations to optimize the allocation of finite telemetry resources in order to meet the conflictingrequirements of imaging field-of-view and resolution, energy range and resolution,temporal coverage and cadence, etc. Since the RHESSI telemetry includes the arrival time, detector, and energy for each detected photon, all of these spectrometerchoices can be made during the data analysis phase. Therefore, such decisionscan be made iteratively and on a case-by-case basis in response to the unique
RHESSI DATA ANALYSIS SOFTWARE: RATIONALE AND METHODS167characteristics of the solar event under study and in response to the user’s particularscientific objectives. This unique capability greatly enhances the scientific returnfrom the observations. Therefore, a key driver of our data analysis approach is thepreservation of this flexibility for use by the data analyst.A further opportunity arises because the RHESSI imaging data are self-calibrating to a significant extent. Because of this and the expectation that the calibrationsand imaging algorithms will become more refined over time, we anticipate significant improvements to the RHESSI image reconstruction during the course of themission. The photon-tagged nature of the data set then permits these improvementsto be applied retroactively to the entire mission data set.To maintain the flexibility to choose time, energy, and imaging parameters andto conveniently exploit the anticipated improvements in calibration and algorithms,the generation of extensive secondary databases is minimized. Instead, most scientific analysis begins with the primary database with the most current calibrationinformation. The software applies such calibration data to yield images and spectrawith the most appropriate time, spatial, and spectral resolution and spectral range.Other factors that define the data analysis approach are that the user interfaceand analysis kernel should support both interactive analysis and multi-event batchprocessing. It was also deemed a requirement to support both Unix and Windows platforms. Finally, event-driven science, such as flare observations, placesan additional premium on the rapid dissemination of both data and software.2. Meeting the Science Requirements2.1. DATABASE PREPARATIONBefore we discuss the top-level and underlying structure of the RHESSI software,we briefly describe the data products that we archive online to facilitate scientificstudy. These data products provide the entry point to any scientific study, and helpguide the more detailed analyses required by most users. Another category of dataproducts is created dynamically according to the needs of the analyst and we willdescribe them together with the software architecture in the sections that follow.The first component of the archived data products is a database of observationsand calibrations that can be used to meet the scientific objectives. The primarydatabase includes the following principal elements: packed photon-tagged eventlists; Solar Aspect System (SAS) and Roll Aspect System (RAS) data; Monitor Rates; Fast Rate Counter output (when appropriate); and housekeeping data.The Monitor Rates consist of one-second readouts of various detector events thatgive the operators a picture of the detector status and environment. The Fast RateCounters contain broad energy-band event rates suitable for imaging during thelargest solar flares that might paralyze the normal detector electronics. The SASand RAS packets contain the aspect sensor data that allow us to know the modulation response at any location on the Sun as a function of time (Zehnder et al.,
168R. A. SCHWARTZ ET AL.2002). All of these data are included within our Level-0 data files. Except forsome header information to make the primary database appear as a sequence oftime-ordered, non-duplicated, and quality-flagged data, the primary database hasno ‘value-added’ content over the raw telemetered data. To ensure prompt preparation, the primary database is generated without routine operator intervention inthe Mission Operations Center and Science Operations Center (MOC/SOC). TheLevel-0 packets are organized into FITS files up to 110 Mbytes in length covering no more than a single orbit between local midnights. During flares, with theirhigher data rate, there are often multiple files per orbit. The FITS format, for whichthere is a large and well-tested library of low- and high-level routines, is used tofacilitate the documentation and the addition of useful tables within FITS extensions and completely preserves the telemetry packets. The first extension is a tableof the packet headers, containing the packet number, packet type, and time rangeincluded. As each FITS file is completed by the MOC/SOC, the file is copied tothe archive centers at Goddard Space Flight Center and the Swiss Federal Instituteof Technology in Zürich, Switzerland (ETHZ) over the Internet and made availablethere for anyone to download.Another archival component is the ‘quicklook products’ (QLP). These allowa quick survey via low-resolution lightcurves, spectra, and images. These are theLevel-1 data products created by the MOC/SOC autonomously using the samesoftware used for higher-level analyses. These are also referred to as catalog orsummary data. Summary quantities describing the instrument status and spacecraftposition, flare positions, flare meta-data, and data quality are included, too. AllQLPs are created both as FITS files (or extensions) and browser-viewable imageformats such as GIF, PNG, and text files. The SOC posts the most recent QLPson the RHESSI web pages as they are created. On the web page, any user caneasily access the entire QLP archive for either the graphic format or FITS formatfiles. Additionally, a simple summary event catalog will be available for browsingand for searching via a web page. The browser-viewable products are well suitedto public access, since no special analysis skills or RHESSI-specific software arerequired. We have also developed a software interface to the QLPs for use duringanalysis sessions. (As of August 2002, the QLPs are included with the Level-0 data,but in the near future, the QLPs will only be written to separate files and not to theLevel-0 files. This difference should be transparent to anyone using the summarydata on the Web or through the analysis software.)2.2. S OFTWARE TO MEET THE SCIENCE REQUIREMENTSConceptually the solar X-ray and gamma-ray input to RHESSI is in the form ofa data cube dimensioned along four axes: two spatial, one for energy, and theother for time. The action of the instrument transforms this incident data cubeof real photons into a time-ordered list of photon-tagged events. In this list, thespatial (more accurately angular) dimensions have been convolved into a temporal
RHESSI DATA ANALYSIS SOFTWARE: RATIONALE AND METHODS169modulation, and the true photon energy distribution has been convolved with thedetector response. Although some of the spatial structure of the true data cube canbe inferred from the temporal modulation, without the use of high-level softwareit basically appears only as a temporal modulation. In contrast to this, much of thespectral information can readily be seen in the photon-event lists binned in timeand energy. This contrast suggests that the requirement for complete flexibility inthe energy dimension for building images makes the data management task evenmore difficult for imaging. Thus, it is the full imaging spectroscopy task that hasdriven much of the structure of the data analysis software in order to meet our goalof a robust system capable of producing results for the general scientific user.One of the first decisions the software team made was to build our systemaround SolarSoftWare (SSW) (Freeland and Handy, 1998) and the Interactive DataLanguage (IDL). Both SSW and IDL have a long heritage for solar data analysis,both are used extensively throughout Solar Maximum Mission (SMM), Yohkoh,and Solar Heliospheric Observatory (SOHO). SSW is a package of IDL programming utilities and libraries to facilitate the data input/output, manipulations, andcomparisons needed for a data set obtained with a solar instrument. Moreover,most of the scientific software team for RHESSI had extensive experience withboth the IDL language and the programming environment created using standardSSW setup procedures. SSW includes installation and update procedures to ensurethat users will have the correct and current software environment for RHESSIanalysis. Also, because of the wide usage of IDL for other missions, we believethat the commercial license required for IDL imposes a mild constraint on thecommunity compared with the effort that would be required by the team and thescientific community to use any alternative. IDL provides tools to build GraphicalUser Interfaces (GUIs) which we believe are critical to creating a wide communityof users. These are simpler to operate and do not have the burden of syntacticstructures. From the beginning, we decided to fully support two of the operatingsystems supported by IDL, Unix/Linux and Windows, for several reasons. Therehas been and continues to be a large installed base of Unix servers, there is anincreasing number of institutions deploying personal computers using Linux, andthere is a large and growing base of users analyzing data on personal computers,in particular laptops, using all variants of Windows since Windows 95. At the timewe started, there was minimal support for Windows within SSW. The RHESSIteam has been a dominant contributor in making the joint utilization of SSW, IDL,and Windows routine seamless since then. We have found that personal computers running either Windows or Linux make the most cost-effective platform forRHESSI analysis. At present, we do not provide explicit support for the Macintoshoperating system because it lacks the environment variables relied on by SSW. Weexpect that RHESSI software will work on the newest Macintosh operating systems(very Unix-like) supported by IDL version 5.6 and beyond.The approach of the RHESSI data analysis scheme is to create a robust systemthat allows the routine production of Level-2 photon-calibrated images and spectra
170R. A. SCHWARTZ ET AL.by any scientist given the Level-0 FITS files, the QLPs, the calibration database,and the software installation. The RHESSI team members interact with the data setin the same way. Recalling our incident data cube of solar photons, the software’stask is to take the analyst’s specification of the resolution and range for the component desired, i.e., spectrally resolved image, spectrum, or lightcurve, and completethe processing required for the associated data product. Here we list the specificrequirements of our software:(1) The software must deal with large volumes of data, potentially processingnearly four Gigabytes of photon-tagged events to obtain a spectrogram coveringa large flare, and do this with the relatively modest resources found on commonnotebook computers.(2) The software must unerringly guide the user through the various processesneeded to complete a task based only on the properties of the result such as rangeand resolution along the data cube axes.(3) The software must be efficient. Some operations are very costly in timeand other resources. The results of costly operations should be saved and reusedwherever possible.(4) The software must allow the recovery of intermediate data products to facilitate testing and debugging. This feature also allows building complex chains ofprocessing from smaller and simpler elements.(5) The action of the software must be highly configurable by user-selectedparameters and algorithms, yet require only a few changes from its default configuration to produce meaningful results.(6) The software must be callable from a command line interface (CLI) tofacilitate scripting of repetitive actions.(7) There must be a graphical user interface (GUI) to reduce the need for ananalyst to learn our programming syntax.3. Object-Orientation in the RHESSI Data Analysis SoftwareThe architecture of the RHESSI data analysis software is based on object-orienteddesign concepts. In this section we explain what we mean by object-orientation,show how we implement this design technique in the RHESSI software, and showwhy we believe that the object-oriented approach helps us meet our software requirements.3.1. O BJECT- ORIENTED SOFTWAREObject-oriented programming describes a standard way of designing software inwhich the software is divided into independent parts – the objects – that communicate through well-defined interfaces. Object-oriented design can be seen as arealization of the ‘divide and conquer’ rule that has been driving software development for the past two decades: complex problems are easier to solve by first
RHESSI DATA ANALYSIS SOFTWARE: RATIONALE AND METHODS171dividing them into smaller, isolated problems. We refer to Booch (2002) for adiscussion of object-orientation, or to Schach (2001) for a software engineering approach to the topic. An online resource on object-orientation is given by AppendixItem 11.Object-oriented design has been used successfully in numerous programs, fromoperating systems to text editors. Today, it is the main support for the deploymentof Web applications. Surprisingly, object-oriented design has been used little fordeveloping data analysis systems in solar physics, even though this field has traditionally been in the lead for innovative computer technologies. We see three reasonsfor this: (1) Scientific data analysis systems are complex, and object-oriented codeis harder to develop than ‘procedural’ code. These two characteristics collide. Therewards of object-oriented code come in the long term, but short-term considerations often prevail in scientific software development. (2) The vendor of IDL, themain data analysis programming language in solar physics, only recently introduced the object-oriented software syntax, delaying the build-up of experience inthis domain. (3) There is a large amount of legacy, non-object-oriented software,available. There is a (false) tendency to think that object-orientation prevents thereuse of this existing code.Object-orientation does not replace procedural programming, it extends it. Objects are containers for the data types used in an application and for the operations– also called methods – that apply to them (Gamma et al., 1995). The data withinan object can only be accessed through a limited number of access methods, whichdefine the interface for that object. This is the principle of encapsulation: all operations on a data type are associated with the object that contains this data type.Furthermore, new objects can extend already existing objects. This is the principleof inheritance: an object that extends another object inherits all its definitions, i.e.,the extended object can use all data types and methods defined in the basis object.3.2. O BJECT- ORIENTED DESIGN APPLIED TO RHESSIThe RHESSI software was built to take advantage of the many strengths of objectoriented programming. One drawback is the current unfamiliarity of the syntax tomany members of the user community. However, subsequent experience has shownthat this is quickly overcome and of course it does not apply at all to those usingthe RHESSI graphical user interface. Other drawbacks for developers unfamiliarwith the programming techniques are discussed in Section 6.The advantages gained include minimizing the amount of processing requiredby keeping track of and reusing intermediate products, shielding the user frominternal data analysis details (although all intermediate products are available),reusing of code for generic object-handling functions, and supporting both interactive and batch processes easily. The next section describes these advantages morefully. All of these features could be implemented with standard procedure-drivencode, but it would be clumsier, require more coding and testing, and probably
172R. A. SCHWARTZ ET AL.TABLE IA list of the main RHESSI data products.TypeObject nameProductMain RHESSI data productshsi imagehsi lightcurvehsi spectrumImagesLightcurvesSpectraData products associated with a hsi cleanspecific image algorithmhsi forwardfithsi bprojImages processed by the CLEAN algorithmImages processed by the Forward FittingalgorithmImages processed by the Pixon algorithmImages processed by the Maximum Entropyalgorithm (MEM SATO)Images processed by the Maximum Entropyalgorithm using visibilitiesBack-projection imageshsi psfhsi modul profilehsi modul patternhsi calib eventlisthsi binned eventlisthsi eventlisthsi packetPoint spread functionModulation profilesModulation patternsCalibrated event listsBinned event listsEvent listsTelemetry packetshsi pixonhsi mem satohsi memvisIntermediate data productsburden the analyst with keeping track of parameter changes and how that affectsthe reuse of intermediate products.Now we discuss how we apply the concepts of objects to accomplish the goalsof the RHESSI software. There are three top-level objects to handle the three primary RHESSI data products – images, spectra, and lightcurves. These three objectsemploy a set of intermediate data products for each step of the processing cycle:data retrieval, accumulation, time binning, energy binning, aspect calculation, image reconstruction, etc. These data products are listed in Table I. Each data productis associated with an object. Thus, there is a packet object, an event list object, etc.These intermediate objects are created when necessary and stored within the threeprimary objects. The RHESSI data analysis software can be considered as a chainof objects. To arrive at the final product, a chain of transformation of data productsoccurs.Every object in the chain has identical access methods: a Set method for settingparameters in the object, a Get method for extracting parameters from the object,and a GetData method for processing and retrieving the primary data of the object.
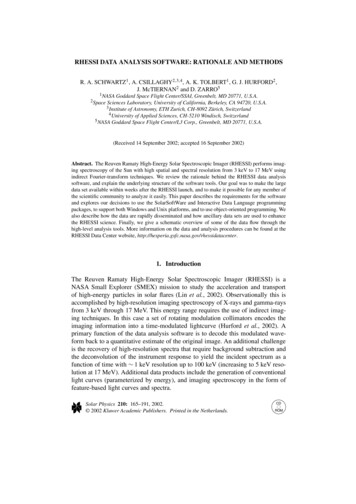
RHESSI DATA ANALYSIS SOFTWARE: RATIONALE AND METHODS173A standard interface object called Framework was written to handle these methodsso that access to every object (and hence data product) is the same. The frameworkobject is reused (i.e., inherited) by each individual data product object to handlethe generic parts of the access methods. The data product-dependent code (thetransformation algorithm itself) is embedded into the process method of the specificobject.First, we will outline the steps an analyst would take to create an object andretrieve data from it, and then we will discuss the operation of the objects. We willuse image reconstruction as an example (lightcurve and spectrum generation aresimilar). We proceed as follows:(1) An instance of an image object is created. This creates a reference (a variablename) to an object and initializes all of the control parameters in the object todefault values. At the SSW IDL command prompt, the command used isobj hsi image()(2) Parameters that need to be changed from the default are set via the Setmethod. We will usually want to set values for the time interval, energy range,spatial resolution, and position of the field of view on the Sun. For example, to setthe position of the field of view, the command used isobj Set, xyoffset [ 900., 250.](3) The image that corresponds to the current setting of the parameters is retrieved using the GetData method. If necessary, the image is processed, followingthe data transformation chain mentioned above.data obj GetData()(4) Parameters that give information about what happened during image generation can be retrieved using the Get method:params obj Get()There are two general classes of parameters – control parameters that the usersets to specify the data requested, and information parameters that are set by theobject to show what happened during the processing of the data. Any of theseparameters can be retrieved using the Get method. An important feature of gettingand setting parameter values in RHESSI objects is that because objects are chainedtogether with framework, the parameters can be set and retrieved from any objectin the chain. For instance, we can set the image dimension (associated with themodulation pattern object) in the same way that we set the time range (associatedwith the event list object), both with the Set method of the image object.Now we return to the chain of transformations of data products initiated bythe GetData method. In this chain, telemetry packets are transformed into eventlists, which are transformed into binned event lists, which are transformed into
174R. A. SCHWARTZ ET AL.Figure 1. Image creation diagram. This figure shows the chain of transformations for an imagereconstruction. The name of the object (or in some cases, program) corresponding to each task isshown in parentheses. The final products are in the darker gray boxes.calibrated event lists, back-projections after including the modulation patterns, andfinally images. This chain is shown in Figure 1.When an image is requested, the image object checks whether it already contains an image corresponding to the current parameter setting. If it does, this imageis returned to the user without any further processing. If it does not, the object needsto process a new image. To do this, it relies on several intermediate data objects.One way an image can be processed is by summing up back-projection maps, thebasis of the RHESSI image reconstruction method (Hurford et al., 2002). Thus, theimage object relies on a back-projection object, which is responsible for buildingback-projection maps. Other objects of interest for the image object include those
RHESSI DATA ANALYSIS SOFTWARE: RATIONALE AND METHODS175implementing the different image algorithms (Forward Fit, MEM, Pixon, Clean,MemVIS), as shown in Figure 1.The back-projection object now proceeds in a similar fashion. It first checkswhether it contains back-projection maps corresponding to the parameter settings.If it does, these data are returned to the image object without further processing. Ifit does not, the object needs to process new back-projection maps. Back-projectionmaps are processed by building a set of modulation patterns weighted by the binnedphoton counts. Thus, the back-projection object relies on a modulation patternobject, which is responsible for processing the modulation patterns specific to aspatial and spectral resolution.This process continues along the chain of objects, from the image to the Level-0data files, with each object returning either previously-processed or newly-processeddata products as required.As for the access interface, the framework in which these transformations occuris the same for all steps in the chain. It is ‘only’ the data product in considerationthat changes. Thus, the Framework object implements the generic part of the software (therefore, the name Framework). Extensions of the Framework implementthe data product-dependent code.3.3. B ENEFITS OF OBJECT- ORIENTED DESIGN FOR RHESSIWe believe that the data analysis software is more structured, efficient, maintainable, and extendable by using object-oriented techniques than it would be withtraditional procedural software for the following reasons:Minimized reprocessing: The Framework object also implements the reprocessingpolicy. Whenever a parameter is set, the Framework checks the parameter valuepassed. According to the reprocessing policy, the Framework decides whether thedata already generated in the object are consistent with the parameter settings. Ifnot, the Framework sets a flag to regenerate the data at the time of the next request.This strategy allows not only for updating the data only when it is necessary, butalso for waiting until a request comes to generate any new data product.Shielded details: Shielding the user from the burdensome details of data analysisis accomplished by enabling the user to access data in a simple and obvious way.Access to a data product should involve as few commands as possible and theanalyst s
information. The software applies such calibration data to yield images and spectra with the most appropriate time, spatial, and spectral resolution and spectral range. Other factors that define the data analysis approach are that the user interface and analysis kernel should support both interactive analysis and multi-event batch processing.