Transcription
Civil Justice ReportNo. 10 May 2006Medical Malpractice Awards, Insurance, andNegligence: Which Are Related?Alexander TabarrokDepartment of Economics, George Mason UniversityandAmanda AganDepartment of Economics, George Mason UniversityC L PC E N T E RF O RL E G A LP O L I C YAT THE MANHATTAN INSTITUTE
Civil Justice Report May 2006
Medical Malpractice Awards, Insurance, and Negligence: Which Are Related?Table of ContentsAbout the Authors.IExecutive Summary.IIIIntroduction.1Malpractice Premiums and Awards Across Time.2Figure 1: Premiums Track Awards Over Time.2Medical Malpractice Awards and Premiums Across the States.4Figure 2: Medical Malpractice Awards Per Doctor.4Figure 3: Premiums Are Higher in States with Higher Awards Per Doctor.5Profiteering, Greed, and Gouging?.6Figure 4: Premiums Are Lower in States with Higher Concentration Ratios.7What’s Driving Awards.6Table 1: Explaining Variation in Awards and Claims Per Doctor.8An Alternative Method for Determining Malpractice.9Figure 5: The Tort System and the Review System Are Not Highly Correlated.11Conclusion.12References.iRegression Appendix .iiiCointegration .iiiTable A1.iiiPremiums and Awards.iiiTable A2: Premiums Are Higher in States with Higher Awards Per Doctor.ivPremiums and Concentration Ratios.ivTable A3: Higher Concentration Rates Lower Insurance Premiums.ivMultiple Regression: Premiums, Awards, Concentration Ratios and PCFs .vTable A4: Premiums Are Higher in States with Higher Awards Per Doctor,Multiple Regression.vAdverse Actions Per Doctor.viTable A5: Variation in Adverse Actions Per Doctor is Not Associated withPercent Below Poverty Level or Partisan Judicial Elections.viTable A6: Means and Standard Deviations. viiMay 2006
Civil Justice Report May 2006
Medical Malpractice Awards, Insurance, and Negligence: Which Are Related?About the AuthorsALEXANDER TABARROK is associate professor of economics at George Mason University anddirector of research for The Independent Institute. His recent book (with Eric Helland), Judge and Jury:American Tort Law on Trial, examines issues such as how race and poverty impact trial decisions byjuries, how judges compare to juries when awarding damages, and the influence of judicial electoralsystems on the decisions of judges. Professor Tabarrok is also the editor of the books EntrepreneurialEconomics: Bright Ideas from the Dismal Science, The Voluntary City: Choice, Community, and Civil Society(with David Beito and Peter Gordon), and Changing the Guard: Private Prisons and the Control of Crime.His papers have appeared in the Journal of Law and Economics, Public Choice, Economic Inquiry, the Journalof Health Economics, the Journal of Theoretical Politics, The American Law and Economics Review, Kyklos,and many other journals.Popular articles by Professor Tabarrok have appeared in magazines and newspapers throughoutthe United States. He writes regularly for the blog, Marginal Revolution.AMANDA AGAN conducts research on law, crime, housing, and other topics at George MasonUniversity, where she also studies economics.May 2006
Civil Justice ReportIIMay 2006
Medical Malpractice Awards, Insurance, and Negligence: Which Are Related?Executive SummaryDoctors’ medical malpractice liability insurance premiums are at an all-time high. As has beenwidely reported in the press, escalating med-mal premiums have driven doctors to retire early, shutdown their businesses, or reduce the scope of their practices. In areas of the country with particularlyhigh premiums, there is concern that patients’ access to care has been compromised.Insurance companies and most doctors conclude that the root cause of higher insurance costs ishigher tort awards. The American Medical Association, for example, says that medical liability reformis their top priority because “rapidly increasing medical liability insurance premiums caused by escalating jury awards are seriously threatening patient access to care.”On the other side of this debate are plaintiffs’ attorneys and their allied consumer groups whoattribute the boom and bust “insurance cycle” to investment returns and, alternatively, accuseinsurance companies of “price gouging.” Such claims are often picked up, uncritically, by the mainstream press.Our study makes four contributions to this debate:1. We show that medical malpractice premiums are closely related to medical malpracticetort awards. Over the long run, premiums closely track awards, and premiums adjust toshort-run award variation as well. Indeed, insurance companies’ short-run reaction toaward levels is the primary driver of the so-called insurance cycle. In addition, med-malpremiums are closely related to tort awards across states. The correlation in premiums andawards across the states suggests strongly that tort award levels, not investment returns,are the primary explanatory factor for changes in insurance premiums, since investmentreturns are unlikely to vary markedly across states.2. We show that medical malpractice premiums are not explained by insurance industryprice gouging. For the price-gouging hypothesis to make sense, insurance industries mustbe exercising monopoly power. Looking at insurance industry 4-firm concentration ratios—ameasure of market power—we find that states with more concentrated insurance industriesactually have lower premiums, even when controlling for other explanatory factors.3. We show that medical malpractice tort awards are related to some factors not rationallyrelated to injuries. For instance, states’ judicial electoral systems have predictive value onthe expected level of tort award.4. We show that malpractice tort awards and thus insurance premiums can vary dramatically for reasons having little or nothing to do with negligence. We reach this conclusionthrough a novel test of the tort system, in which we compare awards and rates of determination of negligence in the tort system with rates determined by the independent medicalboard review system. Although board review outcomes are imperfect, they are biased, if atall, against findings of negligence, because physicians will not allow frivolous complaintsto result in disciplinary actions. The tort system shows no or even a slight negative correlation with the board review system’s negligence determinations, suggesting that thesystem is influenced by factors not related to negligence.May 2006III
Civil Justice ReportIVMay 2006
Medical Malpractice Awards, Insurance, and Negligence: Which Are Related?Medical Malpractice Awards, Insurance, andNegligence: Which Are Related?IntroductionMedical malpractice premiums are at an all-time high.1 The American Medical Association (AMA)says that at least twenty states are experiencing full-blown liability crises, with twenty-two more showing signs of serious problems.2 Under pressure from the tort system some doctors have retired early,shut down their businesses, or reduced the scope of their practices.3 The U.S. Department of Healthand Human Services says that the liability crisis is threatening access to care and jeopardizing patientsafety.4What is behind the recent increase in premiums? On one side of the debate are insurers and doctors, who attribute the increase to higher malpractice tort awards. On the other side are attorneys andtheir allied consumer groups, who typically claim that insurers are exercising monopoly power to makeup for investment losses due to poor planning in the boom of the 1990s. Such claims are often pickedup, uncritically, by the mainstream press. For example, writing last year in The New York Times, JosephTreaster and Joel Brinkley argued that “legal costs do not seem to be at the root of the recent increasein malpractice insurance premiums,” which they attributed instead to the “nature of competition inthe industry.”5We make four contributions to this debate. First, we show that medical malpractice premiums areclosely related to medical malpractice awards through time and across the states. Second, we show thatpremiums are not explained by insurance industry monopoly power. Third, given our findings thatmalpractice insurance premiums are determined by tort awards, and that such awards vary substantiallyacross the states, we ask what factors determine award variation. For example, are states with highawards and premiums like teenagers who face high auto insurance premiums because of high accidentrates, or are awards and premiums high because of factors not rationally related to underlying risks? Weshow that awards are related to some factors (such as judicial electoral systems) not rationally relatedto injuries. Finally, in a novel test of the tort system, we compare awards and rates of determination ofnegligence in the tort system with rates determined by the independent board review system. The testresults suggest that awards and thus insurance premiums can vary dramatically for reasons havinglittle or nothing to do with negligence.1. See Congressional Budget Office (2004); Medical Liability Monitor (2004).2. See American Medical Association (2006).3. For some anecdotal evidence, see U.S. Dept. of Health and Human Services (2002). Baker (2005) offers a contrary but balanced discussion. Kessler et al. (2005), Encinosa and Hellinger (2005), Helland and Showalter (2006), andKlick and Stratmann (2005) estimate the effect of liability on physician entry and exit decisions.4. See U.S. Dept. of Health and Human Services (2002), pp. 2-4.5. Treaster and Brinkley (2005); see also Americans for Insurance Reform (2002). Baicker and Chandra (2005) say,“[I]ncreases in malpractice payments do not seem to be the driving force behind increases in premiums” (p. 31).May 2006
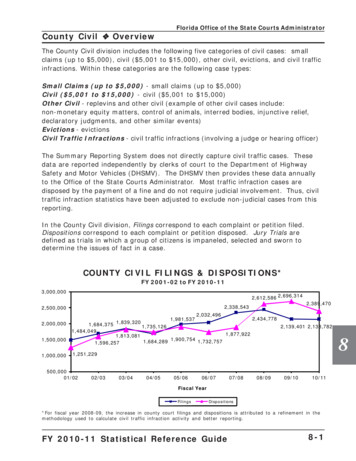
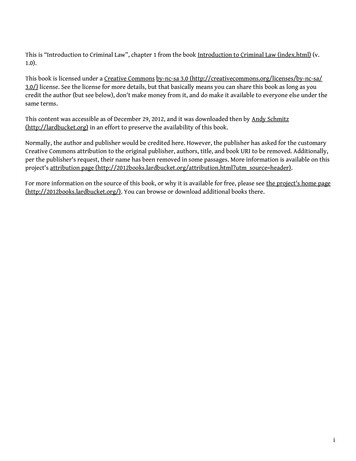
Civil Justice ReportFigure 00012000Premiums Track Awards Over ractice Premiums and Awards Across TimeIn their New York Times article, Treaster and Brinkley (2005) use a graph, shown as the left graph inFigure One, that they claim supports their position that medical malpractice premiums have “outpacedthe rise in payments for claims.” The graph does indeed show that premiums are more variable thanawards/payouts and thus may increase (or decrease) in some periods faster than awards. But this factis not inconsistent with the idea that awards drive premiums. We can demonstrate the latter pointmost easily by rescaling the axes to overlay the two lines, as shown in the right graph. The rescalinghas two virtues. First, the graph used in The New York Times encourages a naïve interpretation that thedistance between the premiums and awards line represents profits. In fact, the graph does not showthe administrative and legal costs of settling claims and defending cases that do not win, so one cannotdraw any conclusions about profits from the graph. Second, and more important, the rescaled graphmakes it easier to see that premiums oscillate around awards: sometimes the premium line is abovethe award line and sometimes it is below; but over time, the two lines move in tandem.To test the proposition that malpractice premiums followed awards over time, we performed a“cointegration test” on the data used to create the New York Times graph, which came from the insurance rating agency A.M. Best.This statistical analysis demonstrated that premiums and awards are“cointegrated,” that is, linked in a stable long-run relationship.6 We also note that the data confirmthat variations in awards drive premiums. The reason is that whenever two variables are cointegrated,6. The cointegration test formally demonstrates the stable long-run relationship between premiums and awards,which exists although neither premiums nor awards show any tendency to return to their own means over time. May 2006
Medical Malpractice Awards, Insurance, and Negligence: Which Are Related?there is an associated error-correction mechanism that determines what happens when the two variables depart from their long-run relationship. In this case, the theoretical error-correction mechanismis easy to see: if premiums in the insurance industry long exceed awards (plus expenses), competitionwill drive premiums down; and if premiums long fall below awards (plus expenses), bankruptcy, exit,and survival behavior will drive premiums up. Thus, premiums should adjust to awards. And becauseawards are determined by tort law and judge and jury behavior, there is little reason to believe thatawards will adjust to premiums. Looking at the data, we see exactly this result in the error-correctionmechanism: premiums respond rapidly to changes in awards but awards do not respond to changesin premiums.7Premiums track awards in the long run but may depart from awards in the short run. This variationdoes not necessarily imply that factors other than awards are important determinants of premiums inthe short run. Today’s premiums must cover future awards, which are unknown. As a result, insurancefirms set today’s premiums based upon their forecast of future awards. The cointegration test mentionedabove showed that there is no tendency for medical malpractice awards to fluctuate around a fixedmean, so past awards are not very useful for predicting future awards. Awards from a decade ago,for example, probably tell us very little about awards in the next decade. The most useful awards forpredicting future awards are the most recent ones, especially if these suggest a permanent change inthe level of awards. By definition, there aren’t many recent awards. Thus, insurance companies have avery difficult job: they must forecast future awards using only a few data points. Forecasts under theseconditions can be highly variable, even more variable than the series being forecast.8 Short-term departures of premiums from awards, therefore, should be expected even when awards drive premiums.Plaintiffs’ lawyers and “consumer advocacy” groups often blame periodic liability crises on the“insurance cycle” rather than on changes in tort awards. A group called Americans for Insurance Reform (AIR) is representative of this line of thinking:Not only has there been no real increase [in] lawsuits, jury awards or any tort systemcosts at any time during the last three decades, but the astronomical premium increasesthat some doctors have been charged during periodic insurance “crises” over this timeperiod are in exact sync with the economic cycle of the insurance industry, driven byinterest rates and investments. In other words, insurance companies raise rates whenthey are seeking ways to make up for declining interest rates and market-based investment losses.9But tort awards and the insurance cycle are not competing explanations for increases in premiums.As described above, the insurance cycle itself is a consequence of the unpredictability of tort awards.10Thus, trying to dampen premiums by regulating other things—J. Robert Hunter, director of Insurancefor the Consumer Federation of America, urges state regulators to “enforce the ratings laws in order toend the boom and bust swing”—is likely to be futile.11 The best way to reduce the volatility of premiumsis to reduce the volatility of awards. The more predictable future tort awards are, the more predictableinsurance premiums will be.7. See the Regression Appendix for details.8. For a formal proof of this proposition, see Kleidon (1986). Industry forecasts of losses are often incorrect, illustrating the difficulty in forecasting.9. AIR (2002). For a critique of AIR’s statements and studies, see Frank and Grace (2006).10. Other factors, such as changes in interest rates and the long time lag between premiums and payouts, amplifythe cycle, but it is the underlying uncertainty in awards that is the driver of the cycle.11. J. Robert Hunter, quoted in AIR (2006).May 2006
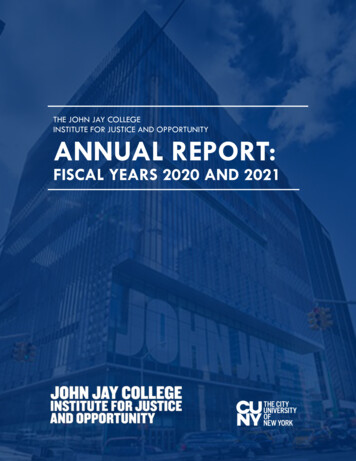
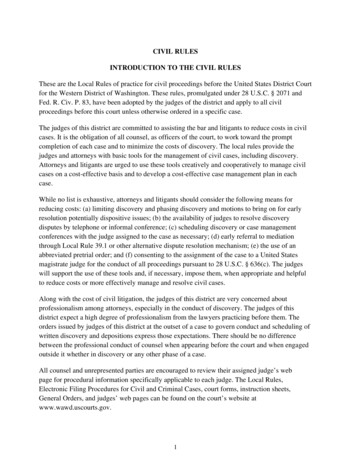
Civil Justice ReportMedical Malpractice Awards and Premiums Across the StatesWe can factor out much of the short-run variability in premiums and awards across time by lookingat the relationship across the states at a single point in time. Figure Two is a map of mean malpracticeawards per doctor per year (averaged over 1999-2001). States with high mean awards are in green,and states with low awards are in gray. The variation in the average award per doctor is surprisinglylarge: mean awards range from a low of 1,688 in Wisconsin to a high of 10,025 in Pennsylvania.12 Itis highly doubtful that medical errors and malpractice are six times more common and egregious inPennyslvania than in Wisconsin. Later we examine whether factors related to patients or physicianscan explain these striking differences.Figure TwoMedical Malpractice Awards Per DoctorUnited States 1999-2001 Average 1,658—2,878 2,878—3,388 3,388—4,488 4,488—5,418 5,418—6,597 6,597—10,025ALASKAHAWAII00500 Miles500 Km00100 Miles100 Km12. The effect of interest rates on the so-called insurance cycle is a national-level phenomenon, so the fact thatawards vary significantly across the states is strong evidence that the insurance cycle alone, as interpreted byconsumer groups, leaves much variation in awards to be explained. May 2006
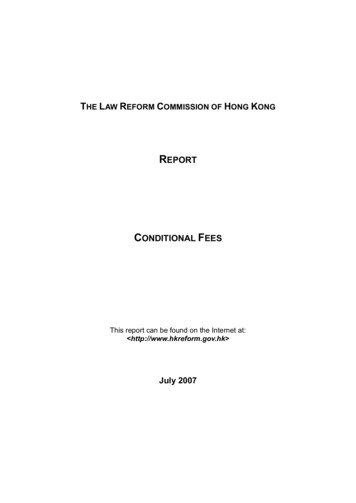
Medical Malpractice Awards, Insurance, and Negligence: Which Are Related?Figure Three10000 20000 30000 40000 500000Med-Mal Insurance Premiums ( )Premiums Are Higher in States withHigher Awards Per Doctor200040006000800010000Awards Per DoctorThe large variation in awards lets us test whether variation in awards is associated with variationin premiums. Figure Three graphs awards per doctor against premiums and finds a strong positiveassociation.13States with higher awards per doctor, simply put, have higher insurance premiums. This positiverelationship remains even after we control for other variables that may affect insurance premiums in agiven state, such as the 4-firm concentration ratio, the number of medical malpractice cases per doctor,and whether a state has a patient compensation fund (see Regression Appendix, Table A4).13. Data on medical malpractice premiums are usually calculated on a state level. In some states, the Medical Liability Monitor breaks the data down into somewhat finer geographic regions. Where this is done, one also often findsa strong relationship between awards and rates. Bovbjerg and Bartow (2003) take a detailed look at Pennsylvania, forexample, and note: “The highest Pennsylvania rates (usually in Philadelphia) are about double the lowest rates forany given insurer” (p.14). They also examine tort awards and note “the special case of Philadelphia,” where “24% ofverdicts awarded [are] in excess of 1 million.” (p.32). Note also that Philadelphia has the highest poverty rate of anycounty in Pennsylvania; see Helland and Tabarrok (2003) and below for the importance of this fact.May 2006
Civil Justice ReportProfiteering, Greed, and Gouging?In addition to blaming recent spikes in medical malpractice premiums on the “insurance cycle,”trial lawyers and their advocates are wont to accuse medical malpractice insurers of “illegal pricing.”Connecticut attorney general Richard Blumenthal calls for “more aggressive oversight to prevent andpunish profiteering”:Federal and state regulators should thoroughly scrutinize recent rate increases and takeappropriate corrective action. Affordable medical malpractice insurance is critical topublic health. Expensive insurance rates become a matter of life and death when theydrive doctors out of business—as is happening in Connecticut Insurance companygreed can be hazardous to our health.14Echoing Blumenthal, AIR’s J. Robert Hunter argues that “insurance companies are price-gouging theirdoctors.” 15A necessary condition for so-called price gouging is lack of competition.16 If price gouging is aproblem, therefore, we should find that prices are higher when there is less competition. To test theprice-gouging hypothesis, we calculated a measure of competition by state, the “4-firm concentrationratio.” A 4-firm concentration ratio of 60 percent, for example, means that together the largest four firmshave a 60 percent market share. If lack of competition is driving up rates, we should find a positiverelationship between medical malpractice premiums and the concentration ratio.Figure Four on the following page shows that, in contrast to the prediction of the price-gouginghypothesis, medical malpractice premiums decrease as the concentration ratio increases. Although thenegative relationship is not strong, we certainly do not find the positive relationship that we wouldexpect from the price-gouging hypothesis. Again, this negative relationship between medical malpractice premiums and the insurance industry concentration ratio holds, even after controlling for awardsand patient compensation funds (see Regression Appendix, Table A4).What’s Driving Awards?If medical malpractice awards are the major source of changes in insurance premiums, it is important to understand the factors that drive awards. If awards are primarily driven by factors that bear arational relationship to medical malpractice, the fact that awards are higher in some states than in othersmay simply show that the tort system is functioning properly. But if awards are higher in some statesthan in others for reasons having little to do with medical malpractice, we may question whether thetort system is doing its job. If awards vary for reasons other than malpractice, for example, they cannotbe acting as a deterrent, nor can they be providing just compensation.We test whether awards vary due to variations in true malpractice rates in two ways. First, we lookdirectly at whether variation can be explained by variables such as income per capita or infant mortality,variables that might plausibly be related to malpractice awards or rates, or whether awards are moreaffected by factors that are less plausibly related to true malpractice. Second, we conduct a novel testof the tort system by comparing it with the medical review system.Medical malpractice awards per doctor can be high for two reasons: either the average award perclaim is very high; or there are many claims per doctor (or both). Breaking medical malpractice awards14. Quoted in Center for Justice and Democracy (2005).15. Id.16. In a competitive market, sellers have no pricing power but must accept the market price, which equals longrun average cost. If prices exceed long-run average cost, new entrants will compete away excess profits until pricesare driven back to that level. May 2006
Medical Malpractice Awards, Insurance, and Negligence: Which Are Related?Figure Four10000 20000 30000 40000 500000Med-Mal Insurance Premiums ( )Premiums Are Lower in States withHigher Concentration Ratios405060708090Concentration Ratioper doctor into two components, the award per claim and the number of claims per doctor, is useful:some variables may affect awards and others the number of claims.17With only fifty states, the number of variables that we can examine is limited (because the number ofdata points limits what statisticians call “degrees of freedom”). Thus, we focus on the few that we thinkare most likely to be important or that have previously been shown to be important in the literature.We include the death rate and the infant mortality rate in our data. Although deaths are not necessarilyindicative of malpractice, it is likely that awards will be higher in cases involving death—and deathsmay, in themselves, encourage litigation. We include the percentage of people below the poverty levelbecause Helland and Tabarrok (2003, 2006) find that awards increase dramatically in relation to countypoverty rates. As county poverty rates increase from 0-5 percent to 20-25 percent, for example, Hellandand Tabarrok find that the average award triples from 400,000 to 1.2 million.18 Similarly, Hellandand Tabarrok (2002, 2006) find that awards are higher against out-of-state defendants in states usingpartisan judicial elections, so we include partisan elections as a potentially important variable.19 (Bothof the latter effects will be harder to pick up in state data than in the more disaggregated data used in17. Let MMPerDoc denote the mean malpractice award per doctor then MMPerDoc Awards/Doctors Awards/Claims*Claims/Doctors.18. One can see the same effect within states. See note 11 and Bovbjerg and Bartow (2003), for example.19. Helland and Tabarrok argue that elected judges are likely to be biased towards plaintiffs when the defendantis an out-of-state corporation because the plaintiff is a constituent while the defendant is not.May 2006
Civil Justice Reportthe cited papers.) Finally, awards are likely to be higher in states with higher per-capita income, forthe simple reason that economic damages will by definition be higher, all else being equal. The resultsare presented in Table 1.Table 1: Explaining Variation in Awards and Claims Per DoctorAward Per ClaimClaims Per DoctorDeath Rate Per 1,00010,399(5,636)*0.001(0.001)Infant Mortality (Deaths Per 1,000 Live Births)895(5,321)-0.0003(0.001)Percent Below Poverty Level-20(3,141)0.0014(0.0006)**Partisan Electoral System for JudgesPersonal Income Per 004(0.0004)-0.006(0.019)500.16Standard errors in parentheses* significant at 10%** significant at 5%*** significant at 1%Focusing first on the mean award per claim, we find that an increase in the death rate of one per1,000 (slightly smaller than one standard deviation) increases the mean award by 10,000. The infantmortality rate appears to have no effect on the mean award per claim, nor does the percentage of thepopulation living below the poverty level. States that use partisan elections to select their judges,however, have awards per claim on average 35,000 higher (about 18 percent) than states using othermethods to select their judges. As expected, awards also increase in relation to per-capita income. Anincrease of 4,000 in per-capita income (just over one standard deviation) increases awards by approximately 36,000.Turning to claims per doctor, we find that the only statistically significant relationship is that increases in the percentage of the population living below the poverty level are correlated with increasesin the number of claims per doctor. The effect is surprisingly large: an increase of one percentage pointin the poverty rate (one-third of one standard deviation) increases the number of claims per doctor byapproximately 6 percent.20The regression results are a mixed bag for our perspective on the tort system. Some of the variationin awards per claim can be explained by factors that rationally relate to awards, such as income per20. An increase of .0014 claims per doctor compared to the mean claims per doctor of .024 is approximately 6percent. (Running claims per doctor in logs produces a coefficient of 6.6 percent.) May 2006
Medical Malpractice Awards, Insurance, and Negligence: Which Are Related?capita and the death rate. But factors bearing little relationship to malpractice—such as whether a stateuses partisan elections to select its judges—appear to be at least as important. The R-squared statisticindicates that the variables in the regression can explain only 43 percent of the variation in awards perclaim, so a majority of the variation in awards remains unexplained, which is even more the case in theclaims per doctor regression, where we can explain only 16 percent of the variation.An Alternative Method for Determining MalpracticeTo further test the efficacy of the tort system, we exa
Medical Malpractice Awards, Insurance, and Negligence: Which Are Related? May 2006 1 mediCal malpraCTiCe awards, insuranCe, and negligenCe: whiCh are relaTed? IntroductIon Medical malpractice premiums are at an all-time high.1 The American Medical Association (AMA) says that at least twenty states are experiencing full-blown liability crises, with twenty-two more show-