Transcription
Public Disclosure AuthorizedPublic Disclosure AuthorizedPublic Disclosure AuthorizedPublic Disclosure AuthorizedWPS5758Policy Research Working Paper5758Who Is Benefiting from Fertilizer Subsidiesin Indonesia?Camilo Gomez OsorioDwi Endah AbriningrumEnrique Blanco ArmasMuhammad FirdausThe World BankEast Asia and Pacific RegionPoverty Reduction and Economic Management UnitAugust 2011
Policy Research Working Paper 5758AbstractUsing the Agricultural Census 2003 and the RiceHousehold Survey 2008 for Indonesia, this paperanalyzes the distribution of benefits from fertilizersubsidies and their impact on rice production. Thefindings suggest that most farmers benefit from fertilizersubsidies; however, the 40 percent largest farmers captureup to 60 percent of the subsidy. The regressive nature ofthe fertilizer subsidies is in line with research carried outin other countries, the result of larger farms using a largervolume of fertilizer. This paper confirms that fertilizerused in adequate quantities has a positive and significantimpact on rice yields, but it also provides evidence thatover-using fertilizer has an adverse impact on yields (aninverted U-curve relationship).This paper is a product of the Poverty Reduction and Economic Management Division, East Asia and Pacific Region. It ispart of a larger effort by the World Bank to provide open access to its research and make a contribution to developmentpolicy discussions around the world. Policy Research Working Papers are also posted on the Web at http://econ.worldbank.org. The author may be contacted at eblancoarmas@worldbank.org.The Policy Research Working Paper Series disseminates the findings of work in progress to encourage the exchange of ideas about developmentissues. An objective of the series is to get the findings out quickly, even if the presentations are less than fully polished. The papers carry thenames of the authors and should be cited accordingly. The findings, interpretations, and conclusions expressed in this paper are entirely thoseof the authors. They do not necessarily represent the views of the International Bank for Reconstruction and Development/World Bank andits affiliated organizations, or those of the Executive Directors of the World Bank or the governments they represent.Produced by the Research Support Team
WHO IS BENEFITING FROM FERTILIZER SUBSIDIES IN INDONESIA?Camilo Gomez Osorio, Dwi Endah Abriningrum, Enrique Blanco Armas and Muhammad Firdaus** Camilo Gomez Osorio and Dwi Endah Abriningrum are consultants in the East Asia and Pacific PREM Unit in Jakarta, Indonesia.Enrique Blanco Armas is Senior Economist in the same unit. Mohammad Firdaus is Lecturer at the Faculty of Economics andManagement in the Bogor Agricultural University, Indonesia. This Working Paper is part of a larger effort to better understandpublic spending patterns for agriculture in Indonesia. The authors would like to thank the following people for comments andcontributions to this paper: Wismana Adi Suryabrata and Parluhutan Hutahaean from the Government of Indonesia, PeterRosner from the Milenium Challenge Corporation and Shobha Shetty, Michael Morris, William Wallace and Shubham Chaudhurifrom the World Bank Thanks also for Peter Milne and Arsianti for editing and formatting of this paper. The authors may becontacted at eblancoarmas@worldbank.org.
1. IntroductionFertilizer subsidies have increased significantly since the beginning of the decade. In 2008, Indonesiadirected over 50 percent of agriculture resources through direct subsidies for seeds, credit, fertilizer andrice (Figure 1.1). The budget for fertilizer subsidies, at over IDR 15 trillion, was almost double the budgetfor the Ministry of Agriculture (MoA) at the central government level, slightly above IDR 8 trillion.Figure 1.1 Share of national agriculture spendingSource: World Bank staff calculations.Fertilizer subsidies have grown to become one of the largest spending items of the sector. As Figure 1.2shows, by end-2008 the allocation for agriculture subsidies was four times its 2001 level, while resourcesfor irrigation have remained flat over the same period. The budget of the MoA, while significantly higherthan in 2001, has grown at a far slower pace than agriculture subsidies.Figure 1.2 Index of agriculture spending, 2001-08Source: World Bank staff calculations.2
As in many countries, the provision of input subsidies is a highly political and very sensitive issue,particularly as it is linked to the long stated goal of the Government of Indonesia (GoI) of achieving selfsufficiency in rice production. The government continues to allocate a significant share of resources tosubsidization in agriculture. The 2008 budget channeled close to 0.4 percent of GDP and Rp 29.4 trillionto subsidies for rice, fertilizers, seeds, and agricultural credit, of which the first two absorbed the bulk ofthe resources.In this paper we seek to analyze the fertilizer subsidies from two different angles, both important forpolicy makers in the country. Firstly, we analyze who is benefiting from the current system of fertilizersubsidies, and secondly we estimate the impact that a removal of the fertilizer subsidies would have onrice production. Agriculture continues to play a very important role on the country’s economy, but moreimportantly the production and price of rice is a key variable for Indonesian policy makers. As such, anyanalysis in this area has to look beyond efficiency and include equity considerations as well as the longterm goal of self-sufficiency in rice.In the second section of this paper, we provide a short snapshot of the fertilizer system in Indonesia, aswell as provide some data on fertilizer production and distribution. We focus on urea, since this fertilizerrepresents the bulk of the fertilizer used by rice farmers and it captures most of the subsidies beingprovided to the industry. In the third section, we conduct a benefit incidence analysis to show that thefertilizer subsidy is relatively regressive, with the 40 percent largest farmers capturing 60 percent of thetotal subsidy. In the forth section we estimate the impact of fertilizer use on rice yields, showing that therelationship is positive up to a point, beyond which the impact of additional use of fertilizer on yields isnegative. We also show the relative inefficiency of the subsidy in increasing rice production, sincefertilizer subsidies are significantly higher than the value of the increase in production achieved throughthe fertilizer subsidy. In the fifth section we discuss the rationale for subsidizing agricultural inputs andreview some of the international experience to date. Finally, section six concludes and provides somepolicy recommendations.For this research we use two different surveys by the National Statistics Office (BPS), the AgriculturalCensus 2003 and the Rice Household Survey 2008. The first comprises a random sample of over 46,000rice farmers in 29 provinces, while the latter uses a smaller sample of over 11,000 rice farmers from the15 largest rice-producing provinces in Indonesia. The results of the benefit incidence analysis is verysimilar using both surveys; there is little targeting in the subsidy, with the largest farmers capturing adisproportionate share of the subsidy.3
2. Fertilizer Subsidies in ContextAs stated by the MoA, the fertilizer subsidy program in Indonesia seeks to achieve two objectives.1 First,it seeks to increase agriculture productivity and preserve national food security and, second, it aims toenhance farmers’ ability to optimize the use of fertilizer. However, there is also a sense that theprogram is a tool to achieve broader goals, ascribing to the program the objectives of maintainingfarmers’ welfare, poverty alleviation or a price stabilizer.Public spending on fertilizer subsidies has increased far more than production costs for the industry. Inthe manufacture of urea, natural gas is the main input and the increasing gas costs worldwide droveinternational urea prices upward by 50 percent between 2007 and 2008. However, the subsidy inIndonesia grew even faster, at 142 percent over the same period, suggesting that production costs arenot the sole driver of increased spending (Figure 2.1). Today, as this budget item represents animportant component of agriculture assistance, it is crucial to understand who captures the benefits ofthese fertilizer subsidies and whether they result in increased rice production.Figure 2.1 Fertilizer subsidies and international urea prices, 2004-08Source: World Bank staff calculations.Fertilizer production in Indonesia is dominated by a state-owned holding company. For more than threedecades, Indonesia has pursued policies seeking to encourage greater fertilizer use by farmers as a wayto enhance agricultural productivity. This has resulted in a fertilizer industry that heavily focuses on theproduction of urea and to a lesser extent other single compound fertilizers such as SP-36. Fertilizerproduction is a monopoly controlled by five state-owned companies that mostly produce urea underone holding company, PT Agro Kimia Indonesia. The two largest producers, PT PKT and PT Pusri, accountfor three-quarters of the total urea production. The main input for the production of domestic urea isnatural gas, while the main raw material for non-urea fertilizers is potassium, which Indonesia importsfor its domestic suppliers. The private sector only emerged as a player in the 1990s and holds a verysmall share of the market. It is involved only in the production of mixed-compound fertilizers and, dueto price controls and subsidies, no private sector firms have entered the market to supply single1 Source: MoA Decree No. 42/Permentan/OT.140/2008 and Presidential Speech to the House of Representative, August 15, 20084
compound fertilizers. The subsidies for single-compound fertilizers have led to a wide price gap betweensingle- and mixed-compound inputs, depressing the demand for mixed-compound inputs where theprivate sector could play a bigger role.The distribution system of subsidized fertilizer is very complex, heavily regulated and involves severalgovernment layers. Ensuring the availability of fertilizer to the whole of Indonesia, including remoterural areas, is another key concern of the government. Distribution of fertilizer is regulated by a decree,which includes import quotas for certain companies, export restrictions, and it lays down the type ofdocumentation that distributors and retailers have to present, all of which add to the heavy regulatoryenvironment surrounding the production and marketing of fertilizer. Producers are only allowed toexport fertilizer after domestic demand has been fully met, but despite frequently reported fertilizershortages, legal exports of urea fertilizer were stopped only in 2006.Distribution of fertilizer in Indonesia follows a ‘regionalization policy’, in which suppliers were assignedto geographical areas (mostly large islands). Each of the four urea producers is responsible for severalprovinces and tasked with identifying and monitoring distributors in each of the provinces, which aremade responsible for organizing distribution down to the village level. As a way of avoiding ureashortages, the law requires producers to supply their mandated areas first. This regionalization of thedistribution results in a lack of competition for market share and costumers that has removed incentivesto innovate and to invest in producing and distributing fertilizer more efficiently. This in itself may becontributing to the reported fertilizer shortages. Limited competition for customers and markets andrelative price distortions have led to low levels of investments by Indonesia’s fertilizer manufacturers,which has resulted in aging plants, difficulty in obtaining inputs such as natural gas and the impossibilityto face higher production costs from rising fuel prices.The GoI provides subsidies to the fertilizer industry to compensate for ceiling prices below marketprices. The subsidy system to the fertilizer industry has undergone significant changes since itsinception, from government purchasing of all fertilizer on a ‘cost plus fee’ basis to taking the borderprice as a reference for subsidizing production. The fertilizer subsidy system provides input subsidies forfertilizer producers (e.g. natural gas) to allow for a maximum retail price, which is determined annuallyby the MoA. In addition, to ensure availability of fertilizer, the MoA, in consultation with the provincialgovernments, determines production targets for each fertilizer firm based on estimated demand forfertilizer, both subsidized and non-subsidized. In 2006, as the fiscal cost of subsidies increased togetherwith fuel prices, the government revised its subsidy system for fertilizer, providing subsidies to cover thedifference between the maximum retail price set by the GoI and a breakeven point for fertilizer firmsthat is estimated annually by the State Ministry for State-Owned Enterprises.Several attempts have been made to improve the targeting of fertilizer subsidies in order to avoidleakage to larger farms or estate crops and reduce the fiscal burden of fertilizer subsidies. Theseattempts include limiting beneficiaries of subsidized fertilizer to small farmers (with less than 2 hectaresper planting season) or small aquaculture farmers (with less than 1 hectare) and piloting the use of‘smart cards’ for the targeting of subsidies to small farmers. In 2009, the MoA plans to providesubsidized fertilizer only to those farmers who have registered in advance with the district agency foragriculture, which will need to be accompanied by certification by village authorities.The government objective of ensuring wide access to fertilizer at affordable prices is only partiallyfulfilled. There are widespread complaints of fertilizer shortages, particularly as the planting seasonnears. Some of the reasons for these problems could be the regulated nature of the market, with the5
MoA being responsible for estimating the need for fertilizer (both subsidized and unsubsidized), thelocation where it will be used, and the type of fertilizer that farmers will use, as well as the price atwhich it has to be sold. Changes in production trends are not easily incorporated into yearly productionplans and price estimates. The type of information that would be necessary to project the correctamount (and price) of fertilizer is unlikely to be available to the MoA, leading to shortages in productionand imports. Further regulations originating from the other ministries involved (Ministry of Trade,Ministry of Industry and State Ministry for State-Owned Enterprises) increase the uncertainty for theprivate sector, resulting in very little private sector involvement in the production of fertilizer.The subsidy system itself is contributing to some of the fertilizer shortages. The price differencebetween subsidized fertilizer and the market price creates incentives for subsidized fertilizer to be soldoutside the system, to other retailers/ dealers, exported to foreign buyers or to end users for whom itwas not intended (e.g. large plantations). Although there are no estimates of how much subsidizedfertilizer ends up exported or used for estate crops, it could be substantial and this would explain thepersistence of fertilizer shortages despite large increases in the budget for fertilizer subsidies. Limits tothe profitability of increasing production, such as the need to sell in Indonesia at depressed prices, alsolimits the incentives for producers to increase production. The central determination of quantities to beproduced, the prices of the fertilizer and locations where the fertilizer can be sold, provides little roomfor fertilizer companies to expand production and compete with one another.The demand for fertilizer in Indonesia has grown steadily over the past decade at around 5 percent peryear. Indonesia has doubled its consumption of urea at 5 million tons in 2007 when compared with itslevel in the year 2000. Conversely, demand for other fertilizers such as SP36 increased by only 30percent over the same period. Demand for urea is bolstered by the subsidies (to the detriment of othertypes of fertilizer), as suggested by the substitution of urea with AS (ammonia-based) and SP36 (superphosphate-based) between 1999 and 2001, when Indonesia briefly stopped the fertilizer subsidies.Table 2.1 Fertilizer agriculture consumption in Indonesia, e: Indonesia Fertilizer Producer Association, 2007.After briefly reviewing the characteristics of the fertilizer industry and the challenges ahead, thefollowing section analyzes who is benefiting from the fertilizer subsidies.6
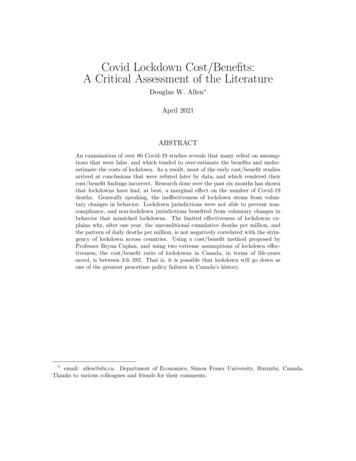
3. Who Benefits from Fertilizer Subsidies in Indonesia?The incidence of benefits from fertilizer subsidies is analyzed using two different rural householdsurveys by BPS: the Agriculture Census 2003 and the BPS Rice Household Survey 2008. The first surveycomprises a random sample of 46,144 farmers for the rice subsector in 29 provinces. It was collected in2004 and asked farmers about their usage of inputs in 2003. The latter survey entails data from asmaller sample of 11,297 rice farmers from 15 provinces regarding the harvest in 2007 (covering the 15largest rice producers in Indonesia and collected in 2008).MethodologyThe incidence analysis looks at two types of fertilizers, urea and SP36, and estimates the spending sharecaptured by farmers according to their land size. The subsidy is defined as the difference between themarket price for fertilizer and the actual prices paid by farmers as reported in these two BPS surveys. Inaddition, the GoI established a ceiling price for fertilizer (HET) that is below the market price and marketprices are reported by the State Audit Agency (BPK), the ‘cost of goods sold’ or CoGS.2 Thus, one canestimate if farmers received subsidy benefits by looking at their paying prices. Those farmers reportingpaying at the HET captured fully subsidized fertilizer, while those farmers paying below the market andabove the HET, received partial subsidy assistance. The analysis looks at the volume of fertilizer usedand at what price and divides the farmers in 5 equal quintiles by the size of their total agricultural land(where quintile 1 groups the smaller-plot farmers and quintile 5 the largest).3 By aggregating the amountof subsidy spending captured by each farmer in a quintile, one can see how much subsidy assistancebenefited each group. (See Annex I for a more detailed discussion on the methodology.)Small farmers on average use more fertilizer per hectare. In 2007, the smaller rice producers used twiceas much urea per hectare and harvested higher yields than farmers with the larger rice paddies (Table3.1). This often leads to over-use of fertilizer (Figure 3.1). This may also reflect price distortions in inputmarkets, which have led small farmers to substitute alternative inputs (other fertilizer, better seeds) forurea, as suggested by the increase in the demand for non-urea fertilizer following the removal ofsubsidies in 1999-2001. In contrast, larger farmers have greater access and better quality inputs, as wellas better quality information and can, therefore, use an optimal mix of agriculture inputs.2 The CoGS is taken as reported in the BPK reports, with the exception of the CoGS for urea in 2003 that is an estimate (see AnnexI). In 2003, the HET price for urea was Rp 1,150 per kg and the CoGS was Rp 1,489, while for 2007 the HET was Rp 1,200 per kgand the weighted average of the CoGS of four producers stood at Rp 2,170.5. Consequently, the HET price for SP-36 in 2003 wasRp 1,400 and the CoGS was Rp 1,629, while by 2007 the HET reached Rp 1,500 and the CoGS was Rp 2,395.3 The land size variable includes total agriculture land for farmers that either, rented, owned, or sharecropped rice paddies. Adifferent analysis, grouping farmers by the size of their gross revenues from rice (where quintile 1 holds the poorest individuals andquintile 5 the richest), corroborates the findings reported in this section. The results of this analysis are reported in Annex III.7
4002000Urea use (kg/ha)600Figure 3.1 Urea use per/ha and land size, 20070123Land size (ha)Source: World Bank staff calculations.Table 3.1 Rice yields and urea/SP36 use by quintiles of land size, 2007Quintile12345Average/TotalRice AverageLand Size(ha)0.120.250.410.731.970.7Source: World Bank staff calculations.The data on fertilizer consumption in Indonesia show that farmers use more urea than recommended bythe MoA. While the optimal levels of urea required per hectare vary according to soil quality acrossislands in Indonesia, the MoA recommends using 200-250 kg/ha of urea and 50-100 kg/ha for SP36fertilizer.4 However, as Table 2.1 illustrates, all farmers in quintiles 1-3 used more than the suggestedamount of fertilizer. In the case of SP36, only the larger farmers in quintile 5 consumed within therecommended range.Benefit Incidence AnalysisThere is no evidence of targeting subsidized urea. When looking at the incidence of benefits by land-sizein 2003, there were subtle differences that favored the smaller farmers (those in land-size quintiles 1-3).Yet, while the coverage of the subsidy program increased in 2007 the targeting was ineffective andthese differences disappeared. (See Figures 3.2 and 3.3, which show that all quintiles benefitted equally4 These recommended level does not include blends with organic fertilizer. MoA Decree No. 01/Kpts/SR.130/I/2006 (LampiranKeputusan Menteri Pertanian). The lower range is an average for off-Java provinces, while the higher range applies for Java.8
from the fertilizer subsidy.) As the government increased spending on fertilizer subsidies, a largernumber of farmers benefited. In 2003, close to 65 percent of surveyed farmers reported capturingeither full or partial assistance, and this number increased to 96 percent in 2007.Figure 3.2 Farmers receiving subsidized urea byquintiles of land size, 2003Source: World Bank staff calculations.Figure 3.3 Farmers receiving subsidized urea byquintiles of land size, 2007.Very few farmers are paying for fertilizers at the HET regulated price. The fact that most beneficiariesbelong to the partial subsidy group and the evident reduction of the full subsidy group over time suggestthat fertilizer shortages drove prices upwards. In 2007, about 10 percent of the farmers paid the HET orbelow, while a large majority of the farmers in all quintiles paid above the HET regulated prices forfertilizer.Table 3.2 Fertilizer prices by quintiles of land sizeQuintileUrea Price(Rp)SP36 Price(Rp)Average 0.7Source: World Bank staff calculations.There is evidence that, on average, farmers paidsimilar prices for fertilizer.5 In 2007, farmers inthe first quintile paid on average Rp 1,549 andRp 2,221 per kg of urea and SP36, respectively,while those in quintile 5 paid on average Rp 1,530and Rp 2,265 for these inputs. In general, farmerswere charged 28 percent above the regulatedurea price (HET), while a bag of SP36 was onaverage 45 percent more expensive than that ofurea (Table 3.2).Public spending to subsidize urea is regressive and a large share of the benefits is captured by the largerfarmers6. The larger farmers use greater quantities of fertilizer, which means they absorb more publicresources. In both 2003 and 2007 surveys, the 40 percent largest farmers capture up to 60 percent of5 The mean difference ANOVA tests between quintiles (Bonferroni, Scheffe, Sidak 1969) show small, but statistically significantmean differences in urea prices amongst the land quintiles 1, 2, & 3. In the case of SP36, the mean differences were onlystatistically significant between quintiles 2, and 5 and 3 and 5. (See for a discussion on these tests, Abdi, H (2007))6 Throughout this policy note, large farmers does not necessarily mean large in absolute terms, since the average size even in thelargest quintile is below 2 ha of land, but these farmers are large relative to the farmers in the other quintiles. These differences inland-size groups in the sample translate into significant differences in income across quintiles, where farmers in quintile 5 earn onaverage 7 times more gross revenues from rice than farmers in the lowest quintile. In interpreting the results of our analysis, it isimportant to keep in mind both the small size of most farms in the sample, as well as the large differences in average farm size andincome between quintiles.9
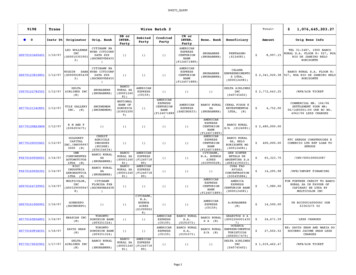
the total subsidy. (Figure 3.4 illustrates the positive relationship between urea subsidy spendingcaptured and the size of farmers’ agriculture land, while Figures 3.5 and 3.6 show how these publicresources were distributed across these five farmer groups.)10000000500000Captured spending (Rp)1500000Figure 3.4 Captured urea subsidy spending and land size, 20070123Land size (ha)Source: World Bank staff calculations.These findings are corroborated by the fact that both surveys show a similar distribution of benefits.However, these data were gathered at two different periods of the subsidy program and for twodifferent random samples of rice farmers. Thus, the results raise equity concerns because the incomedifferences between these farmer groups are striking: the larger farmers in quintile 5 generated onaverage gross revenues from rice seven times greater than the smaller rice growers in quintile 1.Figure 3.5 Distribution of urea subsidyspending by quintiles of land size, 2003Figure 3.6 Distribution of urea subsidyspending by quintiles of land size, 2007Source: World Bank staff calculations.The total subsidy spending that benefited quintiles 4 and 5 was greater than the combined sharecaptured by farmers in the three smaller quintiles, as seen in Figures 3.7 and 3.8. These findings areindependent of the assumed market price for fertilizers. A sensitivity analysis, presented in Annex VII,shows that these results are independent of the market price (CoGs) reported by the BPK, over whichthe subsidy was estimated. Thus, increasing and decreasing the market price for urea by 10 percentdoes not alter the findings on the distribution of benefits and of captured spending per quintile.10
Figure 3.7 Urea subsidy spending by land size,2003Figure 3.8 Urea subsidy spending by land size,2007Source: World Bank staff calculations.As in the case of urea, there was no targeting of subsidized SP36 and the benefits were regressive,benefiting the larger farmers. SP36 is a more expensive input than urea that is produced by onecompany in Indonesia, PT Petro Kimia Gresik (PKG). It comprises a smaller share of the total subsidyexpenditures, but the data show a similar incidence story (Annex II). While in 2003, the subsidiesseemed to be benefiting a larger share of small farmers, by 2007 these differences across quintilesdisappeared (Annex II, Figures II.1 and II.2). As in the case of urea, the share of farmers that received thesubsidy increased significantly from 43 percent (2003) to 68 percent (2007), but it remains lower thanthe share of farmers benefiting from subsidized urea in 2007 (96 percent). As in the case of urea, a largeshare of the subsidies is captured by larger farmers in quintiles 4 and 5, with 62 percent of all subsidiesgoing to these two quintiles in 2007.There are significant fiscal savings to be made by improving targeting of the fertilizer subsidy. Assuminga similar distribution of subsidy spending for Indonesia such as that in Figures 3.7 and 3.8 and providingthe same amount of subsidies to the smallest 60 percent of the farmers, the government would havesaved over Rp 9 trillion from the fertilizer subsidy budget in 2008. Having explored the distribution ofbenefits of the fertilizer subsidy, one question remains unanswered. Has fertilizer usage translated intogreater agriculture production in Indonesia?11
4. What Is the Impact of Urea Consumption on Rice Production?This section estimates the impact of fertilizer subsidies on urea consumption and the impact of urea useon rice yields. A simple micro-model using data from the 2007 household survey explores twoimportant questions: What is the effect of the fertilizer subsidy on urea consumption, and what impactdoes urea usage have on rice production? The model proposed allows for diminishing returns to the useof fertilizer (by including a quadratic term for urea used), implying that there is an optimal point for ureausage beyond which yields start to decline. The quantity of urea consumed depends on: the price ofurea, the price of other fertilizers (which are proxied with the price of SP36), the price of rice, and theprice of rice seeds. In turn, the impact of urea on rice yields is dependent on: the quantity of urea used,the consumption of other inputs (land, labor, irrigation), and controls for soil quality (a dummy variablefor Java-Bali) and human capital (in this case, the years of education and the age of the head of thehousehold). The model to be estima
Camilo Gomez Osorio, Dwi Endah Abriningrum, Enrique Blanco Armas and Muhammad Firdaus * * Camilo Gomez Osorio and Dwi Enda h Abriningrum are consultants in the East Asia and Pacific PREM Unit in Jakarta, Indonesia. Enrique Blanco Armas is Senior Economist in the same unit. Mohammad Firdaus is Lecturer at the Faculty of Economics and