Transcription
Automatic collection of fuel prices froma network of mobile camerasYi Fei Dong1 , Salil Kanhere1 , Chun Tung Chou1 , Nirupama Bulusu21School of Computer Science & Enginneering,University of New South Wales, land State University, USAnbulusu@cs.pdx.eduTechnical ReportUNSW-CSE-TR-0803February 2008THE UNIVERSITY OFNEW SOUTH WALESSchool of Computer Science and EngineeringThe University of New South WalesSydney 2052, Australia
AbstractIt is an undeniable fact that people want information. Unfortunately, even intoday’s highly automated society, a lot of the information we desire is still manually collected. An example is fuel prices where websites providing fuel priceinformation either send their workers out to manually collect the prices or depend on volunteers manually relaying the information. This paper proposes anovel application of wireless sensor networks to automatically collect fuel pricesfrom camera images of road-side price board (billboard) of service (or gas) stations. Our system exploits the ubiquity of mobile phones that have camerasas well as users contributing and sharing data. In our proposed system, cameras of contributing users will be automatically triggered when they get closeto a service station. These images will then be processed by computer visionalgorithms to extract the fuel prices. In this paper, we will describe the systemarchitecture and present results from our computer vision algorithms. Basedon 52 images, our system achieves a hit rate of 92.3% for correctly detectingthe fuel price board from the image background and reads the prices correctlyin 87.7% of them. To the best of our knowledge, this is the first instance of asensor network being used for collecting consumer pricing informationKeywords:Automatic data collection, Computer-vision-based sensing, Consumer pricing information gathering, Participatory sensor networks, Vehicularsensor networks.
1IntroductionThe technology of wireless sensor networks (WSNs) has been applied to aplethora of application domains, e.g., farming [24], structure monitoring [19],military [1], environmental monitoring [14], home health care [3], home environment control [23] etc. In this paper, we propose a novel application of usingWSN to automatically collect prices of fuel1 from still images of road-side priceboard of service stations. To the best of our knowledge, this is the first instanceof a WSN being used for collecting consumer pricing information.Price dispersion of homogenous goods appears to be a fixture of our economy. It is not uncommon for us to find two shops within a close proximityselling an identical item at different prices. For instance, on 18 January 2008,around 9pm, two service stations in Roseville, Sydney, that are less than 1 kmapart, were selling unleaded fuel at 1.359 and 1.439 Australian dollars per litre.With the presence of price dispersion, the availability of consumer pricing information can therefore be advantageous and this has been confirmed by a numberof studies by economists on the effect of information on the on-line economy.For example, the study in [4] showed that consumers who used on-line pricecomparison service could save up to 16% in buying electronic goods on-line.Also, the on-line economy has also been shown to drive down insurance pricesin [5].Given the existence of price dispersion in fuel, a number of websites exist toenable consumers to compare fuel prices. Examples of these include Gaswatch,GasBuddy2 in the United States; fuelprice 3 in the UK; RACV, fuelwatch andmotormouth4 in Australia. These websites use a couple of different methods tocollect their fuel price data. Some of these websites send their workers out, onceor twice a day, to collect the data; however, this is labour intensive and it isdifficult to track price changes since different service stations update their priceat different times of the day5 . Some other websites rely on volunteers manuallyrelaying the fuel price information. Although the use of volunteers can providemore frequent updates, the need to manually relay the fuel price data may discourage many people from volunteering. Are there other alternatives other thanmanual collection? One possibility is for the service stations to broadcast theirfuel prices. However, there is no incentive for the service stations to do thissince availability of information can drive up the competition. Alternatively,one may also consider deploying infrastructure at each service station to monitor the prices; however, the capital investment can be costly.Given the above discussion, we therefore see the efficient collection of fuelprice information (or more generally of a lot of information at the street level)1 Unfortunately, different parts of the English speaking world use different words to refer tofuel for automobiles. In North America, it is commonly known as ”gasoline” while it is called”petrol” in the United Kingdom and Australia. We have chosen to use ”fuel” in this paper toavoid bias towards a particular community.2 http://www.gaspricewatch.com, http://www.gasbuddy.com/3 http://www.petrolprices.com/4 http://www.racv.com.au, http://www.fuelwatch.wa.gov.au/, http://motormouth.com.au/default nf.aspx5 Price of fuel does change a few times a day at many service stations across Sydney.1
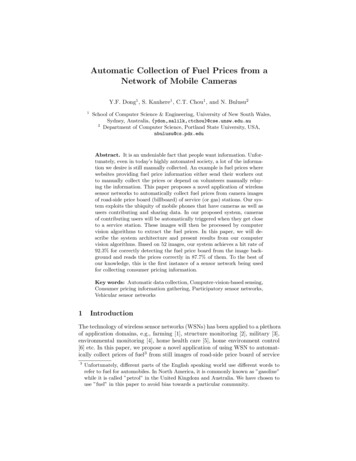
to be a technical challenge. We believe that a method to overcome this technicalchallenge is to use the Sensing Data Market (SenseMart) framework that theauthors of this paper have proposed in [9]. The SenseMart framework consistsof two key ideas. Firstly, it leverages the existing sensing and communicationsinfrastructure in collecting sensing data. Secondly, it provides a platform forpeople to exchange and share sensing data. This paper proposes a WSN architecture that allows volunteers to automatically collect, contribute and sharefuel price information, thus lowering the cost or barrier for sharing. Our proposed system (which will be detailed in Section 2) leverages on the ubiquity ofcameras, mobile Internet connectivity, GPS (Global Positioning System) andGIS (Geographic Information System). Through the use of GPS and GIS, oursystem knows that when the vehicle of a contributing user is getting close to aservice station and triggers the camera automatically. These images are thenprocessed by a computer vision algorithm to extract the fuel price, the detailsof which will be described in Sections 3 and 4.This paper makes the following contributions: We propose a new application of WSN to collect consumer pricing information. We propose a novel WSN architecture — whose components include cameras, mobile phones, GPS, GIS, computer vision algorithms as well as thesharing of sensing data — that can automatically collect fuel prices fromimages of service station, thus lowering the barrier of sharing sensing data. We implemented a working prototype which automatically detects andclassifies fuel prices from images of service station billboards. Based on 52images, our system achieves a hit rate of 92.3% for correctly detecting thefuel price board from the image background and reads the prices correctlyfor 87.7% of them.2System DesignOur system has two principal modes of operation: (i) fuel price collection and (ii)user query. In this paper, we primarily focus on the former. The most importantgoal of our system is to automate the process of collecting the fuel prices. This isachieved by automatically triggering the mobile phones of contributing users totake pictures of roadside fuel price boards when they approach service stationswhile driving. Our system employs sophisticated computer vision algorithms toscan these images and retrieve the fuel prices. To reduce the complexity of thecomputer vision tasks, our system relies on contextual information that is madeavailable by GPS and GIS software. Figure 2.1 presents a pictorial overview ofour system. As depicted in the picture, the data collection process involves threesteps: (i) capturing images of the fuel price boards, (ii) uploading the imagesto the central server and (iii) extracting fuel prices from the images . Each ofthese tasks is executed by a distinct component of the system. In the following,we discuss the design and implementation of the three main components thatmake up our system and describe their operation.Camera Sensor: The primary function of the camera sensor is to automatically capture images of the price boards of approaching service stations. In2
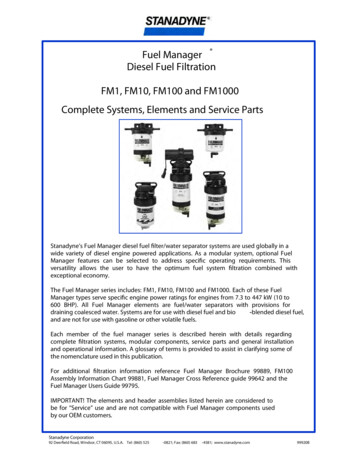
our system, we have assumed that the mobile phones of contributing users willserve this purpose. Note that, almost all current mobile phones are equippedwith in-built cameras. We assume that the phone is mounted on the dashboardin front of the front passenger, with the camera lens pointing towards the road,i.e. leftwards. Consequently, the camera can capture pictures of roadside objects on the left of the car (Note that in Australia we drive on the left side ofthe road). In the future, it is expected that cars would be fitted with camerasfor implemented sophisticated ITS (Intelligent Transport System) applications.Our system can be readily interfaced with these in-car cameras. In this instance,the images captured by the cameras could be transferred wirelessly via Wifi orBluetooth to the mobile phone.Figure 2.2 depicts a logical representation of the various components thatcontribute to realizing the automated capturing of images. The control unit,which oversees the operation is implemented as a daemon in the mobile phone.The control unit periodically polls the in-built GPS receiver of the phone toobtain the current location coordinates of the car. It should be noted thata large majority of the new mobile phones are equipped with GPS receivers.Alternately, it is fairly straightforward to connect an external GPS receiver toa phone via Bluetooth. Our system also requires that GIS software such asGoogle Maps, TomTom or Nokia Maps is installed on the phone. GIS systemsuse the GPS location coordinates and a map database of the city road networkto estimate the current street position of the mobile. GIS systems can also call toattention any approaching Points of Interest (POI) such as restaurants, shoppingmalls and service stations. For example, TomTom alerts users of approachingservice stations and also indicates the provider information (i.e. brand, e.g.:Caltex, Mobil, etc). Our system takes advantage of these capabilities of the GISsoftware for automating the data collection process. The control unit queriesthe GIS system to obtain the location coordinates and the brand of the nextapproaching service station along the path of the car. Using this location data,the control unit first determines if the service station is on the appropriate sideof the road. Recall, that as explained earlier the mobile phone is mounted withthe camera lens facing the left-side of the road. Next it determines if the caris within an acceptable distance for taking pictures (a configurable thresholdwhich is set to 10 meters) and then automatically triggers the camera sensor totake several pictures. The camera is switched off once the car has passed theservice station. The images are tagged with contextual information providedby the GPS and GIS software such as the service station location coordinates,brand information and time of capture. This information significantly simplifiesthe complexity of the image processing algorithms that are executed at theserver. The images together with the meta-data are passed on to the data uploadunit, which is responsible for uploading the pictures to the central server. Itis important to note that the entire process is automated and does not requireany user intervention.Data Transport: Our system leverages on the existing communicationinfrastructure for effecting the transfer of images to the server. Current mobilephones have ubiquitous Internet connectivity via the GSM/GPRS/3G/HSDPAcellular network and in some cases also via in-built 802.11 interfaces. The dataupload unit of the mobile phone establishes a TCP connection with the centralserver using any of the available underlying access technologies. The images areuploaded to the server using this reliable channel. An alternative is to upload3
the images as multimedia SMS messages.Central Server: The central server implements the computer vision algorithms for processing the images and extracting the fuel prices. A standarddesktop computer is sufficient for implementing this functionality. We have implemented a TCP server daemon, which receives the images uploaded by themobile users. The meta-data (location coordinates, service station brand andtime) is extracted and stored separately. The images along with the fuel brandinformation are passed on to the image processing engine. Figure 2.3 representsthe sequence of steps involved in the price extraction process. The first stepinvolves detecting the existence of a fuel price board in the image, which byitself is a significantly challenging task. However, note that, each fuel branduses a specific color combination for their fuel price boards. For example, BPuses a green color code, whereas Mobil boards are blue in color. To reducethe complexity of the problem, we utilize the knowledge of the brand of theservice station to assist in the detection process. Recall that this information isincluded as meta-data with the uploaded pictures. For each brand, we employa tailored color thresholding that is able to capture regions within the images,which have a similar color scheme as that of the price board. In certain situations, surrounding objects within the image may have colors resembling theboard resulting in more than one potential candidate regions, e.g.: the blue skyin the background image may be similar to the color of the Mobil board. In thissituation, we use two post-processing techniques to narrow down the search. Inthe first instance, we make use of certain features of the dimensions of the priceboards to exclude some of the candidate regions selected by our color thresholding algorithm. Further refinement is achieved by comparing the color histogramof all candidate regions with that of a sample image of the price board of thatparticular brand. The detection process concludes with the identification of theprecise location of the price board within the image. The image is then croppedsuch that it solely contains the price board. The cropped image is then normalized to a standard size and resolution. The goal of the next step is to extractthe individual fuel price characters from the image. To achieve this, we firstconvert the color picture to a binary image and then employ connected component labeling to extract out the individual numeral characters of the fuel prices.The final step uses a Feedforward Backpropagation Neural Network algorithmfor classifying the price numeral characters. The neural network utilizes a training template containing numeral characters compiled from a number of sampleimages of fuel price boards. A detailed description of all of the aforementionedsteps can be found in the subsequent section.Once the prices are extracted they are stored in a database which is linkedto a GIS road network database populated with the locations of the servicestations. This GIS database is consistent with that installed on the mobilephones. Since, each image is tagged with the time and location, the serverupdates the fuel prices of the appropriate service station in the database if thecurrent image has a timestamp later than that of the stored prices. The pasthistory of fuel prices at each service station is also recorded for analyzing pricingtrends.As discussed earlier, this paper primarily focusses on the data collection aspect of our system. We now briefly describe how our system deals with userqueries. The central server implements a simple query resolver daemon for servicing pricing queries from users. A simple client program implemented on the4
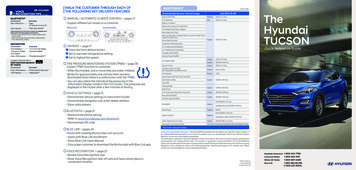
Step 3: Extract fuel prices storein databaseResponseCentral Data serverFuel price queryMobile userGSM/GPRS/3GStep 2:Upload images meta-dataStep 1: Automated capture of fuel price boardimages.Mobile userFigure 2.1: System Overviewmobile phone allows users to query for the cheapest refueling option in theirvicinity. The client program obtains the current location coordinates of theuser by querying the GPS receiver. The users’ query tagged with his locationinformation is then sent to the central sever. The server searches the fuel pricedatabase for the cheapest service station in the vicinity of the user and sendsback a reply to the users mobile phone, which contains the price, location coordinates and brand of the chosen service station. In our future work, we alsointend to implement support for more sophisticated queries such as ”find thecheapest fuel station collocated with a convenience store”. In addition, we planon providing for alternate modes of access to the pricing information, such asvia SMS and a web-based interface.3Computer Vision Algorithm for Extracting FuelPricesDespite recent advances, computer vision still can not deal with complex environmental problems, though it can work accurately in controlled environments.In the following we present some of the key environmental challenges that areencountered by our system:1. Some of the pictures may contain extraneous objects that overlap with thefuel price board. For example, in Figure 3.1(a) 1 a white car has maskedthe lower part of the board.2. The color of some objects in the background may be similar to the colorof the price board, E.g., the blue color of the wall in the background inFigure 3.1(b) is similar to that of the fuel price board. Consequently, the1 This and other images in Section 3 are best viewed on a colour screen. Full size versionsof these images can be found at the following link: http://www.cse.unsw.edu.au/ ydon/dcoss08 images/5
Approaching servicestation’s locationinformationTriggerPicturesCurrent locationcoordinatesPictures meta-dataFigure 2.2: Mobile sensor componentsFigure 2.3: Overview of the computer vision algorithm6
(a)(b)(c)Figure 3.1: Examples illustrating the challenges encountered by computer vision(a)(b)(c)Figure 3.2: Problems encountered in classifying fuel price characterswall may be wrongly interpreted as the price board if color is used as thekey feature in the detection process.3. Since the images are captured while in motion, it is likely that some ofthem appear blurred or unfocussed. Figure 3.1(c) illustrates one such case.4. Recognition and detection of road signs from digital images is a maturearea of research [12, 21, 2]. However, a road sign differs significantlyfrom a fuel price board as evidenced by comparing Figures 3.2(a) and3.2(b). A typical image of a fuel price board not only contains several smallcharacters but also is more likely to have extraneous objects that could bewrongly interpreted as characters. For example, the cropped white labelto the left of the price in the top row may be wrongly interpreted as ”1”.Figure 3.2(c) illustrates an instance where all individual characters aresuccessfully extracted.5. Computer vision algorithms used for extracting text from images consistof two important steps: (i) Detection of the target area and (ii) Extractionof the characters. It is likely that the quality of the images required forthe successful completion of the individual tasks may vary significantly.For example, it may be fairly easy to detect the price board in a particularimage. However, the text extraction may fail for the same image.To overcome these and other challenges, our system makes use of certain contextual information by employing the assistance of GPS and GIS. Our algorithmconsists of two key steps, which are described in the subsequent sub-sections.7
3.1Fuel Price Board DetectionGiven an image, the task of detecting the presence of a fuel board and preciselyidentifying its location is quite difficult to solve with the current state-of-theart in computer vision. Hence, our system relies on GPS and GIS to provideadditional contextual information, which significantly simplifies the problem.As explained in Section 2, the GIS system includes the service station brand asmeta-data with the image. Each fuel brand uses a specific color combinationfor its price boards, e.g.: BP price boards are green and Mobil boards use blueas the backdrop. We use this color information as a key feature for isolatingobjects in the picture which can be potential fuel price boards. In this paperwe have only focussed on BP and Mobil, two of the largest fuel providers inSydney. In our future work, we intend to encompass all the major providers inAustralia. There are two prominent schemes for representing color images: RGB(Red, Green and Blue) and HIS (Hue, Intensity and Saturation). The HIS colorspace is immune to changes in the lighting condition, but is computationallyintensive since it involves nonlinear transformation [12]. On the contrary, RGBis sensitive to changes in the lighting conditions, but is computationally efficient.Since our ultimate goal is to implement the computer vision algorithms directlyon the mobile phones, we have chosen to use the RGB color space.Figure 3.3 depicts the step-by-step evolution of the board detection algorithm for one particular example image. The original image, containing a Mobilboard that serves as the input to the detection algorithm is shown in Figure3.3(a). We use the Mobil board which is blue in color as an illustrative exampleto explain our algorithm. A similar logic was used to identify BP boards.Since RGB is an additive color space, a blue component image can be readilyobtained by boosting the blue level of each pixel and subtracting the corresponding green and red components as indicated by the following equation,B(x, y) 2 f b(x, y) f r(x, y) f g(x, y)(3.1)where f b(x, y), f r(x, y) and f g(x, y) are, respectively, the functions representingthe blue, red and green levels of each pixel in the image [12]. Figure 3.3(b)represents the blue component image of the original image in Figure 3.3(a). Asimilar approach can be employed for other colors.Color thresholding [13] is one of the earliest techniques for detecting objectsin digital images. Thresholding aims to classify all the pixels of an image intoobject pixels, which correspond to regions potentially containing the object andbackground pixels. Since the Mobil board is blue, we employ color thresholdingwith the criteria that a pixel in the blue component image is an object pixel ifB(x, y) exceeds a certain threshold, Bth . The output of the color thresholdingproduces a binary (i.e. black and white) image, with all object pixels taking ona value of 255 (note that, each pixel is represented by 8 bits) and backgroundpixels being zero. The above process can be represented mathematically as,(255, if B(x, y) Bth ,B(x, y) (3.2)0,else,In our first attempt at implementing color thresholding, we tried to use a singular value of the threshold Bth , which was calculated using a few test images.However, when we used this value for testing our dataset (details in Section 4),8
AverageIntensityRangeBthAI 33 AI 99 AI 1515 AI 7070 AI0205080120Table 3.1: Thresholds for images with different average intensitieswe observed very poor results. This was expected given that the RGB colorspace is quite sensitive to lighting conditions. As an improvement we used a setof test images and manually classified them into 5 distinct groups representingdifferent lighting conditions. We then computed the range of the average intensities (AI) of the blue component images for each group. Next, we determinedthe value of Bth for each group that achieved a 100% positive detection of theprice board. Table 3.1 shows the range of AI values for each of the groups andthe corresponding threshold value, Bth .Figure 3.3(c), shows the binary image produced by the color thresholding.Since, each row of the fuel prices is separated by a line, the fuel price board actually appears as three sub-divided regions in the binary image. These adjacentregions are merged together to form the complete price board by using morphological reconstruction [13], which is shown in Figure 3.3(d). Finally, connectedcomponent labeling [13] is employed to group the pixels into components basedon pixel connectivity, i.e, all pixels in a connected component share similar pixelintensity values and are in some way connected with each other.The first stepof connected component labeling is edge detection.Comparing with other edgedetection operators, sobel edge detection operator gives more importance to thepoints fall in the line [13]. Thereby it affords better edge detect effect. As aresult, the sobel operator is applied here to obtain edges in Figure 3.3(d), whichproduces a binary image BW of the same size as Figure 3.3(d) with 1’s wherethe sobel operator finds edges in Figure 3.3(d) and 0’s elsewhere. Once theedges is obtained, we need to calculate the connected components in BW. Thecomponent filtering mask coefficients are defined in Equation 3.3. 0 0 0 0 0 0 1 1 1 0 (3.3)connect mask 0 1 1 1 0 0 1 1 1 0 0 0 0 0 0The connected component of image of BW is obtained by performing twodimensional convolution of image BW and connect mask. Finally the obtainedcomponents are then labeled as different numbers. Figure 3.3(e) shows the output of the the connected component labeling. One can readily observe that itcontains several regions, which can be potential price boards. Our algorithmuses two post-processing techniques, which make use of certain known features(color and dimension) of the fuel price boards to narrow down the choices andcorrectly detect the price board.Dimension Comparison: The first step makes use of the a priori knowledge of the dimensions of a typical price board to exclude regions, which areobviously either too small or too large. However, determining a set of constraints9
(a)(b)(c)(d)(e)(f)(g)(h)Figure 3.3: Intermediate steps involved in the detection process10
based on dimensions can be tricky since the pictures are not captured from astatic location. The camera can be at variable distances from the price boardswhen the pictures are captured. Further, the orientation of the camera lens relative to the price board may be different in each image. We have analyzed a setof test images of the price boards to encompass all these variables. Our test setincludes close-up and far-away views of the price boards and pictures capturedwith the camera lens at different angles to the plane of the price board. Ouranalysis concludes that a candidate region of width Wi and height Hi can onlyqualify as a potential fuel price board, if the following constraints are met:Wimage30Hi 2.51 WiWi (3.4)(3.5)where Wimage is the width of the image containing the candidate region. Figure3.3(f) is the output of the first post-processing step. As compared to the inputimage in Figure 3.3(e), the number of candidate regions have now been reducedto 3.Color Histogram Comparison: The second post-processing techniquecompares the histogram distribution of the candidate regions to that of a template of the price board. The Chi square distance [28] between hi , the histogramof the candidate region and hj , the histogram of the price board template iscomputed as follows,χ2 (hi , hj ) K21 X [hi (m) hj (m)]2 m 1 hi (m) hj (m)(3.6)where K is the number of histogram bins. As χ turns out to be a large number,we normalize this distance as follows,Dnorm χK WI(3.7)where K is the number of histogram bins and W I is the width of the image.In our system, we set K as 60, since it provides for good accuracy and lowcomplexity. W I is set to the standard value of 480 pixels. To determine anappropriate threshold value for the normalized distance, Dnorm , we used a testset containing 10 cropped images that include the fuel price board and 10 imagesthat do not contain one. The normalized distance of each image in the set wascomputed by comparing its histogram with that of the price board templateusing Equation 3.7. Based on the test results, we conclude that if a candidateregion has Dnorm 2.5, then it is very likely that this region corresponds tothe fuel price board. Figure 3.4(a) shows the template used in our tests andFigure 3.4(d) represents its color histogram. Figure 3.4(b) is a cropped imagefrom the test set that contains the fuel price board and its color histogram isplotted in Figure 3.4(e). Dnorm for this particular image is 1.6. Figure 3.4(c)represents an image from the test set that does not contain the price board andits corresponding histogram is shown in Figure 3.4(f). Dnorm for this image is3.9, considerably higher than the threshold of 2.5. Figure 3.3(h) is the output of11
(a)(b)(c)(d)(e)(f)Figure 3.4: Color histograms for a few example imagesapplying the histogram comparison. The fuel price board has now been correctlyidentified. This concludes the detection phase. The next step is to extract thefuel prices from the board.3.2Fuel Price ClassificationThe last section describes an algorithm on detecting the fuel price board fromthe background of the image. This section describes the procedure to extractand classify the numeral characters which make up the fuel prices in a priceboard. The procedure consists of two steps: extraction of the characters andfollowed by classification by a neural network.Character extraction: In Figure 3.5(a), it is shown for a successful detected fuel price board. Variations of detected fuel price boards due to differences in size, perspective angle make automatic fuel price characters extractionextremely challenging. Hence, we normalize the detected fuel price boards toa standard resolution (129-by-112 pixels). The fuel price boards are usuallydesigned such that there is sufficient c
Also, the on-line economy has also been shown to drive down insurance prices in [5]. Given the existence of price dispersion in fuel, a number of websites exist to enable consumers to compare fuel prices. Examples of these include Gaswatch, GasBuddy2 in the United States; fuelprice 3 in the UK; RACV, fuelwatch and motormouth4 in Australia .