Transcription
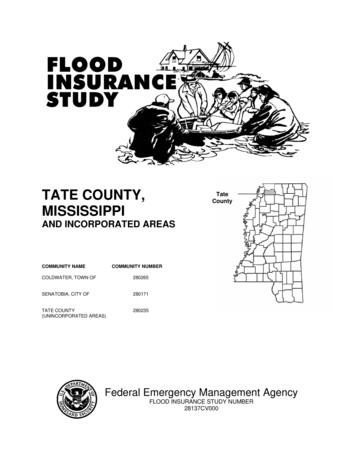
TATE COUNTY,MISSISSIPPITateCountyAND INCORPORATED AREASCOMMUNITY NAMECOMMUNITY NUMBERCOLDWATER, TOWN OF280265SENATOBIA, CITY OF280171TATE COUNTY(UNINCORPORATED AREAS)280235Federal Emergency Management AgencyFLOOD INSURANCE STUDY NUMBER28137CV000
NOTICE TOFLOOD INSURANCE STUDY USERSCommunities participating in the National Flood Insurance Program (NFIP) have established repositories offlood hazard data for floodplain management and flood insurance purposes. This Flood Insurance Study(FIS) may not contain all data available within the repository. It is advisable to contact the communityrepository for any additional data.Part or all of this FIS may be revised and republished at any time. In addition, part of this FIS may berevised by the Letter of Map Revision process, which does not involve republication or redistribution of theFIS. It is, therefore, the responsibility of the user to consult with community officials and to check thecommunity repository to obtain the most current FIS components.Initial Coutywide FIS Effective Date:Revised Coutywide FIS Dates:
TABLE OF CONTENTSPage1.02.03.04.0INTRODUCTION11.1Purpose of Study11.2Authority and Acknowledgments11.3Coordination2AREA STUDIED22.1Scope of Study22.2Community Description32.3Principal Flood Problems42.4Flood Protection Measures4ENGINEERING METHODS43.1Hydrologic Analyses43.2Hydraulic Analyses73.3Vertical Datum9FLOODPLAIN MANAGEMENT APPLICATIONS104.1Floodplain Boundaries104.2Floodways115.0INSURANCE APPLICATIONS176.0FLOOD INSURANCE RATE MAP177.0OTHER STUDIES198.0LOCATION OF DATA199.0BIBLIOGRAPHY AND REFERENCES19i
TABLE OF CONTENTS - continuedPageFIGURESFigure 1 - Floodway Schematic12TABLESTable 1 - Streams Newly Studied by Detailed MethodsTable 2 - Summary of DischargesTable 3 - Summary of Stillwater ElevationsTable 4 - Summary of Roughness CoefficientsTable 5 - Floodway DataTable 6 - Community Map History35781318EXHIBITSExhibit 1 - Flood ProfilesBonner CreekColdwater RiverHickahala Creek Tributary 1Hickahala Creek Tributary 2Hickahala Creek Tributary 2AHickahala Creek Tributary 3Hickahala Creek Tributary 3APigeon Roost CreekSenatobia CreekPanel 01PPanel 02-04PPanel 05-06PPanel 07-08PPanel 09PPanel 10PPanel 11PPanel 12PPanel 13-14PExhibit 2 - Flood Insurance Rate Map IndexFlood Insurance Rate Mapii
FLOOD INSURANCE STUDYTATE COUNTY, MISSISSIPPI AND INCORPORATED AREAS1.0INTRODUCTION1.1Purpose of StudyThis Flood Insurance Study (FIS) revises and supersedes the FIS reports and/or FloodInsurance Rate Maps (FIRMs) in the geographic area of Tate County, Mississippi,including the City of Senatobia, Town of Coldwater and the unincorporated areas of TateCounty (hereinafter referred to collectively as Tate County).This FIS aids in the administration of the National Flood Insurance Act of 1968 and theFlood Disaster Protection Act of 1973. This study has developed flood risk data forvarious areas of the community that will be used to establish actuarial flood insurancerates. This information will also be used by Tate County to update existing floodplainregulations as part of the Regular Phase of the National Flood Insurance Program (NFIP),and by local and regional planners to further promote sound land use and floodplaindevelopment. Minimum floodplain management requirements for participation in theNFIP are set forth in the Code of Federal Regulations at 44 CFR, 60.3.In some states or communities, floodplain management criteria or regulations may existthat are more restrictive or comprehensive than the minimum Federal requirements. Insuch cases, the more restrictive criteria take precedence and the State (or otherjurisdictional agency) will be able to explain them.1.2Authority and AcknowledgmentsThe sources of authority for this FIS report are the National Flood Insurance Act of 1968and the Flood Disaster Protection Act of 1973.For the initial City of Senatobia FIS, the hydrologic and hydraulic analyses wereperformed by the U.S. Army Corps of Engineers (USACE), Vicksburg District, for theFederal Emergency Management Agency (FEMA) in May 1977 (U.S. Dept. of Housingand Urban Development, 1978) under Inter-Agency Agreement Nos. IAA-H-16-75 andIAA-H-7-76, and Project Order Nos. 20 and 1.The hydrologic and hydraulic analyses for this countywide FIS were performed by theState of Mississippi for the FEMA, under Contract No. EMA-2003-GR-5370. This studywas completed in March 2007.The digital base map information files were provided by the State of Mississippi. Thisinformation was photogrammetrically compiled at a scale of 1:12000 from aerialphotography dated September 2004.
The digital FIRM was produced using the Mississippi State Plane Coordinate System,West Zone, FIPSZONE 2302. The horizontal datum was the North American Datum of1983, GRS 80 spheroid. Distance units were measured in U.S. feet.1.3CoordinationAn initial Consultation Coordination Officer's (CCO) meeting is held with representativesfrom FEMA, the community, and the study contractor to explain the nature and purpose ofa FIS, and to identify the streams to be studied by detailed methods. A final CCO meetingis held with representatives from FEMA, the community, and the study contractor toreview the results of the study.For the initial City of Senatobia FIS, a meeting was held on February 10, 1976, andattended by personnel of the USACE, Vicksburg District (the study contractor); FederalInsurance Administration; and the City of Senatobia. An intermediate coordinationmeeting was held on September 25, 1975, and was attended by representatives of the city,the Federal Insurance Administration, and the study contractor.During the initial study, telephone conversations and visits were made with the CityEngineer, local residents, National Weather Service, North Central Mississippi Planningand Economic Development District, U.S. Soil Conservation Service, and U.S. GeologicSurvey. A final coordination meeting was held on August 15, 1977, to present the resultsof the study to local officials. Representatives from the study contractor, the FederalInsurance Administration, and the City of Senatobia attended the meeting. No changes orrevisions were required as a result of this meeting.For this countywide FIS, an initial Pre-Scoping Meeting was held on February 16, 2005.A Project Scoping Meeting was held on April 8, 2005. Attendees for these meetingsincluded representatives from the Mississippi Department of Environmental Quality,Mississippi Emergency Management Agency, FEMA National Service Provider, TateCounty, the City of Senatobia, Tate County Emergency Management Agency, the State,and the Study Contractor. Coordination with county officials and Federal, State, andregional agencies produced a variety of information pertaining to floodplain regulations,available community maps, flood history, and other hydrologic data. All problems raisedin the meetings have been addressed.2.0AREA STUDIED2.1Scope of StudyThis FIS covers the geographic area of Tate County, Mississippi.For the March 1978, City of Senatobia FIS, the following flooding sources were studiedby detailed methods: Senatobia Creek; Hickahala Creek Tributaries 1, 2, 2A, 3 and 3A;and Bonner Creek. The areas studied in detail were chosen with consideration given toall forecasted and proposed construction through 1982.Several flooding sources within the county were studied by approximate methods.Approximate analyses are used to study those areas having a low developmental potential2
or minimal flood hazards. The scope and methods of study were proposed to, and agreedupon, by FEMA and the State of Mississippi.For this countywide FIS revision, Table 1 lists the flooding sources incorporated from theJune 4, 2007 DeSoto County, Mississippi FIS revision:TABLE 1. STREAMS NEWLY STUDIED BY DETAILED METHODSFlooding SourceLimits of New Detailed StudyArkabutla ReservoirEntire shoreline within county.Coldwater RiverFrom a point approximately 5.6 miles upstream of PrichardRoad to a point approximately 0.7 mile downstream ofArkabutla Reservoir dam; from a point approximately 4.2 milesupstream of Interstate 55 to the County Boundary.Pigeon Roost CreekFrom a point approximately 0.6 mile downstream of PigeonRoost Road to a point approximately 400 feet downstream ofPigeon Roost Road.Also, floodplain boundaries of stream that have been previously studied by detailedmethods were redelineated based on best available topographic information (MARIS,2004). These include: Senatobia Creek; Hickahala Creek Tributaries 1, 2, 2A, 3 and 3A;and Bonner Creek.2.2Community DescriptionTate County is in northwest Mississippi and is bordered by DeSoto County, Mississippi,on the north; Marshall County, Mississippi, on the east; Panola County, Mississippi, andLafayette County, Mississippi on the south; and Tunica County, Mississippi on the west.The county covers approximately 404 square miles, and has 2 strong municipalities. Thecounty is served by Interstate Route 55, U.S. Highways 51 and 306, and State Highways4 and 305. The county is also served by the Illinois Central Railroad.The 2005 population of Tate County was reported to be 26,548 (U.S. Census Bureau,2007).The economy of Tate County is diverse with manufacturing, retail trade, and health careand social assistance being the largest industries (U.S. Census Bureau, 2007).The topography of Tate County consists of rolling hills with large flat areas in creek andriver bottoms. The climate of the county is generally mild and humid, with abundantrainfall that averages 55.52 inches annually (Mississippi State Climatologist, 2007).Temperatures range from monthly averages of 40 degrees Fahrenheit ( F) in January to83 F in July (National Weather Service, 2007).3
2.3Principal Flood ProblemsThe principle flooding sources affecting Tate County are the Coldwater River (includingArkabutla Reservoir) and Senatobia Creek. Backwater flooding of low-lying areas isprevalent in the county due to low topographic relief. Flooding from Arkabutla Reservoirperiodically affects the Town of Coldwater. Flooding effects from Senatobia andHickahala Creeks are exacerbated by persistent beaver activity.2.4Flood Protection MeasuresArkabutla Reservoir, completed in 1943, is located on the Coldwater River in northernTate County. The reservoir was built as part of the Yazoo Headwaters Project, aimed atreducing flood damage in the Yazoo River basin, and it is operated by the VicksburgDistrict of the U.S. Army Corps of Engineers. The reservoir greatly affects 1-percentannual chance discharges on the Coldwater River downstream, and controls much of the1-percent annual flood elevations in the vicinity of the lake.There are six small flood control reservoirs in southeastern Tate County built as part ofthe NRCS Greasy Creek Watershed Project. However, these are located outside thecontributing drainage area of the study streams for this FIS.3.0ENGINEERING METHODSFor the flooding sources studied by detailed methods in the communities, standard hydrologic andhydraulic study methods were used to determine the flood hazard data required for this study.Flood events of a magnitude that are expected to be equaled or exceeded once on the averageduring any 10-, 50-, 100-, or 500-year period (recurrence interval) have been selected as havingspecial significance for floodplain management and for flood insurance rates. These events,commonly termed the 10-, 50-, 100-, and 500-year floods, have a 10-, 2-, 1-, and0.2-percent chance, respectively, of being equaled or exceeded during any year. Although therecurrence interval represents the long-term, average period between floods of a specificmagnitude, rare floods could occur at short intervals or even within the same year. The risk ofexperiencing a rare flood increases when periods greater than 1 year are considered. Forexample, the risk of having a flood that equals or exceeds the 1-percent-annual-chance flood inany 50-year period is approximately 40 percent (4 in 10); for any 90-year period, the riskincreases to approximately 60 percent (6 in 10). The analyses reported herein reflect floodingpotentials based on conditions existing in the community at the time of completion of this study.Maps and flood elevations will be amended periodically to reflect future changes.3.1Hydrologic AnalysesHydrologic analyses were carried out to establish peak discharge-frequency relationshipsfor each flooding source studied by detailed methods affecting the community.4
March 1978, City of Senatobia FISFor Senatobia Creek, floodflow-frequency data were based on statistical analysis ofstage-discharge records, covering a 24-year period from 1943 to 1966, at the gagingstation located at State Highway 4, approximately 3500 feet east of the corporate limits.The flow-frequency analysis was performed using standard log-Pearson Type IIIdistribution techniques (U.S. Water Resources Council, 1976).For all other streams studied in Senatobia, peak discharges for floods of 10-, 50-, and100-year recurrence intervals were computed from synthetic unit hydrographs andrainfall information obtained from U.S. Weather Bureau Technical Paper No. 40, RainfallFrequency Atlas of the United States (U.S. Department of Commerce, 1961). Thesynthetic unit hydrograph parameters were developed by a combination of Snyder’sMethod and U.S. Soil Conservation Service criteria outlined in the National EngineeringHandbook (USDA, 1972). The base data for Snyder’s Method were obtained from 35years of record from the gaging station of Senatobia Creek in Senatobia and 23 years ofrecord from the gaging station on Clear Creek at State Highway 6, 5 miles west ofOxford, Mississippi. The unit hydrographs were adjusted for urbanization by proceduresdeveloped by the U.S. Army Corps of Engineers and outlined in “Tulsa District Methodsof Urban Hydrology” (USACE, 1990). Discharges for the 500-year floods of all streams,except Senatobia Creek, were computed from the synthetic unit hydrographs and the 500year rainfall as determined by straight-line extrapolation of a single-log graph of rainfallamounts obtained for frequencies up to 100 years.June 4, 2007, DeSoto County, FIS RevisionPeak discharges for Pigeon Roost Creek and Coldwater River upstream from ArkabutlaReservoir were taken from the report entitled “Hydrologic Analysis for the ColdwaterRiver Watershed” (USACE, 1990). Peak discharges from this report were developedusing the HEC-1 computer program. Peak discharges for Coldwater River downstreamof Arkabutla Reservoir were developed from analysis of the Reservoir’s state anddischarge record.A summary of the drainage area-peak discharge relationships for all the streams is shownin Table 2, “Summary of Discharges.”TABLE 2. SUMMARY OF DISCHARGESFLOODING SOURCE AND LOCATIONDRAINAGEAREA 023,00028,50031,00036,000SENATOBIA CREEKAt State Highway 45PEAK DISCHARGES (cfs)
TABLE 2. SUMMARY OF DISCHARGES (Continued)FLOODING SOURCE AND LOCATIONDRAINAGEAREA 74,50097,000HICKAHALA CREEK TRIBUTARY 1At Cross Section AAt Confluence With Unnamed TributaryAt Strayhorn RoadAt Tate StreetHICKAHALA CREEK TRIBUTARY 2At Quality LaneAt West StreetPEAK DISCHARGES (cfs)HICKAHALA CREEK TRIBUTARY 2AAt Strayhorn StreetHICKAHALA CREEK TRIBUTARY 3At Norfleet StreetAt Heard StreetHICKAHALA CREEK TRIBUTARY 3AAt Main StreetBONNER CREEKAt MouthAt Illinois Central Gulf RailroadAt U.S. Highway 51COLDWATER RIVERBelow Arkabutla ReservoirAt County BoundaryPIGEON ROOST CREEKAt confluence with Red Banks Creek*Data not availableAdditional flood elevation data for selected recurrence intervals are shown in Table 3 –Summary of Stillwater Elevations.6
TABLE 3. SUMMARY OF STILLWATER ELEVATIONSELEVATION (NAVD 88)FLOODING .6*Arkabutla Reservoir*Data Not Available3.2Hydraulic AnalysesAnalyses of the hydraulic characteristics of flooding from the sources studied werecarried out to provide estimates of the elevations of floods of the selected recurrenceintervals. Users should be aware that flood elevations shown on the FIRM representrounded whole-foot elevations and may not exactly reflect the elevations shown on theFlood Profiles or in the Floodway Data table in the FIS report. Flood elevations shownon the FIRM are primarily intended for flood insurance rating purposes. For constructionand/or floodplain management purposes, users are cautioned to use the flood elevationdata presented in this FIS report in conjunction with the data shown on the FIRM.March 1978, City of Senatobia, FIS AnalysesCross sections for the backwater analyses were field surveyed and located at closeintervals above and below bridges and culverts in order to compute the significantbackwater effects of these structures in the highly urbanized areas.Locations of selected cross sections used in the hydraulic analyses are shown on theFlood Profiles (Exhibit 1). For stream segments for which a floodway was computed(Section 4.2), selected cross-section locations were also shown on the Flood Boundaryand Floodway Info Map.Channel roughness factors (Manning’s “n”) for these computations were assigned on thebasis of field inspection of flood plain areas. These roughness values varied from 0.025to 0.07 for channels and ranged from 0.02 to 0.08 for the overbanks throughout the studyarea.Water-surface elevations of the floods of the selected recurrence intervals were computedthrough use of the USACE HEC-2 step-backwater computer program (USACE, 1976).Flood profiles were drawn showing the computed water-surface elevations for floods ofthe selected reoccurrence intervals (Exhibit 1). Starting elevations for the streams in thisstudy were developed by the slope-area method.Flood elevations in the city are often raised by debris jams at bridge openings. Thehydraulic analyses for this study were based on the effects of unobstructed flow. Theflood elevations as shown on the profiles are thus considered valid only if hydraulicsstructures, in general, remain unobstructed and do not fail.7
June 4, 2007, DeSoto County, FIS RevisionCross section geometries were obtained from a combination of terrain data and fieldsurveys. Bridges and culverts located within the limited detailed study limits were fieldsurveyed to obtain elevation data and structural geometry.Downstream boundary conditions for the hydraulic models were set to normal depthusing a starting slope calculated from values taken from topographic data, or whereapplicable, derived from the water-surface elevations. Water-surface profiles werecomputed through the use of the USACE HEC-RAS version 3.1.2 computer program(USACE, 2002). The model was run for the 1-percent annual chance storm for thelimited detail and approximate studies.Channel roughness factors (Manning’s “n”) values used in the hydraulic computations forboth channel and overbank areas were based on recent digital orthophotography and fieldinvestigations.Table 4, “Summary of Roughness Coefficients,” shows the ranges of the channel andoverbank roughness factors used in the computations for Coldwater River and PigeonRoost Creek.TABLE 4. SUMMARY OF ROUGHNESS COEFFICIENTSDetailed StreamsCHANNEL “N”FLOODING SOURCECOLDWATER RIVERPIGEON ROOST CREEK0.035-0.1000.060OVERBANK “N”0.040-0.2000.070-0.136Locations of selected cross sections used in the hydraulic analyses are shown on theFlood Profiles (Exhibit 1) and on the FIRM (Exhibit 2).The hydraulic analyses for this countywide FIS were based on unobstructed flow. Theflood elevations shown on the Flood Profiles (Exhibit 1) are thus considered valid only ifhydraulic structures remain unobstructed, operate properly, and do not fail.Qualifying bench marks within a given jurisdiction that are cataloged by the NationalGeodetic Survey (NGS) and entered into the National Spatial Reference System (NSRS)as First or Second Order Vertical and have a vertical stability classification of A, B, or Care shown and labeled on the FIRM with their 6-character NSRS Permanent Identifier.Benchmarks cataloged by the NGS and entered into the NSRS vary widely in verticalstability classification. NSRS vertical stability classifications are as follows:8
Stability A: Monuments of the most reliable nature, expected to holdposition/elevation well (e.g., mounted in bedrock)Stability B: Monuments which generally hold their position/elevation well (e.g.,concrete bridge abutment)Stability C: Monuments which may be affected by surface ground movements(e.g., concrete monuments below frost line)Stability D: Mark of questionable or unknown vertical stability (e.g., concretemonument above frost line, or steel witness post)In addition to NSRS benchmarks, the FIRM may also show vertical control monumentestablished by a local jurisdiction; these monuments will be shown on the FIRM with theappropriate designations. Local monuments will only be placed on the FIRM if thecommunity has requested that they be included, and if the monuments meet theaforementioned NSRS inclusion criteria.To obtain current elevation, description, and/or location information for benchmarksshown on the FIRM for this jurisdiction, please contact the Information Services Branchof the NGS at (301) 713-3242, or visit its website at http://www.ngs.noaa.gov.3.3Vertical DatumAll FIS reports and FIRMs are referenced to a specific vertical datum. The verticaldatum provides a starting point against which flood, ground, and structure elevations canbe referenced and compared. Until recently, the standard vertical datum in use for newlycreated or revised FIS reports and FIRMs was the National Geodetic Vertical Datum of1929 (NGVD29). With the finalization of the North American Vertical Datum of 1988(NAVD88), many FIS reports and FIRMs are being prepared using NAVD88 as thereferenced vertical datum.All flood elevations shown in this Tate County FIS report and on the FIRM arereferenced to NAVD88. Structure and ground elevations in the community must,therefore, be referenced to NAVD88. It is important to note that adjacent communitiesmay be referenced to NGVD29. This may result in differences in Base Flood Elevations(BFEs) across the corporate limits between the communities.Ground, structure, and flood elevations may be compared and/or referenced to NGVD29by applying a conversion factor. To convert elevations from NAVD88 to NGVD29, add0.03 feet to the NAVD88 elevation. The 0.03 feet value is an average for the entirecounty. The adjustment value was determined using the USACE Corpscon 6.0.1computer program (USACE, 2004) and topographic maps (U.S. Department of theInterior, 1972). The BFEs shown on the FIRM represent whole-foot rounded values. Forexample, a BFE of 12.4 feet will appear as 12 feet on the FIRM, and 12.6 feet as 13 feet.Users who wish to convert the elevations in this FIS report to NGVD29 should apply thestated conversion factor to elevations shown on the Flood Profiles and supporting datatables in the FIS report, which are shown at a minimum to the nearest 0.1-foot.9
For more information regarding conversion between the NGVD and the NAVD, see theFEMA publication entitled Converting the National Flood Insurance Program to theNorth American Vertical Datum of 1988 or contact the NGS Information Services;NOAA, N/NGS12; National Geodetic Survey; SSMC-3, #9202; 1315 Internetaddresshttp://www.ngs.noaa.gov).Temporary vertical monuments are often established during the preparation of a floodhazard analysis for the purpose of establishing local vertical control. Although thesemonuments are not shown on the FIRM, they may be found in the Technical SupportData Notebook associated with the FIS report and FIRM. Interested individuals maycontact FEMA to access this data.4.0FLOODPLAIN MANAGEMENT APPLICATIONSThe NFIP encourages State and local governments to adopt sound floodplain managementprograms.Therefore, each FIS provides 1-percent-annual-chance flood elevations anddelineations of the 1- and 0.2-percent-annual-chance floodplain boundaries and 1-percentannual-chance floodway to assist communities in developing floodplain management measures.This information is presented on the FIRM and in many components of the FIS report, includingFlood Profiles, Floodway Data Table and Summary of Stillwater Elevations Table. Users shouldreference the data presented in the FIS report as well as additional information that may beavailable at the local map repository before making flood elevation and/or floodplain boundarydeterminations.4.1Floodplain BoundariesTo provide a national standard without regional discrimination, the1-percent-annual-chance flood has been adopted by FEMA as the base flood forfloodplain management purposes. The 0.2-percent-annual-chance flood is employed toindicate additional areas of flood risk in the community. For each stream studied bydetailed methods, the 1- and 0.2-annual-chance floodplain boundaries have beendelineated using the flood elevations determined at each cross section.The 1- and 0.2-percent-annual-chance floodplain boundaries are shown on the FIRM(Exhibit 2), On this map, the 1-percent-annual-chance floodplain boundary correspondsto the boundary of the areas of special flood hazards (Zones A and AE), and the0.2-percent-annual-chance floodplain boundary corresponds to the boundary of areas ofmoderate flood hazards. In cases where the 1- and 0.2-percent-annual-chance floodplainboundaries are close together, only the 1-percent-annual-chance floodplain boundary hasbeen shown. Small areas within the floodplain boundaries may lie above the floodelevations but cannot be shown due to limitations of the map scale and/or lack of detailedtopographic data.For the streams studied by limited detailed and approximate methods, only the1-percent-annual-chance floodplain boundary is shown on the FIRM (Exhibit 2).Floodplain boundaries for these streams, as well as those streams that have beenpreviously studied by detailed methods, were generated using USGS 10-meter DigitalElevation Models (MARIS, 2004), then refined using detailed hydrographic data.10
4.2FloodwaysEncroachment on floodplains, such as structures and fill, reduces flood-carrying capacity,increases flood heights and velocities, and increases flood hazards in areas beyond theencroachment itself. One aspect of floodplain management involves balancing theeconomic gain from floodplain development against the resulting increase in floodhazard. For purposes of the NFIP, a floodway is used as a tool to assist local communitiesin this aspect of floodplain management. Under this concept, the area of the1-percent-annual-chance floodplain is divided into a floodway and a floodway fringe.The floodway is the channel of a stream, plus any adjacent floodplain areas, that must bekept free of encroachment so that the 1-percent-annual-chance flood can be carriedwithout substantial increases in flood heights. Minimum Federal standards limit suchincreases to 1.0 foot, provided that hazardous velocities are not produced. The floodwaysin this study are presented to local agencies as minimum standards that can be adopteddirectly or that can be used as a basis for additional floodway studies.The floodway presented in this FIS report and on the FIRM was computed for certainstream segments on the basis of equal-conveyance reduction from each side of thefloodplain. Floodway widths were computed at cross sections. Between cross sections,the floodway boundaries were interpolated. The results of the floodway computationshave been tabulated for selected cross sections of detailed study streams (Table 5). Fordetailed study streams, in cases where the floodway and 1-percent-annual-chancefloodplain boundaries are either close together or collinear, only the floodway boundaryis shown.Near the mouths of streams studied in detail, floodway computations are made withoutregard to flood elevations on the receiving water body. Therefore, “Without Floodway”elevations presented in Table 5, “Floodway Data,” for certain downstream cross sectionsare lower than the regulatory flood elevations in that area, which must take into accountthe 1-percent-annual-chance flooding due to backwater from other sources.Encroachment into areas subject to inundation by floodwaters having hazardousvelocities aggravates the risk of flood damage, and heightens potential flood hazards byfurther increasing velocities. For detailed study streams, a listing of stream velocities atselected cross sections is provided in Table 5. In order to reduce the risk of propertydamage in areas where the stream velocities are high, the county may wish to restrictdevelopment in areas outside the floodway.11
The area between the floodway and 1-percent-annual-chance floodplain boundaries istermed the floodway fringe. The floodway fringe encompasses the portion of thefloodplain that could be completely obstructed without increasing the water-surfaceelevation of the 1-percent-annual-chance flood more than 1.0 foot at any point. Typicalrelationships between the floodway and the floodway fringe and their significance tofloodplain development are shown in Figure 1.FLOODWAY SCHEMATIC12Figure 1
FLOODING SOURCECROSS SECTIONBASE FLOODWATER-SURFACE ELEVATION(FEET NAVD EET)MEANVELOCITY(FEET REASESENATOBIA 3,8005,2506,5008,2009,65010,500496
Insurance Administration; and the City of Senatobia. An intermediate coordination meeting was held on September 25, 1975, and was attended by representatives of the city, the Federal Insurance Administration, and the study contractor. During the initial study, telephone conversations and visits were made with the City