Transcription
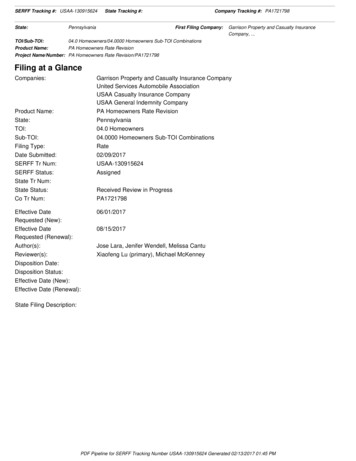
11/4/2014Trends in Homeowners Insurance ClaimsCenter for Insurance Policy & ResearchOctober 7, 2014Trends in Homeowners Insurance Claims Homeowners claim trends countrywide Average claim payment per insured home Frequency Severity The role of catastrophesVolatilityIndividual state trends and differencesData1
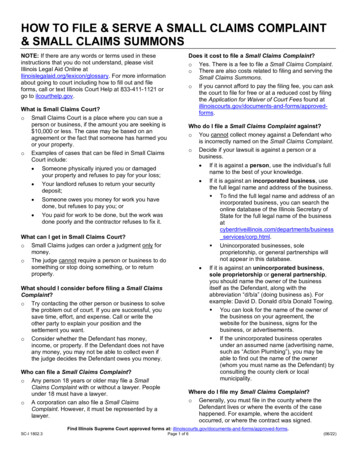
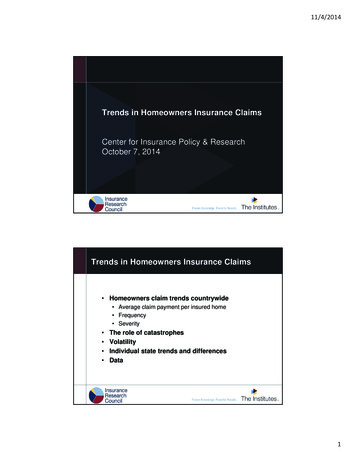
11/4/2014Trends in Homeowners Insurance ClaimsAverage HO Claim Payment per Insured HomeAll Claims, All Policy Forms Combined, Countrywide 625Volatility Index 21%Annualized Growth Rate 5.0% 442 229199719992001200320052007200920112013Trends in Homeowners Insurance ClaimsHO Claim Frequency & SeverityAll Claims, All Policy Forms Combined, Countrywidenumber of claims paid per 100 insured homesaverage payment per paid claim12.010.0 8,7878.6 8,0008.05.06.04.0 10,000 6,000 4,000 2,676 2,0002.00.0 01997199920012003claim severity20052007200920112013claim frequency2
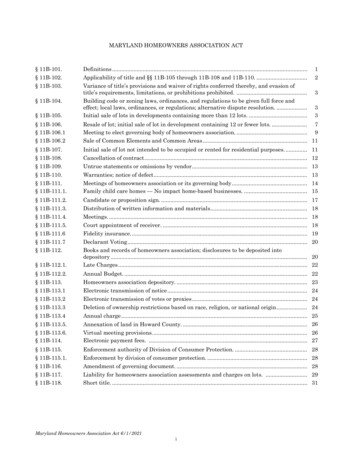
11/4/2014Trends in Homeowners Insurance ClaimsHomeowners ClaimsAll Claims, All Policy Forms Combined, CountrywideAnnualized Change1997-20137.8%Volatility SeverityTrends in Homeowners Insurance ClaimsAnnualized Change1997-20137.8%7.1%5.0%2.4%CPIHO claimpayment perinsured homeHO claimseverityPreparedasphalt and tarroofing andsiding3
11/4/2014Trends in Homeowners Insurance Claims the prices for all asphalt products have risensignificantly. The cokers installed by many refiners allowthem to refine oil in ways that have changed theoil/asphalt dynamic forever the use of cokers meansthere’s less flux left at the end of the oil refining process,resulting in higher costs to the shingle manufacturer. storm-related reroofing now represents a greaterpercentage of the roofing market. The unpredictablenature of extreme weather events makes it much harderfor manufacturers to anticipate demand, often resultingin severe regional shortages of asphalt shingles.Midwest Roofing Contractors AssociationTrends in Homeowners Insurance ClaimsHO Claim Payments by Catastrophe ComponentAll Policy Forms Combined, Countrywide100%90%catastrophe-related claims80%70%60%50%40%30%claims excluding 1120134
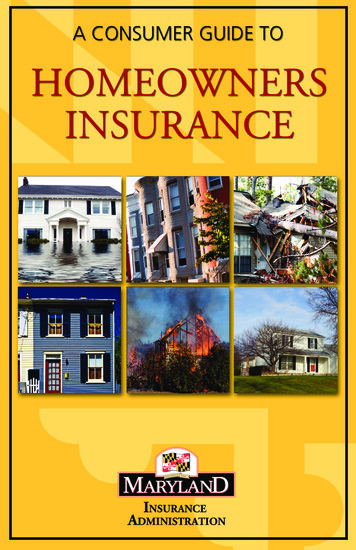
11/4/2014Trends in Homeowners Insurance ClaimsClaim Frequency & Severity, Excluding CatastrophesAll Policy Forms Combined, Countrywidenumber of claims paid per 100 insured homesaverage payment per paid claim12 10,000 8,772108 8,0007.0 6,00064 2,709 4,0003.5 2,0002019971999200120032005claim severity200720092011 02013claim frequencyTrends in Homeowners Insurance ClaimsClaim Frequency & Severity, Catastrophe ClaimsAll Policy Forms Combined, Countrywideaverage payment per paid claimnumber of paid claims per 100 insured homes12 8,82310 10,000 8,0008 6,0006 4,0004 2,5291.5201.61997 2,000 0199920012003claim severity20052007200920112013claim frequency5
11/4/2014Trends in Homeowners Insurance ClaimsAnnualized Change (1997-2013)Claim FrequencyClaim Severity1.3%7%8%CatNon Cat-4.6%CatNon CatVolatility Index (1997-2013)Claim FrequencyClaim Severity95%25%CatNon Cat20%Cat2%Non CatTrends in Homeowners Insurance ClaimsState Trends Absolute costsCost growthRole of catastrophesVolatility6
11/4/2014Trends in Homeowners Insurance ClaimsHO Claim Payment per Insured Home in 2013All Claims, All Policy Forms Combined waiiUtahOregon 500 1,000 1,500 2,000 1,743 218Trends in Homeowners Insurance ClaimsAverage Claim Payment per Insured Home, 2009-20137
11/4/2014Trends in Homeowners Insurance ClaimsHO Claim Payment per Insured HomeAnnualized Growth Rates, nds in Homeowners Insurance ClaimsAnnualized Growth in Average Payment per Insured Home1997-20138
11/4/2014Trends in Homeowners Insurance ClaimsAverage Claim Payment per Insured Home 1,200 1,000 800 600Volatility Index 94% 400VolatilityIndex 50% 200 onTrends in Homeowners Insurance ClaimsVolatility of Average Claim Payment per Insured Home1997-20139
11/4/2014Trends in Homeowners Insurance ClaimsAverage Claim Payments per Insured HomeAll Policy Forms CombinedFourmile Canyon wildfireColoradoand 2 other events 936 9194 PCS-designatedcatastrophe events 827 638 417 291 2041997 2731999 205 361 261 284 269 250 247200120052003Noncatastrophe claims2007 698 399200920112013Catastrophe claimsTrends in Homeowners Insurance ClaimsAverage Claim Payments per Insured HomeAll Policy Forms CombinedOklahoma3 PCS-designatedcatastrophe events 1,67310 PCS-designatedcatastrophe events 1,319 1,279 893 2621997 1,743 1,119 977 541 506 466 511 407 484 370 363 011Catastrophe-related10
11/4/2014Trends in Homeowners Insurance ClaimsAverage Claim Payments per Insured HomeAll Policy Forms CombinedMississippiHurricanes Cindy, Katrina, Rita, 4,427and 5 other PCS-designatedcatastrophe events 1,762 1,456 903 703 255 372 30419971999 536 390 474 3442001200320052007Noncatastrophe-related 1,081 654 721 774 555200920112013Catastrophe-relatedTrends in Homeowners Insurance ClaimsAverage Claim Payment per Insured HomeAll Policy Forms CombinedFloridaHurricanes Charley, Frances,Jeanne and Ivan 1,946Hurricanes Dennis, Katrina, Rita,Wilma and 1 other PCS-designatedcatastrophe event 1,349 777 555 538 462 425 494 497 507 258 170 189 185 184 235 00920112013Catastrophe-related11
11/4/2014Trends in Homeowners Insurance ClaimsAverage Claim Payment per Insured HomeAll Policy Forms CombinedTexas7 PCS-designatedcatastrophe events 914 745Hurricanes Dolly, 1,026Ike and 9 otherPCS-designated 870catastrophe events 794 634 606 591 555 374 340 344 3651997Bastropwildfire 275199920012003 332 3372005Noncatastrophe-related 551200720092011Catastrophe-relatedTrends in Homeowners Insurance ClaimsAverage Claim Payment per Insured Home AllPolicy Forms CombinedCalifornia3 PCS-designatedcatastrophe events 266 280 267 26619971999 3252001 349 455 440 395 343 28620032005Noncatastrophe-related 312 2622007 363 348 352 355200920112013Catastrophe-related12
11/4/2014Trends in Homeowners Insurance ClaimsPercentage of Total Claim Payments Attributed to Catastrophes2009-2013Trends in Homeowners Insurance Claims Overall countrywide trends Loss costs trending up 5% annually Decreasing, but volatile, claim frequency overall Rapid increase in claim severity Volatility is primarily a function of the frequency ofcatastrophe-related claims Substantial differences across states In a given year, loss costs can vary by a factor of 8 Modeled growth rates vary even more Volatility due primarily, but not entirely, to catastrophe claims Limitations of linear trend13
11/4/2014Trends in Homeowners Insurance ClaimsCenter for Insurance Policy & ResearchOctober 7, 201414
Trends in Homeowners Insurance Claims-2.6% 7.8% Frequency Severity Annualized Change 1997-2013 45% 5% Frequency Severity Volatility Index 1997-2013 Homeowners Claims All Claims, All Policy Forms Combined, Countrywide Trends in Homeowners Insurance Claims 2.4% 5.0% 7.8% 7.1% CPI HO claim payment per insured home HO claim severity Prepared .