Transcription
DNO ASAInterim ResultsFirst Quarter 2021
Cover photo: Erecting 40 meter communication towers at Tawke and Peshkabir fields, Kurdistan region of Iraq
Key figuresQuartersUSD millionFull-YearQ1 2021Q4 2020Q1 20202020Key financialsRevenues169.8174.2205.6Gross profit84.035.138.4614.924.9Profit/-loss from operating activities66.3-14.2-11.5-314.5Net 3135.1559.1Acquisition and development costs50.851.496.7207.9Exploration 8299,16297,942105,042100,063ProductionGross operated production (boepd)Net production (boepd)Key performance indicatorsLifting costs (USD/boe)Netback (USD/boe)4.94.85.24.915.134.414.115.3Effective Q1 2021, the Company reports its net production from the Tawke license in Kurdistan based on its percentage ownership in the license.For more details, see the section on operational review.For more information about key figures, see the section on alternative performance measures.First Quarter 2021 Interim Results 3
Corporate overviewReturn to profitability DNO returned to profitability during the first quarter of 2021, reportingoperating profit of USD 66 million First quarterly operating profit since the onset of the pandemic, driven bysolid production, cost optimizations and higher oil prices Stepped up spend in Kurdistan in Q1 2021 with drilling of new wells andworkover of existing ones, raising net production to 99,200 barrels of oilequivalent per day (boepd) across portfolio Regularization of payments in Kurdistan, including payments towards2019 and 2020 arrears, rapidly increasing cash flow Which combined with significant cash position of USD 477 million at endQ1 2021 provides window to reduce debtProjecting high activity In Kurdistan, 12 Tawke license wells budgeted in 2021, of which nine inTawke field and three in Peshkabir field Following a strong first quarter, guiding full-year 2021 gross operatedTawke license production of 110,000 barrels of oil per day (bopd) Barring pandemic derailing of global economic activity, plan full yearoperational spend of USD 700 million Active drilling program in the North Sea with five exploration and eightdevelopment wells during the balance of 2021 DNO is a 50-year-old oil exploration and production company longcommitted, by choice, to industry leading ethical practices, contributionsto societal advancement and a light environmental footprint4 DNO ASA
Q1 2021 operational highlights Gross operated Tawke license production averaged 112,000 bopd in Q12021 (110,200 bopd in Q4 2020) of which 84,000 bopd net to DNO’sinterest (82,600 bopd in Q4 2020) North Sea assets contributed another 15,200 boepd in Q1 2021 (15,300boepd in Q4 2020) Totaling net production of 99,200 boepd in Q1 2021, up from 97,900boepd in Q4 2020 Tawke license outperformed expectations in Q1 2021 notwithstandinglimited 2020 drilling following onset of pandemic Fourth injector well expands Peshkabir-to-Tawke gas capture andreinjection project DNO had 94 licenses across its portfolio at end Q1 2021 (25 operated),of which two in Kurdistan, 75 in Norway, 13 in the United Kingdom (UK),two in the Netherlands, one in Ireland and one in YemenQ1 2021 financial highlights Q1 2021 revenues of USD 170 million, slightly down from USD 174million in Q4 2020 due to lower North Sea cargo liftings USD 66 million operating profit in Q1 2021, reversing operating losses inprevious four quarters In Q1 2021, Kurdistan initiated principal payments towards Tawkelicense 2019 and 2020 withheld entitlement and override amounts whichtotaled USD 259 million net to DNO at yearend 2020 USD 75 million received from Kurdistan in Q1 2021 (entitlement USD64.4 million, override USD 4.3 million and USD 6.2 million towardsarrears), plus USD 54 million following end of quarter (entitlement USD35.2 million, override USD 4.6 million and USD 14.2 million towardsFirst Quarter 2021 Interim Results 5
arrears) Exited Q1 2021 with cash balance of USD 477 million and USD 239million in remaining Kurdistan arrears obligations Exercised call option to retire USD 100 million in bond debt on 1 June2021 of the USD 400 million DNO02 bond6 DNO ASA
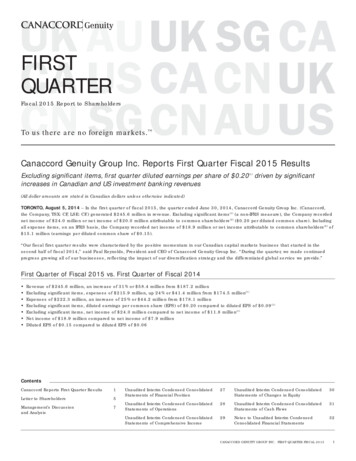
Operational reviewProductionQuarterly net production (boepd)Gross operated production averaged 111,985 bopd during thefirst quarter, compared to 110,176 bopd in the previous quarter.Net production by segment (boepd)The Company has historically reported its net production andreserves from licenses governed by PSCs/PSAs on a CompanyWorking Interest (CWI) basis, which was calculated after royaltyand included DNO’s additional share of cost oil covering itsadvances towards the government carried interest. In the Tawkelicense in Kurdistan, the CWI figures also included productionand reserves attributable to the additional three percent of grosslicense revenues under the August 2017 receivables settlementagreement with the Kurdistan Regional Government (KRG).Effective Q1 2021, the Company reports its net production basedon its percentage ownership in the license. The main reason forthe change is to improve comparability with peer companies andto show the Company’s share of production before governmenttake. Comparison figures have been updated.Net production during the first quarter stood at 99,162 boepd,compared to 97,942 boepd in the previous quarter. In Kurdistan,net production averaged 83,989 bopd, up from 82,632 bopd inthe previous quarter. Net production from the North Seaaveraged 15,173 boepd, compared to 15,309 boepd in theprevious quarter.Net entitlement (NE) production averaged 43,766 boepd duringthe first quarter, down from 48,727 boepd in the previousquarter.Gross operated productionboepdQ1 2021QuartersFull-YearQ4 2020 Q1 20202020KurdistanNorth 110,282110,282The table above shows gross operated production (boepd) from the Group'soperated licenses.Net productionboepdKurdistanNorth SeaTotalQ1 202183,98915,17399,162QuartersFull-YearQ4 2020 Q1 117,352100,063Net entitlement (NE) productionboepdKurdistanNorth SeaTotalQ1 202128,59315,17343,766QuartersFull-YearQ4 2020 Q1 17,35253,609The NE production from the North Sea equals the segment’s net production.First Quarter 2021 Interim Results 7
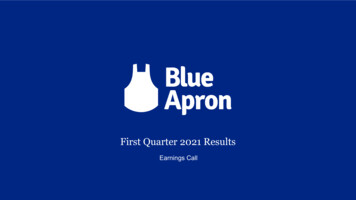
Activity overviewKurdistan region of IraqNorth SeaTawke licenseNet production averaged 15,173 boepd in the North Sea duringthe first quarter of 2021 (15,309 boepd in Q4 2020), of which14,275 boepd was in Norway and 898 boepd in the UK (14,559boepd and 750 boepd in Q4 2020).Gross production from the Tawke license, containing the Tawkeand Peshkabir fields, averaged 111,985 bopd during the firstquarter of 2021 (110,176 bopd in Q4 2020). Peshkabir fieldcontributed 61,350 bopd (56,317 in Q4 2020) and Tawke fieldcontributed 50,635 bopd (53,859 in Q4 2020) during this period.In the first quarter, the Company stepped up its spend inKurdistan with drilling of two new wells and workover of existingones. Altogether twelve Tawke license wells are budgeted in2021, of which nine in the Tawke field and three in the Peshkabirfield.A fourth injector well expanded the Peshkabir-to-Tawke gascapture and reinjection project in the first quarter, lifting injectionto record rates in April (four billion cubic feet accumulated todate), supporting oil recovery at Tawke while reducing CO2emissions from flaring.DNO holds a 75 percent operated interest in the Tawke andPeshkabir fields with partner Genel Energy plc (25 percent).Baeshiqa licenseIn February 2021, the Company announced the acquisition ofExxonMobil’s 32 percent interest in the Baeshiqa license inKurdistan, doubling DNO’s operated stake to 64 percent (80percent paying interest), pending government approval. TheCompany plans to continue an exploration and appraisalprogram on the license while fast tracking early production fromexisting wells, subject to government approval.The other partners in the license are TEC with a 16 percentinterest (20 percent paying interest) and the Kurdistan RegionalGovernment (KRG) with a 20 percent carried interest.8 DNO ASAIn the first quarter, the Company had diversified productionacross 11 fields of which eight were in Norway and three in theUK.Temporary Norwegian petroleum tax incentives are drivingstepped-up investment plans. The Company is moving towardconcept selection for the Brasse field, actively evaluatingIris/Hades, Alve Gjøk, Orion/Syrah and Trym South discoveriesfor project sanction in 2022 and accelerating infill drilling at Ula,Tambar, Brage and Oda producing fields in 2021.In the North Sea, two wells were drilled in the first quarter,including the Røver Nord discovery well which was spudded latelast year. Altogether 15 wells are expected to be drilled in theNorth Sea during 2021, all but one in Norway. DNO-operateddecommissioning of the shut-down Oselvar field in Norwaycommenced in the first quarter, while its Schooner and Ketchdecommissioning campaign in the UK is expected to resume inmid-2021.
Financial reviewRevenues, operating profit and cashRevenues in the first quarter stood at USD 169.8 million, downfrom USD 174.2 million in the previous quarter. Kurdistangenerated revenues of USD 123.4 million (USD 95.8 million inthe previous quarter), while the North Sea generated revenues ofUSD 46.5 million (USD 78.4 million in the previous quarter). Thedecrease in revenues compared to the previous quarter wasprimarily driven by lower cargo liftings in the North Sea mainlyfrom the Ula area fields and Vilje field, partly offset by higherrealized oil prices.The Group reported an operating profit of USD 66.3 million in thefirst quarter, compared to an operating loss of USD 14.2 millionin the previous quarter. The improved operating result in the firstquarter compared to the previous quarter was primarily driven byhigher oil prices, lower cost of goods sold and no impairmentcharges recognized in the quarter.The Group ended the quarter with a cash balance ofUSD 477.1 million and USD 472.9 in net interest-bearing debt,compared to USD 477.1 million and USD 472.5 million atyearend 2020, respectively.Cost of goods soldIn the first quarter, the cost of goods sold stood at USD 85.8million, compared to USD 139.1 million in the previous quarter.The cost of goods sold in the first quarter was positivelyimpacted by an increase in North Sea net underlift positionprimarily driven by lower cargo liftings in the North Sea (see Note4), and lower DD&A in Kurdistan.Lifting costs stood at USD 43.9 million in the first quarter,compared to USD 43.5 million in the previous quarter. InKurdistan, the average lifting cost during the first quarter stood atUSD 2.9 per barrel. In the North Sea, the average lifting costduring the first quarter stood at USD 16.0 per barrel of oilequivalent (boe).KurdistanNorth SeaTotal(USD/boe)KurdistanNorth SeaAverageDD&A from the Group’s oil and gas production assets amountedto USD 51.3 million in the first quarter compared to USD 77.4million in the previous quarter. The decrease in DD&A comparedto the previous quarter was mainly related to Kurdistan and wasdriven by lower net entitlement volumes in the quarter, and adecrease in the DD&A per barrel following the annual update inreserves at yearend 2020. Updates in reserves basis affectingthe depreciation calculations are reflected prospectively.USD millionKurdistanNorth SeaTotal(USD/boe)KurdistanNorth SeaAverageQ1 202122.021.943.9Q1 20212.916.04.9QuartersFull-YearQ4 2020 Q1 2020202028.814.843.527.222.049.294.586.6181.1Q1 202130.321.051.3Q1 202111.815.413.0QuartersFull-YearQ4 2020 Q1 artersFull-YearQ4 2020 Q1 ation costs expensedExploration costs expensed of USD 10.5 million in the firstquarter were mainly related to exploration activities in the NorthSea. The decrease in exploration costs expensed compared tothe previous quarter was primarily due to capitalization ofsuccessful drilling of the Røver Nord discovery.USD millionKurdistanNorth SeaTotalLifting costsUSD millionDepreciation, depletion and amortization(DD&A)Q1 20210.310.110.5QuartersFull-YearQ4 2020 Q1 on and development costsAcquisition and development costs stood at USD 50.8 million inthe first quarter, of which USD 13.8 million was in Kurdistan andUSD 36.8 million in the North Sea.USD millionKurdistanNorth SeaOtherTotalQ1 202113.836.80.150.8QuartersFull-YearQ4 2020 Q1 207.9QuartersFull-YearQ4 2020 Q1 202020203.810.54.83.513.05.23.113.64.9First Quarter 2021 Interim Results 9
Consolidated statements of comprehensive incomeQuarters(unaudited, in USD million)RevenuesCost of goods soldNoteFull-YearQ1 2021Q1 202020202,3169.8205.6614.94-85.8-167.2-590.0Gross profit84.038.424.9Administrative expenses-5.54.6-4.8Other operating expenses-1.7-0.6-2.7-276.0Impairment oil and gas assets7--39.2Exploration s from operating activitiesFinancial incomeFinancial expenses99,10Profit/-loss before income taxTax 1-425.85.010.7139.851.5-39.4-285.9Currency translation differences3.9-111.0-3.6Items that may be reclassified to profit or loss in later periods3.9-111.0-3.6Net profit/-lossOther comprehensive incomeNet fair value changes from financial instruments4.7-15.0-8.4Items that are not reclassified to profit or loss in later periods4.7-15.0-8.4Total other comprehensive income, net of uity holders of the parent60.1-165.5-298.0Earnings per share, basic (USD per share)0.05-0.04-0.29Earnings per share, diluted (USD per share)0.05-0.04-0.29975.43976.62975.73Total comprehensive income, net of tax8Net profit/-loss attributable to:Equity holders of the parentTotal comprehensive income attributable to:Weighted average number of shares outstanding (excluding treasury shares) (millions)10 DNO ASA
Consolidated statements of financial positionASSETS(unaudited, USD million)At 31 MarNote2021At 31 Dec20202020Non-current assetsGoodwill7Deferred tax assets646.351.647.4Other intangible assets7315.7318.3308.6Property, plant and equipment71,166.21,220.91,174.1Financial investments817.36.012.6Other non-current receivables952.8-182.4Tax receivables6Total non-current Current assetsInventories436.829.141.9Trade and other receivables9447.6483.1239.6Tax receivables678.3134.963.1477.1543.2477.1Total current assets1,039.81,190.2821.6TOTAL ASSETS2,802.13,048.22,708.7Cash and cash equivalentsEQUITY AND LIABILITIES(unaudited, USD million)At 31 MarNote2021At 31 Dec20202020EquityShareholders' equity905.7978.2845.6Total equity905.7978.2845.6Non-current liabilitiesDeferred tax liabilities6204.7170.8178.8Interest-bearing liabilities10936.0943.3934.2Lease liabilities1113.39.713.9Provisions for other liabilities and charges11Total non-current rent liabilitiesTrade and other payables190.1274.1180.3Income tax payable6---Current interest-bearing liabilities10-212.9-Current lease liabilities113.83.03.8Provisions for other liabilities and charges11117.793.9112.0311.6583.9296.1Total liabilities1,896.42,069.91,863.0TOTAL EQUITY AND LIABILITIES2,802.13,048.22,708.7Total current liabilitiesFirst Quarter 2021 Interim Results 11
Consolidated cash flow statementQuarters(unaudited, in USD million)NoteFull-YearQ1 2021Q1 202046.5-50.12020Operating activitiesProfit/-loss before income tax-425.8Adjustments to add/-deduct non-cash items:Exploration cost capitalized in previous years carried to cost5--0.4Depreciation, depletion and amortization453.0107.5361.4Impairment oil and gas assets7276.0-39.2Amortization of borrowing issue costs1.42.67.6Accretion expense on ARO provisions4.54.317.0Interest expense18.822.387.3Interest nge in working capital items and provisions:- Inventories- Trade and other receivables9- Trade and other payables- Provisions for other liabilities and charges-70.9-4.641.19.7-14.8-108.53.25.5-2.7Cash generated from operations67.795.3235.8Tax refund received15.2-236.3Interest receivedInterest paidNet cash from/-used in operating esting activitiesPurchases of intangible assets-7.5-18.7-45.7Purchases of tangible assets-43.3-78.0-162.2Payments for decommissioning-12.0-16.7-30.7Net cash from/-used in investing activities-62.8-113.4-238.6Financing activitiesProceeds from borrowings net of issue costs10-131.0152.3Repayment of borrowings10--20.0-290.3Purchase of treasury shares--17.7-17.8Payments of lease liabilities-1.1-0.7-3.4Net cash from/-used in financing activities-1.192.5-159.1Net increase/-decrease in cash and cash equivalents-0.257.6-8.6Cash and cash equivalents at beginning of the period477.1485.7485.7Exchange gain/-losses on cash and cash equivalents0.2-477.1543.2477.112.713.713.6Cash and cash equivalents at the end of the periodOf which restricted cash12 DNO ASA-
Consolidated statement of changes in equityOther comprehensive incomeOther paid-inShare(unaudited, in USD million)Total shareholders' equity as of 31 December 2019Sharecapital premiumFair valueCurrencycapital/Other changes .31,161.3Fair value changes from equity instruments----15.0---15.0Currency translation differences-----111.0--111.0Other comprehensive income/-loss----15.0-111.0--126.0Profit/-loss for the period------39.4-39.4Total comprehensive income----15.0-111.0-39.4-165.4Purchase of treasury shares-0.4--17.3----17.7Transactions with shareholders-0.4--17.3----17.7Total shareholders' equity as of 31 March 202032.9247.7-47.529.5-172.4887.8978.2Other comprehensive incomeOther paid-inShare(unaudited, in USD million)Total shareholders' equity as of 31 December 2020capitalSharepremiumFair valueCurrencycapital/Other changes quityreservesinstruments32.9247.7-36.1Fair value changes from equity instruments---Currency translation differences---Other comprehensive income/-loss---Profit/-loss for the period---Total comprehensive income---4.7Purchase of treasury shares---Transactions with shareholders---32.9247.7-Total shareholders' equity as of 31 March 1.53.951.560.1--------40.8-61.1645.4905.7First Quarter 2021 Interim Results 13
Notes to the consolidated interim financial statementsNote 1 Basis of preparation and accounting policiesPrincipal activities and corporate informationDNO ASA (the Company) and its subsidiaries (DNO or the Group) are engaged in international oil and gas exploration, development and production.Basis of preparationDNO ASA’s consolidated interim financial statements have been prepared in accordance with International Accounting Standard (IAS) 34 Interim FinancialReporting and IFRS standards issued and effective at date of reporting as adopted by the EU. These interim financial statements have also been prepared inaccordance with Oslo Stock Exchange regulations.The interim financial statements do not include all of the information and disclosures required in the annual financial statements and should be read inconjunction with the DNO ASA Annual Report and Accounts 2020.The interim financial information for 2021 and 2020 is unaudited.Subtotals and totals in some of the tables included in these interim financial statements may not equal the sum of the amounts shown due to rounding.The interim financial statements have been prepared on a historical cost basis, with the following exception: liabilities related to share-based payments,derivative financial instruments and equity instruments are recognized at fair value. A detailed description of the accounting policies applied is included in theDNO ASA Annual Report and Accounts 2020.The accounting policies adopted in the preparation of the interim financial statements are consistent with those followed in the preparation of DNO ASA AnnualReport and Accounts 2020.14 DNO ASA
Note 2 Segment informationThe Group reports the following two operating segments: Kurdistan and the North Sea (which includes the Group’s oil and gas activities in Norway and the UK).The segment assets/liabilities do not include internal receivables/liabilities.TotalFirst quarter ending 31 March 2021USD millionNoteKurdistan North SeaOtherUn-reporting allocated/Totalsegments eliminatedGroupIncome statement informationRevenues3Inter-segment revenuesCost of goods 8Gross profit71.013.9-84.8-0.884.0Profit/-loss from operating l income/-expense (net)Tax income/-expense4123.49,106-19.9Net profit/-loss5.051.5Financial position informationNon-current assets684.31,048.5-1,732.829.51,762.3Current 4.92,453.0349.12,802.1Non-current liabilities61.1726.6-787.7797.11,584.8Current liabilities64.3201.329.8295.416.2311.6Total liabilities125.4927.829.81,083.1813.31,896.4Total assetsFirst Quarter 2021 Interim Results 15
Note 2 Segment information (continued)TotalFirst quarter ending 31 March 2020USD millionNoteKurdistan North SeaOtherUn-reporting allocated/Totalsegment eliminatedGroupIncome statement 5.8--166.4-0.8-167.2Gross profit34.05.2-39.2-0.838.4Profit/-loss from operating Inter-segment revenuesCost of goods sold4Financial income/-expense (net)10Tax income/-expense6205.6-38.6Net profit/-loss10.7-39.4Financial position informationNon-current assetsCurrent assetsTotal assetsNon-current 43,048.258.2707.90.3766.4719.51,485.9Current liabilities105.1297.627.9430.6153.3583.9Total liabilities163.31,005.528.21,197.0872.92,069.916 DNO ASA
Note 3 RevenuesQuartersUSD millionFull-YearQ1 2021Q1 2020147.2194.1566.617.65.927.5Sale of natural gas liquids (NGL)3.74.514.8Tariff income1.21.16.0169.8205.6614.9Sale of oilSale of gasTotal revenues from contracts with customers2020Note 4 Cost of goods sold/ InventoryQuartersUSD millionFull-YearQ1 2021Q1 9.6-1.1-11.3Production costs based on sold volumes-32.8-59.7-228.6Depreciation, depletion and amortization-53.0-107.5-361.4Total cost of goods sold-85.8-167.2-590.0Lifting costsTariff and transportation expensesProduction costs based on produced volumesMovement in overlift/underlift2020Lifting costs consist of expenses related to the production of oil and gas, including operation and maintenance of installations, well intervention activities andinsurances. Tariff and transportation expenses consist of charges incurred by the Group for the use of infrastructure owned by other companies in the NorthSea.At 31 MarUSD million2021At 31 Dec20202020Spare parts36.829.141.9Total inventory36.829.141.9Total inventory of USD 36.8 million as of 31 March 2021 was related to Kurdistan (USD 19.8 million) and the North Sea (USD 17.0 million). The accountingprovision for obsolete inventory was USD 20.4 million, of which USD 18.1 million was related to Kurdistan (unchanged from yearend 2020) and USD 2.3 wasrelated to the North Sea.First Quarter 2021 Interim Results 17
Note 5 Exploration expensesQuartersUSD millionFull-Year2020Q1 2021Q1 2020Exploration expenses (G&G and field surveys)-5.4-6.0-16.1Seismic costs-0.6-0.4-2.9Exploration cost capitalized in previous years carried to costExploration costs capitalized this year carried to costOther exploration cost expensedTotal exploration -55.9Exploration costs expensed in the first quarter were mainly related to exploration activities in the North Sea.Note 6 Income taxesQuartersUSD millionFull-YearQ1 2021Q1 20202020-27.2-7.711.132.218.4128.85.010.7139.8Tax income/-expenseChange in deferred taxesIncome tax receivable/-payableTotal tax income/-expenseAt 31 MarUSD million2021At 31 Dec20202020Income tax receivable/-payableTax receivables 46.351.647.4Deferred tax liabilities-204.7-170.8-178.8Net deferred tax assets/-liabilities-158.4-119.1-131.4Tax receivables (current)Income tax payableNet tax receivable/-payableDeferred tax assets/-liabilitiesDeferred tax assetsThe tax income, tax receivables and recognized deferred tax assets/-liabilities relate to activity on the NCS and the UK Continental Shelf (UKCS). Current taxreceivables consist of tax value of incurred losses on the NCS for 2020 (USD 33.6 million), 2021 (USD 29.0 million) and decommissioning tax refund on theUKCS for 2020 (USD 15.7 million). Non-current tax receivable is related to decommissioning tax refund on the UKCS for 2021. During the first quarter of 2021,DNO has received a tax refund of USD 15.2 million in Norway. The refund of the remaining tax losses incurred in 2020 will be paid out during the second quarterof 2021. The refund of tax losses on the NCS incurred in 2021 will be paid out in six instalments every two months with the first instalment to be received on 1August 2021. The decommissioning tax refund on the UKCS for 2020 is expected during the third quarter of 2021 and for spend in 2021 during the third quarterof 2022.On 19 June 2020, the Norwegian Parliament approved certain time limited changes to the taxation of oil and gas companies operating on the NorwegianContinental Shelf (NCS) with effect from the income year 2020. The changes comprise of immediate expensing of investments in the special tax basis,increased uplift from 20.8 percent over four years to 24.0 percent in the first year and cash refund of tax value of losses incurred in the income years 2020 and2021. The temporary changes will also apply to investments where the Plan for Development and Operation (PDO) is delivered within 31 December 2022 andapproved within 31 December 2023.Under the terms of the Production Sharing Contracts (PSC) in the Kurdistan region of Iraq, the Company’s subsidiary, DNO Iraq AS, is not required to pay anycorporate income taxes. The share of profit oil of which the government is entitled to is deemed to include a portion representing the notional corporate incometax paid by the government on behalf of DNO. Current and deferred taxation arising from such notional corporate income tax is not calculated for Kurdistan asthere is uncertainty related to the tax laws of the KRG and there is currently no well-established tax regime for international oil companies. This is an accountingpresentational issue and there is no corporate income tax required to be paid.Profits/-losses by Norwegian companies from upstream activities outside of Norway are not taxable/deductible in Norway in accordance with the General TaxAct, section 2-39. Under these rules only certain financial income and expenses are taxable in Norway.18 DNO ASA
Note 7 Intangible assets/ Property, plant and equipment (PP&E)QuartersUSD millionFull-YearQ1 2021Q1 ns of other intangible assetsAdditions of other intangible assets through business combinationsAdditions of PP&EAdditions of PP&E through business combinationsAdditions of RoU assetsAdditions of RoU assets through business combinations--Impairment oil and gas assets--39.22020-276.0Additions of intangible assets are related to capitalized exploration costs, license interests and administrative software. Additions of PP&E are related todevelopment assets, production assets including changes in estimate of asset retirement, and other PP&E. Additions of right-of-use (RoU) assets are related tolease contracts under IFRS 16 Leases (presented as part of the PP&E balance sheet item).Impairment assessmentAt each reporting date, the Group assesses whether there is an indication that an asset may be impaired. An assessment of the recoverable amount is madewhen an impairment indicator exists. Goodwill is tested for impairment annually or more frequently when there are impairment indicators. Impairment isrecognized when the carrying amount of an asset or a cash-generating unit (CGU), including associated goodwill, exceeds the recoverable amount. Therecoverable amount is the higher of the asset’s fair value less cost to sell and the value in use.As of 31 March 2021, the Company did not identify any impairment indicators and as such no impairment testing was performed.First Quarter 2021 Interim Results 19
Note 8 Financial investmentsFinancial investments are comprised of equity instruments and are recorded at fair value (market price, where available) at the end of the reporting period. Fairvalue changes are included in other comprehensive income (FVTOCI).QuartersUSD millionBeginning of the periodFair value changes through other comprehensive income (FVTOCI)Total financial investments end of the 417.36.012.6Financial investments include the following:At 31 MarUSD million2021At 31 Dec20202020Listed securities:RAK Petroleum plc17.36.012.6Total financial investments17.36.012.6As of 31 March 2021, the Company held a total of 15,849,737 shares in RAK Petroleum plc. RAK Petroleum plc is listed on the Oslo Stock Exchange. Throughits subsidiary, RAK Petroleum Holdings B.V., RAK Petroleum plc is the largest shareholder in DNO ASA with 44.94 percent of the total issued shares. Change infair value during the quarter was recognized in other comprehensive in
First Quarter 2021 Interim Results 3. Key figures. Quarters Full-Year USD million Q1 2021 Q4 2020 Q1 2020 2020 Key financials. Revenues 169.8 174.2 205.6 614.9