Transcription
ReportDCH4: Data integration, standardisationand energy baselining reportAuthors: Will Borghei, Giles Browne, Mark GoldsworthyNovember 2021CSIRO
About i-HubThe Innovation Hub for Affordable Heating and Cooling (i-Hub) is an initiative led by the Australian Institute of Refrigeration, AirConditioning and Heating (AIRAH) in conjunction with CSIRO, Queensland University of Technology (QUT), the University ofMelbourne and the University of Wollongong and supported by Australian Renewable Energy Agency (ARENA) to facilitate theheating, ventilation, air conditioning and refrigeration (HVAC&R) industry’s transition to a low emissions future, stimulate jobsgrowth, and showcase HVAC&R innovation in buildings.The objective of i-Hub is to support the broader HVAC&R industry with knowledge dissemination, skills-development and capacitybuilding. By facilitating a collaborative approach to innovation, i-Hub brings together leading universities, researchers, consultants,building owners and equipment manufacturers to create a connected research and development community in Australia.This Project received funding from ARENA as part of ARENA's Advancing Renewables Program.The views expressed herein are not necessarily the views of the Australian Government, and the AustralianGovernment does not accept responsibility for any information or advice contained herein.Primary Project PartnerThe information or advice contained in this document is intended for use only by persons who have had adequate technical training in the field towhich the Report relates. The information or advice should be verified before it is put to use by any person. Reasonable efforts have been taken toensure that the information or advice is accurate, reliable and accords with current standards as at the date of publication. To maximum extentpermitted by law, the Australian Institute of Refrigeration, Air Conditioning and Heating Inc. (AIRAH), its officers, employees and agents:a) disclaim all responsibility and all liability (including without limitation, liability in negligence) for all expenses, losses, damages and costs, whetherdirect, indirect, consequential or special you might incur as a result of the information in this publication being inaccurate or incomplete in any way,and for any reason; andb) exclude any warranty, condition, guarantee, description or representation in relation to this publication, whether express or implied.In all cases, the user should be able to establish the accuracy, currency and applicability of the information or advice in relation to any specificcircumstances and must rely on his or her professional judgment at all times.Report: DCH4 Data integration, standardisation and energy baseliningThe Innovation Hub for Affordable Heating and Cooling iHub.org.auPage 2
Project title: Sustainability monitoring and energy innovation in 5 NSW Govt Buildings(DCH4)This project aims to evaluate the suitability of DCH as a data platform for Property NSW (PNSW) operations. Thisproject aims to ingest data from 5 buildings into the DCH, and evaluate the ability of the DCH to store, organise andstructure the data in a standardised framework, such that anyone can query the information with high level ofconfidence, in order to generate business insights and actions that help optimise building performance, manageenergy consumption and solar PV generation, and reduce R&M costs.Lead organisationPNSWProject commencement dateMarch, 2021Completion dateJune 2022Date published16th Nov 2021Contact nameWill BorgheiEmailWill.borghei@csiro.auProject websiteReport: DCH4 Data integration, standardisation and energy baseliningThe Innovation Hub for Affordable Heating and Cooling iHub.org.auPage 3
ContentsDCH integration and standardisation . 51.1Data Ingestion. 61.2Semantic Model Creation . 81.3Data and model usage . 101.4Learnings from the exercise . 13Energy baselining study . 14Details of data streams used for the study : . 14Prince Albert site : . 14Lithgow site : . 15Measurement and Verification (M&V) for two sites : . 16Appendices . 20A. Utility Meter Providers (CSV through FTP) . 20B. Site Data Breakdown. 2161 Railway pde Lithgow . 211 Prince Albert Rd, Sydney . 2487 Cooper Street, Cootamundra . 2743-45 Johnston St, Wagga Wagga . 31104-110 Banna Ave, Griffith . 34Report: DCH4 Data integration, standardisation and energy baseliningThe Innovation Hub for Affordable Heating and Cooling iHub.org.auPage 4
DCH integration and standardisationAs part of managing data from five PNSW buildings, these buildings were onboarded to DCH platform. Onboarding isthe process of linking data sources from buildings/sites to the DCH cloud data platform, including building structureand layout information and buildings operations data from building energy systems, equipment, sensors, andactuators.Onboarding enables the DCH to federate data from a range of disparate building data sources and exploit the valueadd features of the DCH4, such as the Building Services Layer that facilitates discovery and searchability of data, andend-use applications enabled by the DCH.Onboarding the DCH4 buildings involves four stages as shown in Figure 1:1.Registration2. Site BMS to JLLIngestion ThroughJLL Gateways3. JLL to DCHIngestion ThroughSenaps API4. SemanticBuildingModellingFigure 1 DCH4 Onboarding StepsRegistration: The DCH4 registration consists of three steps:1. Create PNSW organisation instance on DCH named “pnsw”.2. Create roles based on the permissions intended for all individuals and organisations involved in the subproject. (read-only access, admin access, delete permission etc.)3. Send out invitations to all parties involved giving them access based on roles created for them.For example, PNSW members involved would be assigned admin access enabling them to create new streams, invitenew users and giving them relevant access and permissions (only for “pnsw” organisation instance), access and editbuilding models. In contrast, JLL individuals would only have permission to create new streams and read theinformation about the data groups in Senaps.At the moment, PNSW Sustainability Manager, JLL’s API Engineer and Buildings Alive API team have access to DCH.Report: DCH4 Data integration, standardisation and energy baseliningThe Innovation Hub for Affordable Heating and Cooling iHub.org.auPage 5
Data Ingestion1.1The table below shows a summary of data and data sources available from the five PNSW sites. Figure 2 illustratesthe data ingestion methods and dataflow for DCH4.Site NameLithgowUtility MetersElectricalSolarGasWaterIoT yCO2 levelsParticulateMatter (PM10and PM2.5)Total VolatileOrganiccompounds(TVOC)BMS DataControlAlgorithmsYesN/ATotal Number ofPoints (Lastupdated 8th ofNov 2021)1810Sydney (included in sityCO2 levelsParticulateMatter (PM10and PM2.5)Total VolatileOrganiccompounds(TVOC)People CountersYesDemand andResponseStrategy Points(PlantPro)1730CootamundraWagga yOccupancyStatusLuminosityCO2 levelsParticulateMatter (PM10and PM2.5)Total ccupancyStatusLuminosityCO2 levelsParticulateMatter (PM10and PM2.5)Total ccupancyStatusLuminosityCO2 levelsParticulateMatter (PM10and PM2.5)Total 5250Report: DCH4 Data integration, standardisation and energy baseliningThe Innovation Hub for Affordable Heating and Cooling iHub.org.auPage 6
Figure 2 Data ingestion breakdown for DCH4Site BMS to JLL Ingestion Through JLL Gateways: The official IoT provider for PNSW, JLL, installed their gateways inthe 5 sites included in this project. Gateways are the standard method for ingesting IoT data to cloud services. TheBMS data available on the BACnet networks on sites was then exported and ingested to JLL’s cloud platformIntellicommand (Command Centre). Additionally, JLL installed LoRa PIR (Passive Infrared) sensors for monitoringoccupancy (motion), temperature, humidity, and light. Each point, location, equipment, and site are then assigned aUnique Identifier (UID) for each data stream.JLL to DCH Ingestion Through Senaps API: Working closely with the JLL software team in the U.S., a bot wasprogrammed on the Intellicommand servers to package the data and metadata for each point and send them to DCHusing the Senaps API. A bot is a software application that runs automated tasks, can adapt and can handle morecomplex operations than a workflow. Communication from DCH to Intellicommand is also possible, but would requiresetting up a workflow on DCH which follows the Intellicommand API specifications. The bot would acquire all JLLspecific data and metadata from Intellicommand and use the publicly available dch-bms JSON epos/bms-json/browse) to send the packets to DCH. The bot acquiresany point on Intellicommand with timeseries data available and automatically sends it to DCH. This means if new pointsare onboarded to JLL, they are automatically onboarded to DCH, and no additional work is required. The reason forchoosing API rather than an IoT protocol like MQTT was to avoid adding unnecessary complexities to the dataflowfrom DCH to site and vice versa. Typically, MQTT is used to transfer data from the physical hardware to the cloud.Once the data is available somewhere on the internet, using MQTT becomes unnecessary. In this context, if we woulduse MQTT to ingest data to Senaps, we would have two MQTT brokers, Intellicommand broker and Senaps broker.This creates two stages of MQTT which introduces unnecessary complexities to the dataflow.Sites in Sydney (Prince Albert) and Lithgow are fully onboarded. Wagga Wagga, Cootamundra and Griffith have beenunder BMS and equipment upgrade and JLL has been unable to onboard their BMS points so far. IoT Sensors and meterdata has been onboarded for all 5 sites.Report: DCH4 Data integration, standardisation and energy baseliningThe Innovation Hub for Affordable Heating and Cooling iHub.org.auPage 7
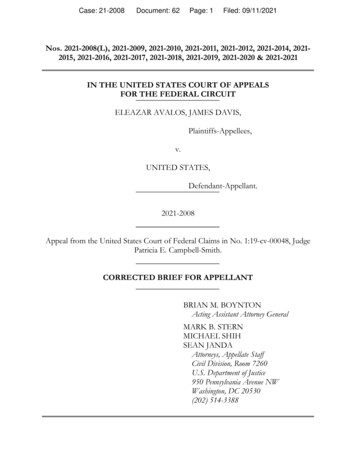
Utility data to DCH:Aside from the data ingested by JLL, authority letters were issued by PNSW to request utility metering data ingestionfrom utility providers. Without exception, all providers ingested their CSV data through unsecured FTP protocol. Intotal, 28 datastreams were onboarded by 3 providers for 10 meters (See appendix A for more info). This data wasalso onboarded by JLL through the BMS points available from these meters. Further letters of authority are requiredto ingest other data from the utility providers.Semantic Model Creation1.2Building semantic data models enable the description of various entities in a building and their relationships in amachine-readable format. 2 out of 5 PNSW building models are complete while the other 3 are under renovation andonly meters and IoT sensors are onboarded on Senaps. Once the BMS points are onboarded to JLL Command Centre,they are automatically ingested to Senaps.Using a combination of tools/templates that simplify the process of converting existing building information as inputsfor a building data model and using an expert to support further building model development and verification. InDCH4, screenshots of the BMS and various technical documents were provided by PNSW and JLL to support thedevelopment of the model.A technical decision made during our collaboration with JLL was to include the Intellicommand UIDs in the stream IDnames. This was to accomplish two goals: Avoid namespace collision in Senaps (duplication of stream IDs) Enable bi-directional communication between DCH and IntellicommandThe example below shows the datastreams’ metadata (Figure 2) and the outputs of the script:Figure 3 Example JLL Metadata FieldsReport: DCH4 Data integration, standardisation and energy baseliningThe Innovation Hub for Affordable Heating and Cooling iHub.org.auPage 8
OUTPUTS:Stream ID: dch.pnsw.point.2889c34a-42c579f4.QS LB2R HW Plant 3 Blr3 Cont StatusSkeleton Instance: Blr3Skeleton Instance Class: BoilerPoint Expression: 2889c34a-42c579f4Description in Point Name: 2889c34a-42c579f4.QS LB2R HW Plant 3 Blr3 Cont StatusBRICK Class: StatusAnother script (written in Python) that generates semantic data models based on the Brick schema was used togenerate the building model. This script uses available building information (e.g. BACnet data points lists, Modbuspower meter data point lists and building layout information) to create semantic data models for each building,including the type of each data point and the relationships between data points, equipment, systems and buildinglocation.The Table below provides a summary of Brick relationships currently available in these models. These models can beeasily visualised using RDF viewers available at the Brick website (https://brickschema.github.io/brick-studio/) oropen-source tools such as Protege (https://protege.stanford.edu/)Site DetailsLithgowSydney (PrinceAlbert)CootamundraWaggaWaggaGriffithNumber of locations in the Brickmodel3063N/AN/AN/ANumber of BMS points, IoT sensorand energy meter points in theBrick model12581425564370495Number of equipment points71162N/AN/AN/ATotal nodes in the Brick model27043159N/AN/AN/AReport: DCH4 Data integration, standardisation and energy baseliningThe Innovation Hub for Affordable Heating and Cooling iHub.org.auPage 9
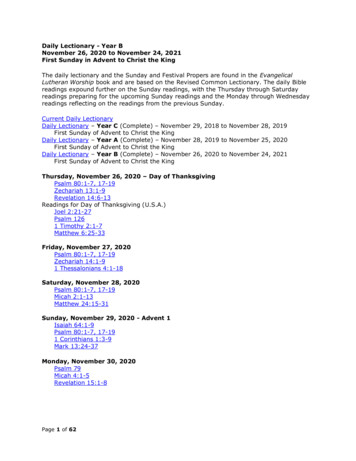
1.3Data and model usageCurrently, two applications are utilising the DCH models and the data: i) Measurement and Verification (M&V)application; ii) Buildings Alive (PNSW service provider) custom external application. These applications query thebuilding model for the necessary input data points using the query functionality available via DCH API (BRIQL orSPARQL). The query results return the DCH stream IDs and the timeseries data is then requested from DCH foranalysis through DCH API.Figure 4 DCH Data Usage FlowFor example, the M&V app queries the Prince Albert building model for Energy consumption point, Active (Real)Power Sensor point, and Outside Air Temperature Sensor point. For further information on the M&V application andthe detailed results, please refer to the “Energy Baselining” document.Buildings Alive application is used to acquire required datastreams from the DCH using the query functionality andalso by looking at the metadata fields for each point.For example, in Figure 3, note the pointName field text contains Status which indicates that it is an On/Off point ORinside tags PointName which ends with STS, which indicates it is a Status point. Figure 4 shows one of the BRIQLqueries used by Buildings Alive to map the motion sensors to the room they are located in.Report: DCH4 Data integration, standardisation and energy baseliningThe Innovation Hub for Affordable Heating and Cooling iHub.org.auPage 10
Figure 5 Metadata extraction for Buildings AliveReport: DCH4 Data integration, standardisation and energy baseliningThe Innovation Hub for Affordable Heating and Cooling iHub.org.auPage 11
Figure 6 BRIQL query to map motion sensors to rooms.Report: DCH4 Data integration, standardisation and energy baseliningThe Innovation Hub for Affordable Heating and Cooling iHub.org.auPage 12
1.4Learnings from the exercise1. As previously mentioned, JLL assigns a UID to each point, equipment, location etc. and to maintain theconsistency between our platforms and to enable bi-directional communications if needed, that UID wasretained in the stream IDs on Senaps. This resulted in the stream IDs being vague during the BRICK modeldevelopment of the buildings. Previously, the model development solely used stream IDs to identify whatequipment that stream belongs to (e.g. AHU, FCU, VAV) and what the point is responsible for (e.g. Return AirTemperature Sensor, VSD Speed, Outside Air Temperature Sensor). In this case, JLL provided an extensivemetadata field in the json-bms schema outlining the equipment and point name to be used by modeldevelopers instead. This meant that model developers required additional time to writea script for analyzing the metadata fields and associate the results with the stream IDs and UIDs.Furthermore, the Prince Albert site required a BMS and Gateway reset to update some missing BACnetpoints. This reset generated new UIDs for existing points which then duplicated the streams on Senaps.Working closely with the JLL team, we swapped the old UIDs in the model with the new UIDs, added thenew points to the model and retained the historic data.When the duplication of points occurred, if the streams were not assigned UIDs, distinguishing between theold and the new streams would have been a difficult task. The UIDs may have added extra time in modeldevelopment timeline, but they proved to be essential in doing damage control.2. Although the preferred method of data ingestion to DCH is through IoT protocols such as MQTT or AMQP,since the data was being onboarded to Intellicommand before DCH, API proved to be the fastest, easiest, andmost reliable method for this project. Having a variety of data ingestion methods is essential inaccommodating the onboarding for all clients. Additionally, since JLL has not disclosed the protocol used foringesting data from their gateways to Intellicommand, if MQTT was used for communication between DCHand Intellicommand, a translator system would be required interpret signals sent from DCH to JLL commandcentre. Evidently, this would be unnecessary and therefore, API was preferred by both JLL and DCH.Report: DCH4 Data integration, standardisation and energy baseliningThe Innovation Hub for Affordable Heating and Cooling iHub.org.auPage 13
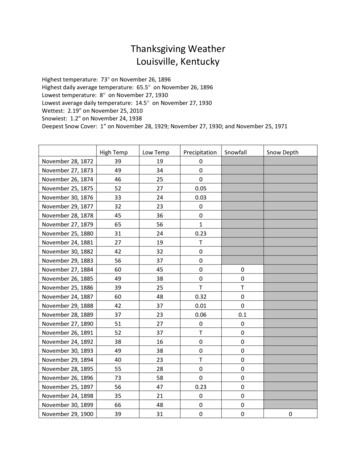
Energy baselining studyHistoric and ongoing data collection from two sites (Prince Albert st, Lithgow) have been used to study the electricalenergy use behaviour of these sites. Only site level energy use data has been used for this study. Further study withmore fine grained data will be carried out during the next milestone period.Details of data streams used for the study :1 Prince Albert St, SydneyDCH Stream: dch.pnsw.point.28c58223d8e05b2c.NCCCZ00638 kW15 minutely electricity demand in kW spanning 1 May2020 to present 61, Railway Pde, LithgowDCH Stream: dch.pnsw.point.28c3e7d78b64e027.4310857063 kW15 minutely electricity demand in kW spanning 1 May2020 to present.KMeans clustering to the data to create representative profiles for the sites. Outlier detection and removalhas been applied, with observations having a pattern frequency of less than 0.3% being set aside for furtherinvestigation.Heatmaps have been created to allow for relative comparison of site energy use on different days.Box plots and bar plots are used to visualise typical site energy use patterns during various seasons and tocapture typical daily variations.An interactive map has been created to support further exploration of the results. However, static plots areprovided here for discussion purposes. Interactive plots can be made available on request. These plots areshown in Figures 7 and 8. A summary of observations from these results are provided below.Prince Albert site : This site has a baseline energy use of about 60 kW. A discussion with the site facility manager indicated the sitehas a dedicated AHU for an archive room in the basement that operates continually. Prince Albert site HVACsystems are started at around 6am and the chiller start at 7am. These two starting times show a blip in theenergy use. Some of the outliers observed in the box plot for these two time periods (6 and 7am) correspond tohot summer days.This site has not been impacted by Covid lockdowns. Hence the energy use of the site is typical of normaloperations. The site manager observed that some of the changes in monthly energy use could be attributed tochange in tenancies.The site uses gas for heating (not captured in this analysis). Days belonging to cluster 2 are primarily from Julyand August months.Report: DCH4 Data integration, standardisation and energy baseliningThe Innovation Hub for Affordable Heating and Cooling iHub.org.auPage 14
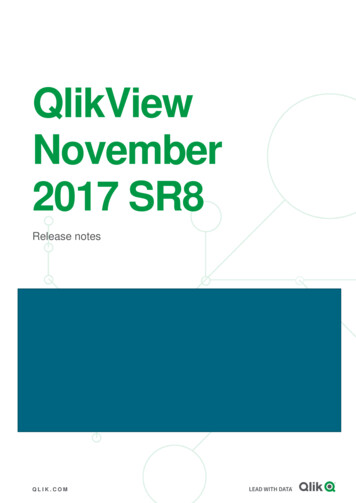
Lithgow site : Lithgow site has onsite solar generation that is influencing the daily demand profiles. It can be observed thatunlike the Prince Albert site, Lithgow does not have a constant, baseload type cluster, but rather threeclusters have a similar shape but different magnitude, with Cluster 3 being 20-40 kW higher than Cluster 1.High demand cluster (cluster 3) represents typical warmer months of November – March and accounts fornearly 74% of days in January and February. Cluster 1, the low demand profile, is more evident in the coolermonths, and occurs infrequently over summer. Cluster 2, the medium profile, occurs on weekends.Figure 7 Energy use patterns for 1 Prince Albert siteReport: DCH4 Data integration, standardisation and energy baseliningThe Innovation Hub for Affordable Heating and Cooling iHub.org.auPage 15
Figure 8 Energy use patterns for Lithgow siteMeasurement and Verification (M&V) for two sites :M&V results are summarised for the two sites in Figures 9 and 10.1 Prince Albert St, SydneyDCH Stream: dch.pnsw.point.28c58223d8e05b2c.NCCCZ00638 kW61, Railway Pde, LithgowDCH Stream: dch.pnsw.point.28c3e7d78b64e027.4310857063 kWAmbient temperature: dch.pnsw.point.28a05f4f8bd97e70.Global OATData period for both data streams: 1-Oct 2020 to 30Sep-2021Baseline period: 10-Oct-2020 to 13-Apr-2021Analysis period: 14-Apr-2021 to 29-Sep-2021Solar generation stream id: dch.pnsw.point.28c3e7d77b0e5292.ZZZZ035367 Solar Energy GeneratedAmbient temperature stream id:dch.pnsw.point.288ad7b6de684f55.DDC5 Chiller O A Temperature Output AI12Baseline period: 22-July-2021 to 22-Sep-2021Analysis period: 23-Sep-2021 to 09-Nov-2021Report: DCH4 Data integration, standardisation and energy baseliningThe Innovation Hub for Affordable Heating and Cooling iHub.org.auPage 16
Figure 9 M&V results summary for Prince Albert siteReport: DCH4 Data integration, standardisation and energy baseliningThe Innovation Hub for Affordable Heating and Cooling iHub.org.auPage 17
Figure 10 M&V results summary for Lithgow siteReport: DCH4 Data integration, standardisation and energy baseliningThe Innovation Hub for Affordable Heating and Cooling iHub.org.auPage 18
Summary of results for Prince Albert site: A good fit of the model to the baseline data was obtained (CVRMSE 17.1, NBME -0.11). Figure 1 indicatesthat there was only 1 day in the baseline period where the mean error was significant.The site has a baseline consumption of approximately 60kW that is largely independent of temperature. Thetypical workday daily pattern has a peak of approximately 150kW in the morning between 7 and 9amfollowed by a relatively steady 120kW consumption throughout the day dropping back to the baselineconsumption level after 6pm.Overall energy use increased by 2.3% ( -2.6%) over the analysis period compared to expected. However, thevariation was not uniform with decreases in April and May followed by increases in June and July and adecrease again in September (Figure 2).The most striking feature is the change in variation of energy use with temperature for periods where thesite is likely to be occupied (Figure 3 left). Over the analysis period the actual energy use was almostindependent of temperature, as compared to the baseline period where the energy use increased uniformlywith increasing temperature.Summary of results for Lithgow site: A very good fit of the model to the baseline data was obtained (CVRMSE 6.9, NBME 0.13). Figure 1indicates that there was only 1 day in the baseline period where the mean error was significant.The site has a varying baseline consumption that changes between approximately 45kW and 65kWdepending on the time of day and temperature. The typical workday pattern increases gradually from about6am to a peak consumption of approximately 85kW in the middle of the day before decreasing again fromapproximately 4pm.Overall energy use decreased by 1.6% ( -1.3%) over the analysis period compared to expected. The variationbetween months was not substantially different (Figure 2).The variation in energy use with time of day over the analysis period was very close to expected (Figure 3right) but with a slight decrease in consumption between 4pm and 6pm during occupied days. The variationin energy use with temperature was also similar for occupied periods. However, for unoccupied periodsthere was a decrease in consumption at times of higher ambient temperature (Figure 3 left).Report: DCH4 Data integration, standardisation and energy baseliningThe Innovation Hub for Affordable Heating and Cooling iHub.org.auPage 19
AppendicesA. Utility Meter Providers (CSV through FTP) PlusES (Electrical and Solar) NMIs:oNDDD00GH59 (Wagga Wagg)oNDDD00GM81 (Cootamundra)oNCCCZ00638 (Sydney Prince Albert)oNDDD00GH58 (Griffith)oZZZZ035406 (Griffith)oZZZZ035367 (Lithgow)o4310857063 (Lithgow)SUMSGroup:o03HB06947 (Lithgow)o17E000154 (Griffith)WaterGroup:o12610004RW (Wagga Wagga)Report: DCH4 Data integration, standardisation and energy baseliningThe Innovation Hub for Affordable Heating and Cooling iHub.org.auPage 20
B. Site Data Breakdown61 RAILWAY PDE LITHGOWBuilding GeneralData NameValueAddress61 Railway Pde, LithgowNSWPostcode2790Building ZonesTenant, Area, TypeCalculated - Total of Building ZonesTotal Floor AreaCalculated - Total ofOccupied Building ZonesTotal Occupied Floor AreaEnergy and Utility SourcesNet Electrical Energy Consumed / ExportedData nameUnitsGrid EnergyConsumedkWhNet Energy ExportedkWhBuilding PowerkWDemandkVANMI / Meter IDData Method4310857063PlusES – FTPCSV4310857063PlusES – FTPCSV4310857063PlusES – FTPCSV4310857063PlusES – FTPCSVNMI / Meter IDData MethodZZZZ03567PlusES – FTPCSVZZZZ03567PlusES – FTPCSVSolar Energy Generated On SiteData nameUnitsSolar Energy GeneratedkWhSolar Power GeneratedkWGas PurchasedData nameGas EnergyConsumedUnitsMJMeter IDData Method52470063518TBA (require letters ofauthority from PNSW)Report: DCH4 Data integration, standardisation and energy baseliningThe Innovation Hub for Affordable Heating and Cooling iHub.org.auPage 21
Water PurchasedData nameUnitsWater ConsumedMeter IDML19HB00832Data MethodFTP / CSV /MQTT (require letters ofauthority from PNSW)Building ZonesZoneDescriptorTenantZone TypeOccupiedStatusFloor AreaNLA (m2)Data MethodLG.01Office of State Revenue– Meeting & TrainingRoomsTenant –MeetingOccupied161API - IOTProviderLG.02Office of State Revenue– Server RoomTenant – OfficeSupportOccupied24API - IOTProviderLG.03Police Force NSWTenant - OfficeOccupied655Tenant - OfficeOccupied1012Tenant - OfficeOccupied1014L1.01L2.01Office of State Revenue– OfficesOffice of State Revenue– OfficesAPI - IOTProviderAPI - IOTProviderAPI - IOTProviderZone Thermal Comfort, Lighting and Occupancy Data1 off point per 250m2 of Tenant-Office area.Data Point NameSpace TemperatureSpace Relative HumidityOccupancy Status (PIR)Light LevelUnitsData MethodDeg CAPI - IOT Provider%RHBooleanLuxAPI - IOT ProviderAPI - IOT ProviderAPI - IOT ProviderFloor Indoor Environment Quality Data1 off data point per occupied floor placed in return air path, total of three sensing points.Data Point NameCO2 (Carbon Dioxide Level)Particulate matter(PM10)UnitsData MethodppmAPI - IOT Providermg/m3API - IOT ProviderReport: DCH4 Data integration, standardisation and energy baseliningThe Innovation Hub for Affordable Heating and Cooling iHub.org.auPage 22
Particulate matter(PM2.5)TVOCmg/m3API - IOT ProviderppbAPI - IOT ProviderBMS D
43-45 Johnston St, Wagga Wagga . 31 104-110 Banna Ave, Griffith . 34 . Report: DCH4 Data integration, standardisation and energy baselining The Innovation Hub for Affordable Heating and Cooling iHub.org.au Page 5 . The Innovation Hub for Affordable Heating and Cooling iHub.org.au Page 8 Utility data to DCH: Aside from the data .