Transcription
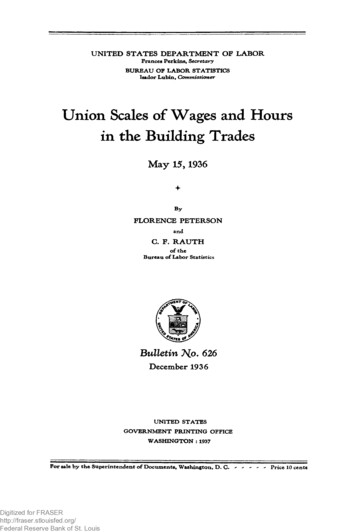
U. S. D E P A R T M E N T O F L A B O R ,BUREAU OF LABOR STATISTICSROYAL ME EK ER, CommissionerBULLETIN OF THE UNITED STATES \BUREAU OF LAB O R S T A T IS T IC S / * * ’WAGESANDHOURSOFLABOR'( W H O L E 1 yl (NUMBER JLt JSE'R IE S :No.UNION SCALE OF WAGESANDDigitized for FRASERhttp://fraser.stlouisfed.org/Federal Reserve Bank of St. LouisHOURSOF LABORMAY 15, 1913MA RCH 4, 1914WASHINGTONG O VE R NM EN T P R I N T I N G OFFICE19147
Digitized for FRASERhttp://fraser.stlouisfed.org/Federal Reserve Bank of St. Louis
CONTENTS.Union scale of wages and hours of labor, May 15, 1913:General summary. .Relative hours of labor per week, relative rates of wages per hour, andrelative earnings on full time, in certain trades, 1907 to 1 9 1 3 . . . . .T able I.— Union scale of wages and hours of labor in each city, bytrades, on May 15, 1912 and 1913. .T able II.— Union scale of wages and hours of labor in each trade, bycities, on May 15, 1912 and 1913. .Digitized for FRASERhttp://fraser.stlouisfed.org/Federal Reserve Bank of St. Louis3page.5-910-1314-7879-150
Digitized for FRASERhttp://fraser.stlouisfed.org/Federal Reserve Bank of St. Louis
BULLETIN OF THEU. S. BUREAU OF LABOR STATISTICS.W H O L E NO. 143.W ASH INGTON.MAR CH 4, 1914.UNION SCALE OF WAGES AND HOURS OF LABOR,MAY 15, 1913.GENERAL SUMMARY.This report shows the union scale of wages and hours of labor pre vailing on May 15, 1913, in the principal mechanical trades in 40important industrial cities in the United States. Union scales in39 cities on May 15 each year from 1907 to 1912, inclusive, for approxi mately the same trades were published in Bulletin No. 131 of thisBureau.The detail figures of this report are published in two general tables,entitled:T a b l e I.— Union scale of wages and hours of labor in each city,by trades, on May 1 5 ,1 9 1 2 and 1913 (pp. 14 to 78).T a b l e II .— Union scale of wages and hours of labor in each trade,by cities, on May 15, 1912 and 1913 (pp. 79 to 150).For comparison, the scale on May 15, 1912, is shown in parallelcolumn with the scale on May 15, 1913.The figures appearing in Table I for each respective city are re peated in Table II, where all of the figures from the several citiesrelating to a trade are brought together.The trades are divided into seven groups, as follows:Bakery trades.Building trades.Granite and stone trades.Metal trades.Millwork.Printing trades, book and job.Printing trades, newspaper.The 40 cities included in this report are important industrialcities located in 32 States. In a general way the city selected ineach section of the country was the city having the largest populationin that section; but, in addition, two smaller cities were included—Fall River, which is a textile center in Massachusetts, and Scranton,which is situated in the anthracite coal region of Pennsylvania.Within these 40 cities live one-fifth of the total population, two-fifthsDigitized for FRASERhttp://fraser.stlouisfed.org/Federal Reserve Bank of St. Louis5
6BULLETIN OF THE BUKEAU OF LABOR STATISTICS.of the urban population, and approximately one-third of the totalnumber engaged in gainful occupations (not including those inagricultural pursuits) m continental United States.The same cities are included in the Bureau’s reports on retailprices.The cities included are as follows:North Atlantic States:Boston, Mass.Buffalo, N. Y.Fall River, Mass.Manchester, N. H.Newark, N. J.New Haven, Conn.New York, N. Y.Philadelphia, Pa.Pittsburgh, Pa,Providence, R. I.Scranton, Pa.South Atlantic States:Atlanta, Ga.Baltimore, Md.Charleston, S. 0.Jacksonville, Fla.Richmond, Ya.Washington, D. C.North Central States:Chicago, 111.Cincinnati, Ohio.Cleveland, Ohio.North Central States—Concluded.Detroit, Mich.Indianapolis, Ind.Kansas City, Mo.Milwaukee, Wis.Minneapolis, Minn.Omaha, Nebr.St. Louis, Mo.St. Paul, Minn.South Central States:Birmingham, Ala.Dallas, Tex.Little Rock, Ark,Louisville, Ky.Memphis, Tenn.New Orleans, La.Western States:Denver, Colo.Los Angeles, Cal.Portland, Oreg.Salt Lake City, Utah.San Francisco, Cal.Seattle, Wash.The union scale, as the term is here used, is a definite statement ofwages and hours of labor agreed to by an employer and an organiza tion of union men and under which union men actually are working.The union scale fixes the limit in only one direction. It establishesa minimum wage below which a member of the union will notwork and a maximum of hours beyond which he will not work atthe regular rate of pay. This report shows such minimum wagesand maximum hours as are established in the scale. In certain citiesand trades, however, workmen are paid more than the union scale,and in some instances employees work regularly less than the scaleof hours. This report does not include information concerning theextent to which workmen are paid more than the scale or work fewerhours than the scale, owing to the great amount of work that wouldbe required to collect such information.The trades for which the union scale is given in this Bulletin areshown in the following table. This table gives, for each trade, per centages indicating the change in rates of wages in a full week in1913 as compared with rates of wages in a full week in each pre ceding year back to 1907 in all cities covered, taken collectively.The year 1907 was the first for which the Bureau collected figuresconcerning the union scales of the country. This table is computedfrom the relative weekly rates of wages on full time appearing inthe table on page 10. As an illustration, the table shows that theDigitized for FRASERhttp://fraser.stlouisfed.org/Federal Reserve Bank of St. Louis
7U N IO N SCALE OF WAGES AND HOURS OF LAB OR M A Y 15, 1913.rates of wages of bakers (first hands) in a full week in 1913 were 3.1per cent higher than the rates of wages in a full week in 1907, 4.2per cent higher than the rates of wages of a full week in 1908, etc.W ith the exception of one trade, the union scales in the tradescovered were higher in 1913 than in 1912, and in many of thetrades a marked advance is shown in 1913 over the earlier years ofthe period.PE R CENT OF INCREASE IN RATES OF WAGES PE R W EE K ON FULL TIME, 1913, COM PA RE D W ITH EACH OF THE SIX Y EA R S PRECEDING.Per cent higher in 1913 than in—Occupations.1907Bakery trades.Bakers, first hands. .Bakers, second hands.Bakers, third hands. . .Building trades.Bricklayers.Bricklayers, sewer and caisson.Building laborers. .Carpenters. . .Cement workers, finishers. .Cement workers* helpers. . .Cement workers’ laborers. .Hod carriers.Inside wiremen. .Inside wiremen’s helpers.Inside wiremen, fixture hangers.Lathers.Marble setters.Painters.Painters, fresco.Plasterers.Plasterers’ laborers. .Plumbers and gas fitters.Sheet-metal workers.Steam fitters.Steam fitters’ helpers. . .Stonemasons. .Structural iron workers. .Structural iron workers, finishers.Structural iron workers, finishers’ helpers.Tile layers. .Tile layers’ helpers.Granite and stone trades.Granite cutters.Stonecutters. .Metal trades.Blacksmiths. .Blacksmiths’ helpers. .Boiler makers.Boiler makers’ helpers.Core makers.Foundry laborers.Machinists.Holders, iron.Pattern makers, wood.Millworlc.Carpenters.Painters, hardwood .64.21.31.02.93.13.6S. 3.6PC1)0)0)0)(0(0 8Printing trades, book and job.Bookbinders.Compositors.Electrotypers:Battery men and builders.Finishers. . .Holders. . .Digitized for FRASERhttp://fraser.stlouisfed.org/Federal Reserve Bank of St. Louis1No data.2 No change.
8BULLETIN OF THE BUREAU OF LABOR STATISTICS.PER CENT OF INCREASE IN R A TE S OF WAGES PER W EE K ON FULL TIME, 1913, COM PARED W ITH EACH OF THE SIX Y E A R S PRECEDING—Concluded.Per cent higher in 1913 than in—190719081909191019111912Printing trades, book and job—Concluded.Linotype operators.Machine tenders.Press feeders.Pressmen, cylinder presses.Pressmen, platen presses.9.6 3.22.82.11.61.81.31.5.61.92.05.75.8Printing trades, newspaper.Compositors, daywork.Compositors, nightwork.Linotype operators, daywork.Linotype operators, nightwork.Machine tenders, daywork.Machine tenders, nightwork.Pressmen, web presses, daywork.Pressmen, web presses, nightwork.Stereotypers, daywork.Stereotypers, nightwork.89.97.69.59.20)4.13.57.47.4The union scales presented in this report are the time-rate scalesonly, except in the trades of compositors and linotype operators, forwhich the piece rates per 1,000 ems are shown in addition to time rates.The unit 1,000 ems is a standard unit and universally understood. Ithas not yet been feasible for the Bureau to enlarge the work and col lect piece-rate scales in other trades. In localities where piece ratesprevail almost exclusively and the time rate is provided for in thescale but is only infrequently used, such time rate has not been tabu lated. The time scales state wages for different units of time: Undersome scales the rate of wages are by the hour, others by the day, andothers by the week. To make comparison easy the varying rateshave been reduced to an hourly rate.When, for a period of more than three months of a year, thenumber of hours differed from those shown for May 15, the differencehas been noted in the tables.The information published was obtained by special agents of theBureau in personal visits to business agents and secretaries of therespective unions in the several cities.Wage scales, written agreements, and trade-union records wereconsulted wherever available.For all of the trades covered, a table of relative numbers has beencomputed covering all of the years back to 1907 for which the Bureauhas figures. In this table the wages per hour, the regular workinghours per week, and the rates of wages per week on full time in 1913were taken as the basis or 100, and the differences in each precedingyear were indicated by percentages. Thus, in the table below, theregular full-time hours per week of bakers (first hand) in 1907 wereDigitized for FRASERhttp://fraser.stlouisfed.org/Federal Reserve Bank of St. Louis
U N IO N SCALE OF WAGES AND HOURS OF LABOR, M AY 15, 1913.9123 per cent of what they were in 1913. In this same occupation therate of wages per hour on May 15, 1907, were 78.9 per cent of whatthey were on May 15, 1913.The increase in rates of wages per hour were nearly counterbal anced by the reduction of working hours per week, so that while thetime required to make a week’s earnings was reduced the income perweek would be but slightly increased. The relative rates of wagesper full week in 1907 fof this occupation were 97 per cent of the ratesof wages per full week in 1913. The per cent of change in full-timerates of wages per week in which 1913 is compared with each pre ceding year is shown in the table on pages 7 and 8.The rates of wages per week, full time, means the rates for a weekwhen no time is lost and no overtime worked.The relative rates of wages per week, full time, were obtained bymultiplying the relative rate of wages per hour by the relative hoursof labor per week. This method was employed only to save time inthe publication of the report. The relatives thus computed willvary but slightly from relatives based on averages of the actual ratesper full week.In computing the relative hours of labor per week and the relativerates of wages per hour the figures for each city were given an im portance (weighted) according to the approximate total membershipof the union in the city.In Bulletin No. 131 a table was given of relative hours of labor andrelative rates of wages per hour, in. which the figures for 1907 weretaken as the base (100). In the present Bulletin, as stated, thefigures for 1913 have been taken as the base (100) and the figuresfor the preceding year recomputed to correspond.A study of the relative numbers shows a general tendency in alltrades toward a reduction of hours of labor and an increase in thescale of wages.Digitized for FRASERhttp://fraser.stlouisfed.org/Federal Reserve Bank of St. Louis
10RELOF TH E BUREAU OF LABOR STATISTICS.FRS OF LABOR PER W EE K , R E LA TIV E RATES OF WAGES PER HOUR,R E LATIVE RATES PER W E E K ON FULL TIME, 1907 TO 1913.Bakery trades.Building trades.Bakers, first hands. Bakers, second hands. Bakers, third hands.Rela tivenomi nalfull 3.123.0117.7113.5109.0104.6101.2100.0Rela Rela tivetiveRela ratenomi tiveofnalrate of wages full wages pertimeperhourshour. week,perfulltime. la tiveRela ratetiveofrate ofwages perperhour. 287.791.294.597.0100.0Bricklayers.Rela Rela Rela Rela tivetive Rela tivetivenomi Rela nomi rateratetivetivenalofnaloffull rate offull rate ofpertimetimeperperp er. week,hours hour. week, hours hour.perperfullfullweek.time. ding trades—Continued.Bricklayers, sewerand 0.099.0100.099.0100.0Building 3100.0Cement .198.1100.0Building trades—Continued.Cement .098.998.9100.085.787.091.393.198.998.9100.0Cement 5.896.2100.0Hod .0Inside 0Building trades—Continued.Inside wiremen’ 02.5102.5101.2100.8100.2100.0Digitized for FRASERhttp://fraser.stlouisfed.org/Federal Reserve Bank of St. Louis88.891.592.597. 798.399.2100.091.493.894.898. 999.199.4100.0Inside wiremen,fixture 00.097.6100.0Marble setters.97.6100.0101.5101.5100.6100. 1.591.192.593.393.8100.0
U N IO N SCALE OF WAGES AND HOURS OF LABOR, M A Y 15, 1913.11RELATIVE HOURS OF LABOR PER W EE K , R E LA TIV E RATES OF WAGES PER HOUR,AND R E LA TIV E RATES PER W E E K ON FULL TIME, 1907 TO 1913—Continued.Building trades—Continued.Painters, .Rela tivenomi nalfull timehoursperweek.Rela Rela tivetiveRela ratenomi Rela tivetivenalofofrate of wagesfull ratewageswages pertimeper week, hoursperhour.hour.perfulltime. 0.3100.098.4100.0Plasterers.Rela tiverateofwagesperweek,fulltime.Rela tivenomi nalfull 2100.0100.0Plasterers’ laborers.Rela Rela tivetiveRela ratenomi Rela tivetivenalofrate of wagesfull rate ofwages perwagestimeperperhours hour.hour. week,perfulltime. .894.395.496.096.197.2100.0Rela .597.2100.0Building trades—Continued.Plumbers and 896.6100.089.290.291.692.997.697.0100.0Sheet-metal 0Steam 0Steam fitters’ 0Building trades—Continued.Stonemasons.1907.1908 .1909 5.996.6100.0Structural iron 0Structural iron workers, finishers.100.0100.0Building trades—Concluded.Tile layers.1907.1908.1909.1910.1911.1912. 100.41913. 100.0Digitized for FRASERhttp://fraser.stlouisfed.org/Federal Reserve Bank of St. 098. i100.098.4100.0Granite and stone trades.Tile layers’ helpers.100.4100.097.9100.0Structural iron workers, finishers,helpers.98.2100.0Granite .8100.0
12BULLETIN OF THE BUREAU OF LABOR STATISTICS.RE LA TIV E HOURS OF LABOR PER W EE K , R E LA TIV E RATES OF WAGES PER HOUR,AND RELATIVE RATES PER W E E K ON FULL TIME, 1907 TO 1913—Continued.Metal trades.Blacksmiths’helpers.Blacksmiths.Year.Rela tivenomi nalfull 3.102.9102.9101.5101.3100.7100.7100.0Rela Rela tivetiveRela ratenomi tiveofnalrate of wagesfull wages pertimeper week, hourshour.fullpertime. week.87.988.790.794.094.596.9100.0103 297.6100.0Rela Rela tive Rela Relar tive nomi ratetivetivenalofrate offull rate ofwages wageswagestimeperperperhours hour.hour. week,perfulltime. week.82.785.988.495.095.896.3100.0Boiler makers’helpers.Boiler Rela tiverateofwagesperweek,fulltime.Rela tivenomi nalfull timehoursperweek.Rela tiveRela ratetiveofrate of wageswages perper week,hour. fulltime.87.188.088. .398.8100.0Metal trades—Continued.Core 7.0100.0Metal trades—Concluded.103.4103.1102.8101.6100. 0.0Painters, hardwoodfinishers.100.0100.0Molders, inting trades:B ook and job .Millwork.Pattern sts.Foundry 0.093.894.394.495.096.897.4100.0Printing trades: B ook and jo b ized for FRASERhttp://fraser.stlouisfed.org/Federal Reserve Bank of St. 95.397.4100.0Electrotypers, bat tery men 8.6100.092.392.593.294.997.998.7100.0
13U N IO N SCALE OF WAGES AND HOURS OF LABOR, M A Y 15, 1913.R E LA T IV E HOURS OF LABOR PER W E E K , R E LATIVE RATES OF WAGES PER HOUR,AND R E LA T IV E R ATES PER W E E K ON FULL TIME, 1907 TO 1913—Concluded.Printing trades: Book and job—Continued.Linotype operators.Year.1907.1908 .1909.1910.1911.1912.1913.Rela tivenomi nalfull .0Machine tenders.Rela Rela tivetiveRela ratenomi tivenalofrate of wages full wages pertimeperhourshour. week,fullpertime. week.91.091.191.393.494.597. nist operators.Rela Rela tivetiveRela ratenomi tivenalofrate of wages full wages pertimeperhourshour. week,perfulltime. 0Pressmen, 5.088.192.894.696.397.6100.0Rela RelartivetiveRela ratenomi tivenalofrate of wages full wages pertimeperhourshour. week,perfulltime. .094.696.397.6100.0Rela Rela tiveratetiveofrate of wageswages perper week,hour. 92.195.997.4100.0Printing trades: Newspaper.Printing trades: Book and job—Concld.Pressmen, cylinderpresses.Press feeders.Compositors, daywork.100. , 0.0Printing trades: 2.1913.Linotype operators,dlaywork.Linotype 7100.0Machine e ting trades: Newspaper—Concluded.Pressmen, webpresses, 0.6100.2100.2100.2100.0100.0Digitized for FRASERhttp://fraser.stlouisfed.org/Federal Reserve Bank of St. 96.198.1100.0Pressmen, webpresses, 0.0Stereotypers, Stereotypers, 0.0
14T ableBULLETIN OF THE BUREAU OF LABOR STATISTICS.I .—UNION SCALE OF WAGES AND HOURS OF LABOR IN EACHCITY, BY TRADES, ON MAY 15, 1912 AND 1913.ATLANTA, GA.May 15,1912.Trade.May 15, 1913.Hours oflabor perweek.Rate ofwages perhour.5354 6250.2500.3393.4500.452849 49*54544848535353. 7250.4500. 484848.3396.4000.3800.3600.3500.4528.2264.4500. 3750. 48.3125.3750Hours oflabor perweek.Rate ofwages perhour.Building trades.Carpenters.Engineers, hoisting and portable:Boom derrick.Hoist.Tn.sido wiremp.n. . . . . . .Tnsidft wirpm fin's hplpprs.Mftrhi a mi tlp.rs find ppsttfirs. .,.Marble cutters and setters7helpers.Painters.Plasterers.Plumbers and gas fitters.Sheet-metal workers:Manufacturing shops.Railroad shops, road C .Railroad shops, road E .Railroad shops, roar! "R rRailroad shops, road A .Steam fitters.Steam fitters' helpers.Stonemasons.Structural ironworkers.Structural ironworkers, finishers.Structural ironworkers, finishers’ helpers.Granite and stone trades.Granite cutters:Inside men.Machine men.Ou tside m en.Stonecutters.
Los Angeles, Cal. Portland, Oreg. Salt Lake City, Utah. San Francisco, Cal. Seattle, Wash. The union scale, as the term is here used, is a definite statement of wages and hours of labor agreed to by an employer and an organiza tion of union men and under which union men actually are working. The union scale fixes the limit in only one direction.

