Transcription
UNITED STATES DEPARTMENT OF LABORF rances P e rk in s, SecretaryB U R E A U O F L A B O R S T A T IS T IC SIsador L u b in , CommissionerU n io n Scales o f W a g e s and H ou rsin the B u ild in g TradesM a y 15,1936ByFLORENCE PETERSONandC.F. RAUTHo f th eB u rea u o f L a b or StatisticsBulletin 7\ o. 626December 1936U N IT E D S T A T E SG O V E R N M E N T P R I N T I N G OF F IC EW A S H I N G T O N : 1937F or sale b y t h e S u p e rin te n d e n t o f D o c u m e n ts, W ash in g ton , D . C .Digitized for FRASERhttp://fraser.stlouisfed.org/Federal Reserve Bank of St. Louis-P rice 10 cen ts
Digitized for FRASERhttp://fraser.stlouisfed.org/Federal Reserve Bank of St. Louis
CONTENTSPageSummaryScope and method of the studyTrend of wage rates and hours, 1907-36, all trades combinedChanges between 1935 and 1936Wage rates and hours in 1936:Average union wage rates and hoursDistribution of members by wage rates and hoursProvisions in union agreements:Hours per day and days per weekOvertime pay and restrictions on overtimeSundays and holidaysExtra pay for special contingenciesDisabled and older workersOut-of-town contractorsOut-of-town jobsSharing of workApprenticesTemporary workersOther provisionsTrend of wage rates and hours 1907-36, by tradesRates and hours for each trade in each city, 1935 and 1936Digitized for FRASERhttp://fraser.stlouisfed.org/Federal Reserve Bank of St. Louishi12568914141616171818191920212225
Digitized for FRASERhttp://fraser.stlouisfed.org/Federal Reserve Bank of St. Louis
PREFACEThe Bureau of Labor Statistics has made surveys of union wagerates in a number of time-work trades each year since 1907. Theseannual reports not only serve as a reference for current rates amongthe various trades and cities studied, but show the trend in unionrates of wages and hours throughout the period. Previously thereports on all these trades have been incorporated in one generalbulletin. The Bureau is issuing separate reports on the 1936 surveys,this bulletin on the building trades being the first.The wages and hours prevailing in the building trades are of con siderable importance in our national economy. This is due not onlyto the large number of workers directly engaged in the building trades,but also to the influence these rates have on wages in other trades.Because of the prevalence of trade-union negotiations in the buildingtrades, union rates are an important indicator of wage and hourtrends.I sador L u b in ,Commissioner of Labor Statistics.J a n u a r y 14, 1937.Digitized for FRASERhttp://fraser.stlouisfed.org/Federal Reserve Bank of St. Louis
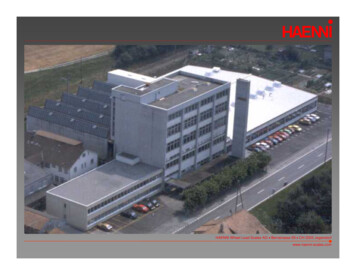
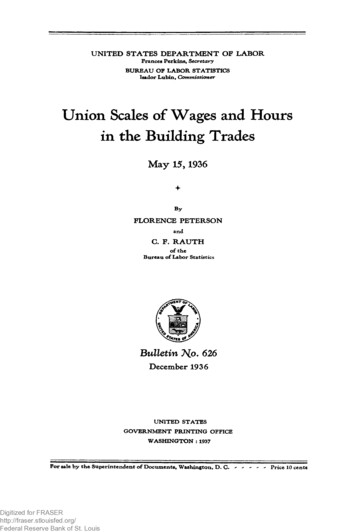
UNION WAGE RATES AND HOURS IN BUILDING TRADESIndexNumbersDigitized for FRASERhttp://fraser.stlouisfed.org/Federal Reserve Bank of St. Louis1929 100IndexNumbers
Bulletin ?{o. 626 of theUnited States Bureau of Labor StatisticsU nion Scales o f W ages and H ours in the BuildingTrades, M ay 15, 1936Sum m aryThe 1936 index of union hourly wage rates for the building tradeswas 5 % percent higher than in 1933, at which time it was the lowestsince 1924. During the last 3 years, the index of union hours decreasedabout 4% percent. The index of union wage rates in effect on M a y 15,1936, in the 70 cities covered in the study, was 91.6, based on the1929 rates as 100. The index of union hours was 89.8. The averagerate of wages in 1936 was 1,223 per hour; the average number ofhours provided for in the union agreements was 38.7 per week.Based on their respective levels in 1929, the average rate of thehelpers and laborers was comparatively higher in 1936 than that ofthe journeymen, the index for the former being 93.4 and for thelatter 91.4. The upward movement in average wage rates for helpersand laborers during the last 3 years is even greater than the 1929-36comparison indicates, as the index for this group dropped to 85.2 in1933 as compared to 86.9 for journeymen.The 1936 average rate for journeymen was 1,294 per hour andthat for helpers and laborers was 0,833. Helpers’ and laborers’scales of hours averaged about 1 hour a week more than those forjourneymen— 39.6 as compared with 38.5.Three percent of thejourneymen covered in the 1936 survey had wage rates of less than 1 an hour, while about 31 percent had rates of 1.50 or over. About2 percent of the helpers and laborers had rates under 0.50 an hourand 16 percent had rates of 1 or over.Alm ost 30 percent of all the building-trades members covered inboth years’ studies had wage increases between 1935 and 1936, whileless than 1 percent suffered decreases. There were relatively fewchanges in the scales of hours per week between 1935 and 1936,Digitized for FRASERhttp://fraser.stlouisfed.org/Federal Reserve Bank of St. Louis1
2UNION SCALES IN BUILDING TRADESabout 2 percent of the entire membership being affected by increasesand about the same proportion by decreases.Scope and Method of the StudyUnion scales of wages and hours in the building trades have beencollected by the Bureau of Labor Statistics each year since 1907.Tbe early studies included 39 cities. The coverage was graduallyextended until, in the period from 1934 to date, 70 cities were includedin the annual survey. These cities, located in 38 States and the D is trict of Columbia, are:A la b a m a : B ir m in g h a m .M o n t a n a : B u tt e .A r k a n sa s: L it t le R o c k .C a lifo r n ia : L o s A n g e le s, S a n F r a n c is c o .N eb ra sk a: O m aha.C o lo ra d o : D e n v e r.N ew Jersey: N ew ark .C o n n e c t ic u t : N e w H a v e n .N e w Y o r k : B u ffa lo , N e wR o c h e s te r .D is t r i c t o f C o lu m b ia .N e w H a m p s h ir e : M a n c h e s t e r .Y orkC it y ,F lo r id a : J a c k s o n v ille .N o r t h C a r o lin a : C h a r lo t te .G e o r g ia : A t la n ta .O h io :C in c in n a ti, C le v e la n d , C o lu m b u s, D a y t o n , T o le d o , Y o u n g s t o w n .I llin o is :C h ic a g o , M o lin e , P e o r ia , R o c kI s la n d .I n d ia n a : I n d ia n a p o lis , S o u th B e n d .I o w a : D a v e n p o r t , D e s M o in e s .K a n s a s : W ic h it a .K e n t u c k y : L o u is v ille .L o u is ia n a : N e w O rlea n s.M a in e : P o r tla n d .M a r y la n d : B a ltim o r e .M a s s a c h u s e tts :B o sto n ,S p rin g fie ld ,W o r c e s te r .M ic h ig a n : D e t r o it , G r a n d R a p id s .M in n e s o ta :D u lu t h , M in n e a p o lis , S t.P a u l.M is s o u r i: K a n s a s C i t y , S t. L o u is.O k la h o m a : O k la h o m a C it y .O r e g o n : P o r t la n d .P e n n s y lv a n ia : E r ie , P h ila d e lp h ia , P it t s b u r g h , R e a d in g , S c r a n to n , Y o r k .R h o d e I s la n d : P r o v id e n c e .S o u th C a r o lin a : C h a r le s to n .T e n n e s s e e : M e m p h is , N a s h v ille .T e x a s : D a lla s , E l P a s o , H o u s t o n , S anA n t o n io .U t a h : S a lt L a k e C it y .V ir g in ia : N o r fo lk , R ic h m o n d .W a s h in g t o n : S e a ttle , S p o k a n e .W e s t V ir g in ia : C h a r le s to n .W is c o n s in : M a d is o n , M ilw a u k e e .A s far as possible, the rates collected were those actually in forceon M a y 15. Interviews were held with 1,265 union representativesand over 2,000 quotations of rates were received. The union m em bership covered by these scales of wages and hours in these 70 citieswas approximately 342,000.Definitions.— A union scale is a scale of wages and hours agreed toby an employer (or group of employers) and a labor organization forpersons who are actually working or would be working if there werework to be done in that locality. A union scale usually fixes a limitin one direction, that is, a minimum wage rate and maximum hours ofwork with specific provisions for overtime.The union m ay (1) be either an independent local union or oneaffiliated with a national or international federation, (2) be an organi-Digitized for FRASERhttp://fraser.stlouisfed.org/Federal Reserve Bank of St. Louis
SCOPE AND METHOD OF THE STUDY3zation embracing one craft or more than one craft, or (3) have acontract with only one employer or more than one employer.A collective agreement is a mutual arrangement between a unionand employer (or group of employers) regarding wages and hoursand other working conditions. Collective agreements are usuallywritten and signed by both parties. Sometimes, however, there ismerely an oral agreement. The Bureau has included scales in oralagreements only in those cases where there was clear evidence that therates were actually in effect.Apprentices and foremen.— A young person working in the trade fora definite number of years, for the purpose of learning the trade,and receiving instruction as an element of compensation, is consideredan apprentice. Scales for apprentices are not shown. Scales forhelpers in a number of trades are given. In some trades the work ofhelpers is performed at least in part by apprentices. Whenever itwas found that helpers’ work was done largely by apprentices, therates for such helpers were omitted.N o rates are given for strictly supervising foremen or for individualswho are paid unusual rates because of some personal qualification asdistinct from the usual trade qualifications.Union rates and actual rates.— As mentioned above, the rates ofwages and hours shown in this report were obtained from union busi ness agents, secretaries, and other officials of local unions in the 70cities visited. Over 60 percent of the rates were taken from writtenagreements. In m any cases, however, there is only an oral agreementbetween the union and the employer. Where no written records wereon file in the union office, the Bureau representative listed the rateson a schedule which the union official then signed. If the Bureaurepresentative had any reason to doubt the accuracy of these rates,he made further inquiry from persons who might be informed aboutthe situation. I t is believed that the rates listed in this reportaccurately represent the union scales in force on M a y 15.I t does not necessarily follow, however, that these rates are in allcases the actual wages paid or hours worked. The union scaleusually fixes the minimum wages and maximum hours. M ore ex perienced and skilled workers m ay earn more than the union rate.This is especially true during periods of prosperity, when a plentifulsupply of jobs creates competitive bidding for the better workmen.In periods of depression, in order to spread or share available work,actual hours worked are sometimes less than those provided in theunion agreement. Where such a share-the-work policy was formallyadopted by the union and in effect for the majority of the members,the adjusted scale of hours is used in this report rather than thetheoretical scale appearing in the written agreement.111387 —37----- 2Digitized for FRASERhttp://fraser.stlouisfed.org/Federal Reserve Bank of St. Louis
4UNION SCALES IN BUILDING TKADESUnion rates and prevailing rates.— I t should be remembered that therates quoted are for union members and for jobs worked on a unioncontract basis. Union strength varies in the different cities andtrades. Where practically all the workers of a particular trade belongto the local union, the union rate quoted is equivalent to the prevail ing rate in the community. If only a few of the craftsmen belong tothe union, the union rate m ay not be the actual prevailing rate. N oattempt has been made in this study to discover what proportionsof all the workers in each occupation, in each city, are members oftheir respective unions.Averages.— The averages for each trade given in this report areweighted according to the number of members in the various localunions. Thus the averages reflect not only the specific rates providedfor in union agreements but also the number of persons presumablybenefiting from these rates.Index numbers.— Index numbers shown in former reports on unionscales of wages and hours, were obtained by dividing the average ratesfor each year by the averages for the base year and multiplying by 100.The averages used in each case were weighted according to the numberof members for that year in each local union covered by the reportedrates.These weights therefore changed from year to year withchanges in membership. Such an index, in which the changing unionmembership is an important factor, is somewhat misleading. Thus,for instance, if the membership of high-rate unions increases or themembership of low-rate unions decreases, the index will rise even ifthere is no change in the wage or hour rates of the individual unions.In order to eliminate the influence of such changes in membership,which obscure the real changes in rates of wages and hours, a differentmethod has been used in this revised index. In the present seriesof index numbers (with the exception noted below), the percent ofchange from year to year is based on averages computed from identi cal unions that reported for both years. The membership weightsin both of the averages used in each year-to-year comparison arethose reported for the second year. The index for each year iscomputed by multiplying the index for the preceding year by theratio of the averages so obtained.The index numbers for the years 1907 to 1921 had been computedby this method and those published for years since 1929 have beenrecomputed. It was impossible to make the revision for the period1921 to 1929 because necessary data were not available in the Bureau’sfiles. Since the* union-membership changes during these years wererelatively slight, it is believed that the margin of error due to lackof revision of these index numbers is not serious.Digitized for FRASERhttp://fraser.stlouisfed.org/Federal Reserve Bank of St. Louis
T rend o f U n ion Wage R ates, and H ours, 1907-36The index of union wage rates in the building trades steadilyadvanced from 1907 to 1931 with one exception— the year 1922.From 1907 through 1917, the index rose almost uniformly by one totwo points each year. W ith rising prices attendant upon our entryinto the W orld W ar, the index of wage rates increased almost 11percent between 1917 and 1918, almost 15 percent in 1919, and 35percent in 1920. The post-war depression led to a drop of about6 percent in 1922, but the following year the index rose more than10 percent. From 1923 the index steadily advanced, until 1931 whenthe peak was reached— an index of 104.5 based on 1929 as 100. Thewage rates declined during the next 2 years, dropping to an index of86.8 in 1933. Since then there has been a steady rise, reaching anindex of 91.6 in 1936.The hours per week provided for in union agreements have steadilydecreased since 1907. The rate of decline has been much greater duringrecent years. The index of hour scales decreased 9 percent during the22-year period 1907 to 1929, but declined over 10 percent during the 7year period from 1929 to 1936.T able1.—I n d e x e s o f u n i o n s ca les o f h o u r ly w a g e ra tes a n d w e e k l y h o u r s i n theb u il d i n g tr a d e s , 1 9 0 7 to 1 9 3 6Index numbers (1929 100.0)YearAll Helpers .334.5113.1110.8108.5106.6106.41912.19131914. .1915.1916. . . 6.236.537.7106.1106.1105.5105.4105.11917. . . . . .1918. . .1919.19201921. 5.580.581.3104.7104.3103.3102.7102.71922. . .1923. . . .1924.19251926. . . . . 4.987.795.6102.4102.6102.6102.4102.21927. . . .1928. .1929-. .1930. . . . .1931— . 998.7100.0104. .5102.2102.1100.097.897.01932.1933. . .1934.1935. . .1936. . . 494.894.491.490.891.0Digitized for FRASERhttp://fraser.stlouisfed.org/Federal Reserve Bank of St. Louis-5
Changes in U n ion Scales B etw een 1935 and 1936There was a decided upward movement in union wage rates between1935 and 1936. Alm ost 30 percent of all the building-trades memberscovered in both years' studies had wage increases between 1935and 1936, while less than 1 percent had decreases. The journeymantrades in which large proportions of members were affected by wagerate increases were: Asbestos workers, with 38 percent of the unionmembers receiving increases; carpenters, with 36 percent; painters,with 40 percent; and steam and sprinkler fitters, with 37 percent.Composition roofers had more members (7.1 percent) receivingdecreased rates than any other skilled trade. These decreases seemedto be from rates of a dollar an hour to rates of less than a dollar, sincethe proportion in the higher-wage brackets remained about the sameduring the 2 years.A greater proportion of helpers and laborers (42.4 percent) than ofjourneymen (27.6 percent) received wage-rate increases.Table 2shows the number of wage quotations, the number of changes, and thepercent of union membership having increases, decreases, or nochange in rate.T able 2.—N u m b e r o f c h a n g es i n u n i o n w a g e -r a te q u o t a ti o n s , a n d p e r c e n t o f m e m b e r sa ffe c ted , M a y 1 6 , 1 9 8 6 , a s c o m p a r e d w ith M a y 1 5 , 1 9 8 5TradeN um ber ofquota tionscom parablewith1935Number of quotationsshowing—Percent of union mem bers affected—In creaseD e creaseNochangeIn creaseD e creaseNochangeAll building os workers. . .Bricklayers. . .Carpenters. .Cement finishers. . .Electricians, inside wiremenElevator constructors-------------- ----------------Engineers, portable and hoisting.Glaziers. .Granite cutters. .Lathers.Marble setters. .Mosaic and terrazzo workersPainters. .Plasterers. .Plumbers and gas fitters.Hoofers, composition.Hoofers, slate and tile.Sheet-metal workers. .Sign painters. . . .Steam and sprinkler fitters.Stonecutters. .Stonemasons.Structural-iron w orkers.Tile layers. .1, .561.798.590.078.382.5Helpers and laborers.Building laborers.Composition roofers’ helpers.Elevator constructors’ helpers.Hod carriers (masons’ tenders).Marble setters’ helpers.Plasterers’ laborers.Plumbers* laborers.8 team and sprinkler fitters’ helpers.Tile layers* Digitized for FRASERhttp://fraser.stlouisfed.org/Federal Reserve Bank of St. Louis0.1.91.59.60.4.885.6
CHANGES IN UNION SCALES BETWEEN 1935 AND 19367Table 3 indicates that there were relatively few changes in thescales of hours per week between 1935 and 1936. About the sameproportion of the entire membership (around 2 percent) was affectedby increases and by decreases. The trades m ost affected by increasesin scheduled hours were engineers, elevator constructors and theirhelpers, composition roofers, and building laborers.Trades mostaffected by decreases in hours were lathers, mosaic and terrazzoworkers, plasterers, and plasterers’ helpers.T able3 . — N u m b e r o f c h a n g e s i n u n i o n h o u r q u o t a ti o n s , a n d p e r c e n t o f m e m b e r sa ffe c te d , M a y 1 5 , 1 9 8 6 , a s c o m p a r e d w ith M a y 15% 1 9 3 5TradeNumber of quotationsN um showing—ber ofquotationscompar In D e Noablewithcrease crease change1935Percent of union mem bers affectedIn creaseD e creaseNochangeAll building trades.1,92292811,7492.62.095.4Journeymen. .Asbestos workers.Bricklayers.Carpenters. —.Cement finishers.Electricians, inside w irem en .Elevator constructors.Engineers, portable and hoisting.Glaziers.Granite cutters. .Lathers.Marble setters. .Mosaic and terrazzo workers.P a in ters. .Plasterers.Plumbers and gas fitters.Roofers, composition.Roofers, slate and tile.Sheet-metal workers.Sign painters.Steam and sprinkler fitters.Stonecutters.Stonemasons.Structural-iron workers .Tile layers. . ers and laborers.Building laborers. .Composition roofers’ helpers.Elevator constructors' helpers.Hod carriers (masons’ ten d ers).Marble setters’ helpers.Plasterers’ laborers.Plumbers' laborers.Steam and sprinkler fitters’ helpersTile layers’ helpers. igitized for FRASERhttp://fraser.stlouisfed.org/Federal Reserve Bank of St. Louis.099.5
Wage R ates and H ours in 1936Average Union Wage Rates and HoursCertain anomalies enter into a comparison of average rates between2 years, when such averages reflect not only the actual rates providedfor in the agreements but the number of union members for that yearin each local union covered by the reported rates. B y and large itwould be expected that a general increase in actual rates would beaccompanied by an increase in the average rate paid to union members,but if union membership increases most (or decreases least) in thelower-paid crafts or in areas with less-than-average rates, the averageof the rates paid to all union members m ay go down. Conversely,the average rate m ay increase in spite of a downward swing in actualrates if union membership declines sufficiently in the lower-paid craftsor in areas where lower-than-average rates are paid.For the trends of actual union rates, the tables of indexes shouldbe consulted (tables 1 and 8). For a measure of the wage and hourstatus of all union workers engaged in these trades at a particulartime, the average rates should be used (table 4 ). Thus the changes inthe actual union rates in the building trades in the cities covered (asindicated in table 1) resulted in an average increase of 3.6 percentbetween 1935 and 1936. On the other hand, the average rate of allunion members in the building trades and cities covered increasedabout 1.6 percent (or 0,019). The average hourly rate for thejourneyman trades increased 0,038, and for the helpers and laborers 0,025.(The smaller increase in the average for all trades than inthe average for either the journeymen or helpers and laborers is dueto the higher rate of increase in membership between 1935 and 1936in the lower-paid group. The membership increase for laborers andhelpers was 48 percent, for journeymen 6 percent.)The portable and hoisting engineers had the highest average rate in1936 ( 1,447), bricklayers the next ( 1,411). Although the buildinglaborers received, on the average, the lowest rates in 1936 ( 0,795) ofany of the building trades, this represents a 7-cent increase over theaverage prevailing in 1935. Other significant increases in averagerates between the two years were: Carpenters 0,073, engineers 0,064, painters 0,053, tile layers’ helpers 0,052, steam fitters 0,043,asbestos workers 0,041, plumbers 0,037, and lathers 0,035.Decreases in average hourly rates between 1935 and 1936 occurredin several trades, particularly those of glaziers, stonemasons, stone cutters, marble setters’ helpers, and steam and sprinkler fitters’ helpers.It would appear, however, that most of these decreases in averageswere due more to changes in membership than to decreases in actual8Digitized for FRASERhttp://fraser.stlouisfed.org/Federal Reserve Bank of St. Louis
WAGER A T E S A N D H O U R S IN91936wage rates, since these trades showed more wage quotations with in creases than with decreases (see table 2) and the indexes for thesetrades computed on comparable data show increases (see table 8).T able4 .—Average union wage rates and hours in building trades in 70 cities,May 15, 1935, and May 15, 1936A v e r a g e w a g e ra te p e rhourA v era ge h ou rs p er w eekT rad e1936193519361935A ll b u ild in g t r a d e s 1,223 1.2043 8 .73 8 .7J o u r n e y m e nA s b e s t o s w o r k e r sB r ic k la y e r sC a r p e n t e r s .C e m e n t fin is h e r sE le c t r ic ia n s , in sid e w ir e m e nE l e v a t o r c o n s t r u c t o r s .E n g in e e rs , p o r t a b le a n d h o is t in gG la z ie r s . .G ra n ite c u tte r sL a t h e r sM a r b le s e tte r sM o s a ic a n d te rra z zo w o r k e r s . .P a in t e r s . . . .P la s te r e r s . . .P lu m b e r s a n d gas fit t e r sR o o fe r s , c o m p o s it i o nR o
about 4% percent. The index of union wage rates in effect on May 15, 1936, in the 70 cities covered in the study, was 91.6, based on the 1929 rates as 100. The index of union hours was 89.8. The average rate of wages in 1936 was 1,223 per hour; the average number of hours provided for in the union agreements was 38.7 per week.