Transcription
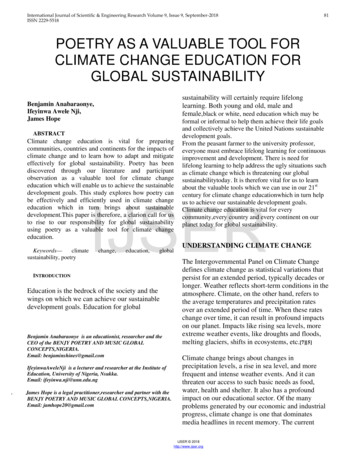
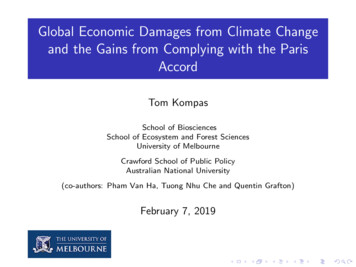
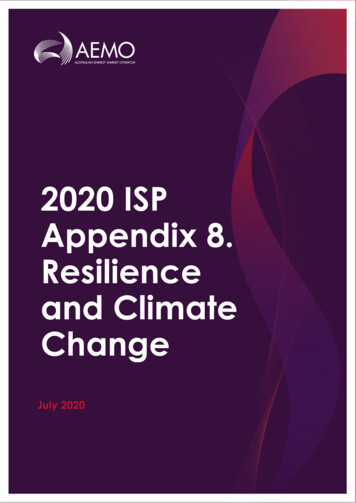
Cambridge University Press0521620899 - Global Warming: The Complete Briefing, Second EditionJohn HoughtonExcerptMore information1 Global Warming and Climate ChangeThe phrase ‘global warming’ has become familiar to manypeople as one of the important environmental issues of ourday. Many opinions have been expressed concerning it,from the doom-laden to the dismissive. This book aims tostate the current scientific position on global warming clearly,so that we can make informed decisions on the facts.Is the climate changing?In the year 2060 my grandchildren will be approaching seventy; what will theirworld be like? Indeed, what will it be like during the seventy years or so oftheir normal life span? Many new things have happened in the last seventyyears which could not have been predicted in the 1920s. The pace of change issuch that even more novelty can be expected in the next seventy. It is fairly certain that the world will be even more crowded and more connected. Will theincreasing scale of human activities affect the environment? In particular,willthe world be warmer? How is its climate likely to change?Before studying future climate changes, what can be said about climatechanges in the past? In the more distant past there have been very largechanges. The last million years have seen a succession of major ice ages interspersed with warmer periods. The last of these ice ages began to come to anend about 20,000 years ago and we are now in what is called an interglacialperiod. Chapter 4 will focus on these times far back in the past. But have therebeen changes in the very much shorter period of living memory – over the pastfew decades?Variations in day-to-day weather are occurring all the time; they are verymuch part of our lives. The climate of a region is its average weather over aperiod which may be a few months, a season or a few years. Variations in climate are also very familiar to us. We describe summers as wet or dry, wintersas mild, cold or stormy. In the British Isles, as in many parts of the world, noseason is the same as the last or indeed the same as any previous season, norwill it be repeated in detail next time round. Most of these variations we takefor granted; they add a lot of interest to our lives. Those we particularly noticeare the extreme situations and the climate disasters (for instance, Fig. 1.1shows the significant climate events and disasters during the year 1991). Mostof the worst disasters in the world are, in fact, weather- or climate-related.Table 1.1 lists them in order of severity although it does not include droughts,whose effects occur more slowly, but which are probably the most damagingdisasters of all.I S T H E C L I M AT E C H A N G I N G Cambridge University Press1www.cambridge.org
Cambridge University Press0521620899 - Global Warming: The Complete Briefing, Second EditionJohn HoughtonExcerptMore informationG L O B A L WA R M I N G A N D C L I M AT E C H A N G EFig. 1.1Significant climate anomalies and events during 1991 as recorded by the Climate Analysis Centre of the United States1.2 Cambridge University Presswww.cambridge.org
Cambridge University Press0521620899 - Global Warming: The Complete Briefing, Second EditionJohn HoughtonExcerptMore informationTHE 1980s: A REMARKABLE DECADE3Table 1.1Natural disasters 1947–1980 in order of severity2.1.2.3.4.5.6.7.8.9.10.Type of disasterDeathsTropical cyclones, hurricanes, typhoonsEarthquakesFloods (other than associated with 1)Tornadoes and sLandslidesTidal waves 0005,0005,0005,000The 1980s: a remarkable decadeThe 1980s were unusually warm. Globally speaking, the decade has been thewarmest since accurate records began somewhat over a hundred years ago andunusually warm years have continued into the 1990s. In terms of global average near surface air temperature, the year 1995 was the warmest on record and eightof the nine warmest years in the record occurred in the 1980s and early 1990s.The period has also been remarkable (just how remarkable will be considered later) for the frequency and intensity of extremes of weather and climate.For example, periods of unusually strong winds have been experienced inwestern Europe. During the early hours of the morning of 16 October 1987,over fifteen million trees were blown down in south-east England and theLondon area. The storm also hit Northern France, Belgium and Holland withferocious intensity; it turned out to be the worst storm experienced in the areasince 1703. Storm-force winds of similar intensity but covering a greater areaof western Europe struck on several occasions in January and February 1990.But those storms in Europe were mild by comparison with the much moreintense and damaging storms other parts of the world have experienced duringthese years. About eighty hurricanes and typhoons – other names for tropicalcyclones – occur around the tropical oceans each year, familiar enough tobegiven names. Hurricane Gilbert, which caused devastation on the island ofJamaica and the coast of Mexico in 1988, and Hurricane Andrew, which caused agreat deal of damage in Florida and other regions of the southern United States in1992, have been notable recent examples. Low-lying areas such as Bangladeshare particularly vulnerable to the storm surges associated with tropical cyclones;the combined effect of intensely low atmospheric pressure, extremely strongwinds and high tides causes a surge of water which can reach far inland. In oneof the worst such disasters this century over 250,000 people were drowned inBangladesh in 1970. The people of that country experienced another storm ofsimilar proportions in 1991 and smaller surges are a regular occurrence there. Cambridge University Presswww.cambridge.org
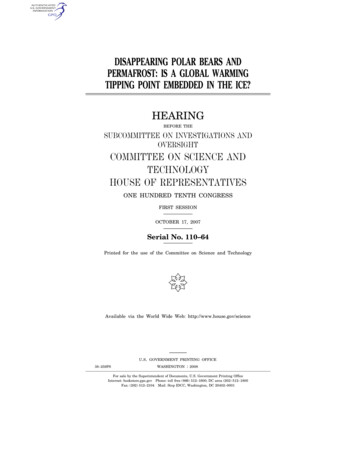
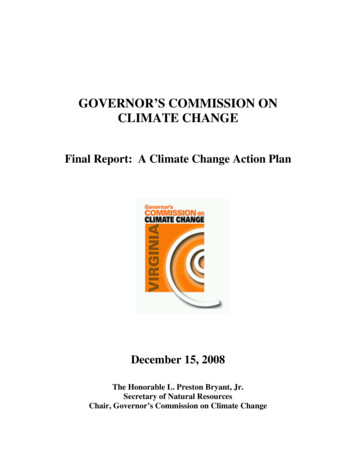
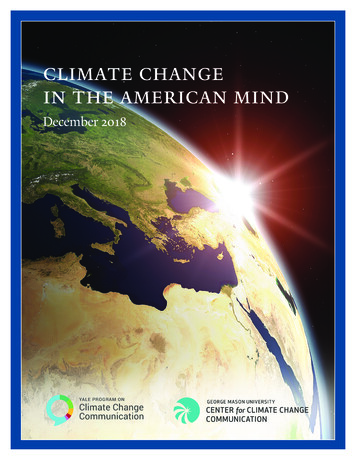
Cambridge University Press0521620899 - Global Warming: The Complete Briefing, Second EditionJohn HoughtonExcerptMore information4G L O B A L WA R M I N G A N D C L I M AT E C H A N G ETable 1.2Losses (in thousand millions of US dollars adjusted to 1992 prices) in major windstormcatastrophes 1960–92 (mostly in North America and Europe), estimated by a researchgroup advising the insurance industry3.Number of windstormcatastrophesEconomic lossesInsured 910 years1983–92823514348293819318852The increase in storm intensity during recent years has been tracked by theinsurance industry, which has been hit hard by recent disasters. Until the mid1980s, it was widely thought that windstorms with insured losses exceedingone thousand million US dollars were only possible, if at all, in the UnitedStates. But the gales that hit western Europe in October 1987 heralded a seriesof windstorm disasters which make losses of 10 thousand million dollars seemcommonplace. Hurricane Andrew, for instance, left in its wake insured lossesestimated at 16 thousand million dollars. The estimates in Table 1.2 illustratehow the numbers and extent of such disasters have increased during the pastthree decades. The rate of economic loss has risen by a factor of four since the1960s while the increase in insured losses is almost tenfold. Although some ofthis increase is due to the growth in population over this period in particularlyvulnerable areas, a significant part of it seems to have arisen from the increasedstorminess in the late 1980s and early 1990s.Windstorms are by no means the only weather and climate extremes thatcause disasters. Floods due to unusually intense or prolonged rainfall ordroughts because of long periods of reduced rainfall (or its complete absence)can be even more devastating to human life and property. These events occurfrequently in many parts of the world especially in the tropics and sub-tropics.There have been notable examples during the last decade. In 1988, the highestflood levels ever recorded occurred in Bangladesh; 80 per cent of the entirecountry was affected. The Yangtze river region of China experienced a devastating flood in 1991. In 1993, flood waters rose to levels higher than everrecorded in the region of the Mississippi and Missouri rivers in the UnitedStates, flooding an area equivalent in size to one of the Great Lakes. Largeareas of Africa, both north and south, and of Australia have had droughts on ascale and for longer periods than any in living memory.Because of the likely locations of floods and droughts, they often bear mostheavily on the most vulnerable in the world, who can have little resilience to majordisasters. Figure 1.2 shows that climate-related disasters account for more than halfof all disasters for the continent of Africa and illustrates the scale of the problem.The El Niño eventRainfall patterns which lead to floods and droughts in tropical and semi-tropical areas are strongly influenced by the surface temperature of the oceans Cambridge University Presswww.cambridge.org
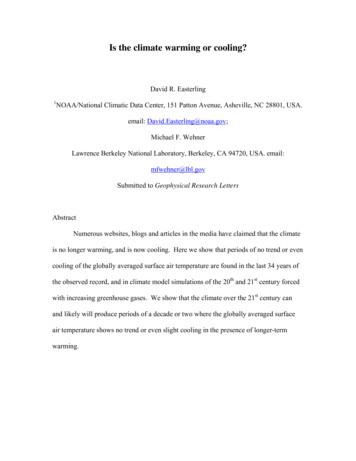
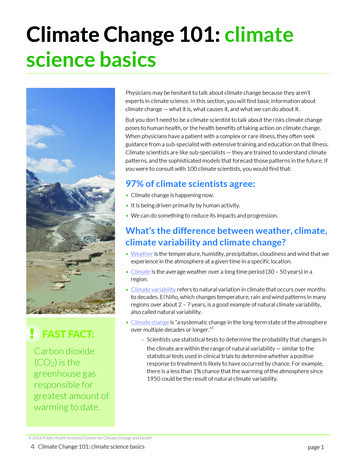
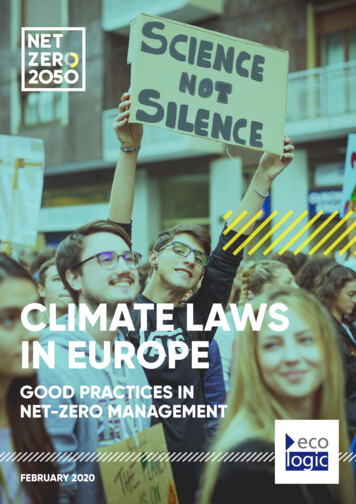
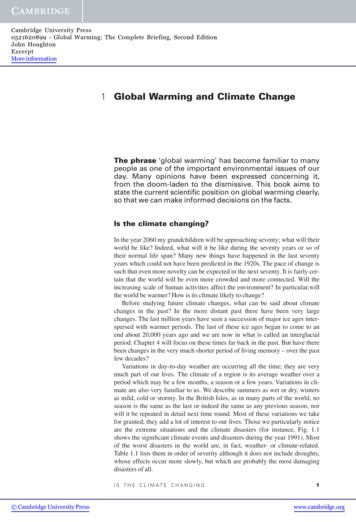
Cambridge University Press0521620899 - Global Warming: The Complete Briefing, Second EditionJohn HoughtonExcerptMore information5THE EFFECT OF VOLCANIC ERUPTIONSFig. 1.2Recorded disasters inAfrica, 1980–1989,estimated by theOrganization for AfricanUnity4.1000000DeadHomelessNumber of victims10000010000100010010FloodstalughpicTro nes DrolocycStorms quake anoes easesth VolcDisEararound the world, particularly the pattern of ocean surface temperature in thePacific off the coast of South America (see Chapter 5). About every three tofive years a large area of warmer water appears and persists for a year or more.Because they usually occur around Christmas these are known as El Niño (‘theboy child’) events. They have been well known for centuries to the countriesalong the coast of South America because of their devastating effect on thefishing industry; the warm top waters of the ocean prevent the nutrients fromlower, colder levels required by the fish from reaching the surface.A particularly intense El Niño occurred in 1982–83; the anomalous highs inocean surface temperature compared to the average reached 7 C. Droughtsand floods somewhere in almost all the continents were associated with that ElNiño (Fig. 1.3). Like many events associated with weather and climate, El Niñosoften differ very much in their detailed character. For instance, the El Niñoevent which began in 1990 and reached maturity early in 1992, apart fromsome weakening in mid-1992, continued to be dominated by the warm phaseuntil 1995. The exceptional floods in the central United States and in theAndes, and the droughts in Australia and Africa, are probably linked with thisunusually protracted El Niño. Studies with computer models of the kinddescribed later in Chapter 5 provide a scientific basis for the links between theEl Niño and these extreme weather events; they also give some confidence thatuseful forecasts of such disasters may one day be possible.The effect of volcanic eruptions on temperatureextremesVolcanoes inject enormous quantities of dust and gases into the upper atmosphere. Large amounts of sulphur dioxide are included, which through photochemical reactions using the sun’s energy are transformed to sulphuric acidand sulphate particles. Typically these particles remain in the stratosphere (the Cambridge University Presswww.cambridge.org
Cambridge University Press0521620899 - Global Warming: The Complete Briefing, Second EditionJohn HoughtonExcerptMore information6G L O B A L WA R M I N G A N D C L I M AT E C H A N G EFig. 1.3Regions wheredroughts and floodsoccurred associatedwith the 1982–83 ElNiño5.region of atmosphere above about 10 km in altitude) for several years beforethey fall into the lower atmosphere and are quickly washed out by rainfall.During this period they disperse around the whole globe and cut out some ofthe radiation from the sun, thus tending to cool the lower atmosphere.One of the largest volcanic eruptions this century was that from MountPinatubo in the Philippines on 12 June 1991 which injected about 20 milliontonnes of sulphur dioxide into the stratosphere together with enormous amountsof dust. This stratospheric dust caused spectacular sunsets around the world formany months following the eruption. The amount of radiation from the sun reaching the lower atmosphere fell by about 2 per cent. Global average temperatureslower by about a quarter of a degree Celsius were experienced for the followingtwo years. There is also evidence that some of the unusual weather patterns of1991 and 1992, for instance unusually cold winters in the Middle East and mildwinters in western Europe, were linked with effects of the volcanic dust.Vulnerable to changeOver the centuries different human communities have adapted to their particular climate; any large change to the average climate tends to bring stress of one Cambridge University Presswww.cambridge.org
Cambridge University Press0521620899 - Global Warming: The Complete Briefing, Second EditionJohn HoughtonExcerptMore informationT H E P R O B L E M O F G L O B A L WA R M I N G7kind or another. It is particularly the extreme climate events and climate disasters which emphasize the importance of climate to our lives and which demonstrate to countries around the world their vulnerability to climate change – avulnerability which is enhanced by rapidly increasing demands on resources.But the question must be asked: how remarkable are these events? Do theypoint to a changing climate due to human activities? Do they provide evidencefor global warming because of the increased carbon dioxide and other greenhouse gases being emitted into the atmosphere by burning fossil fuels?Here a note of caution must be sounded. The range of normal natural climate variation is large. Climate extremes are nothing new. Climate records arecontinually being broken. In fact, a month without a broken record somewherewould itself be something of a record! Changes in climate which indicate agenuine long-term trend can only be identified after many years.However, we know for sure that, because of human activities especially theburning of fossil fuels, carbon dioxide in the atmosphere has been increasingover the past two hundred years and more substantially over the past fiftyyears. To identify climate change related to this carbon dioxide increase, weneed to look for trends in global warming over similar lengths of time. Theyare long compared with both the memories of a generation and the period forwhich accurate and detailed records exist. Although, therefore, it can be ascertained that there has been more storminess, for instance, in the region of thenorth Atlantic during the late 1980s and early 1990s than there was in the previous two decades, it is not clear whether those years were that exceptionalcompared with other periods in the previous hundred years. There is even moredifficulty in tracking detailed climate trends in many other parts of the world,owing to the lack of adequate records; further, trends in the frequency of rareevents are very difficult to detect.The generally cold period worldwide during the 1960s and early 1970scaused speculation that the world was heading for an ice age. A British television programme about climate change called ‘The ice age cometh’ was prepared in the early 1970s and widely screened – but the cold trend soon came toan end. We must not be misled by our relatively short memories.What is important is continually to make careful comparisons betweenpractical observations of the climate and its changes and what scientific knowledge leads us to expect. During the last few years, as the occurrence of extremeevents has made the public much more aware of environmental issues, scientists in their turn have become somewhat more sure about just what humanactivities are doing to the climate. Later chapters will look in detail at the science of global warming and at the climate changes that we can expect, as wellas investigating how these changes fit in with the recent climate record. Here,however, is a brief outline of current scientific thinking on the problem.The problem of global warmingHuman industry and other activities such as deforestation are emitting increasing quantities of gases, in particular the gas carbon dioxide, into the atmosphere. Every year these emissions currently add to the carbon already present Cambridge University Presswww.cambridge.org
Cambridge University Press0521620899 - Global Warming: The Complete Briefing, Second EditionJohn HoughtonExcerptMore information8G L O B A L WA R M I N G A N D C L I M AT E C H A N G Ein atmospheric carbon dioxide a further seven thousand million tonnes, muchof which is likely to remain there for a period of a hundred years or more.Because carbon dioxide is a good absorber of heat radiation coming from theEarth’s surface, increased carbon dioxide acts like a blanket over the surface,keeping it warmer than it would otherwise be. With the increased temperaturethe amount of water vapour in the atmosphere also increases, providing moreof a blanket effect and causing it to be even warmer.Being kept warmer may sound appealing to those of us who live in cool climates. However, an increase in global temperature will lead to global climatechange. If the change were small and occurred slowly enough we would almostcertainly be able to adapt to it. However, with the rapid expansion taking placein the world’s industry the change is unlikely to be either small or slow. Theestimate I present in later chapters is that, in the absence of efforts to curb therise in the emissions of carbon dioxide, the global average temperature will riseby about a quarter of a degree Celsius every ten years – or about two and a halfdegrees in a century.This may not sound very much, especially when it is compared with normaltemperature variations from day to night or between one day and the next. Butit is not the temperature at one place but the temperature averaged over thewhole globe. The predicted rate of change of two and a half degrees a centuryis probably faster than the global average temperature has changed at any timeover the past ten thousand years. And as there is a difference in global averagetemperature of only about five or six degrees between the coldest part of an iceage and the warm period in between ice ages (see Fig. 4.4), we can see that afew degrees in this global average can represent a big change in climate.Not all the climate changes will in the end be adverse. While some parts ofthe world experience more frequent or more severe droughts or floods, otherparts perhaps in the sub-arctic may become more habitable. Even there,though, the likely rate of change will cause problems: large damage to buildings will occur in regions of melting permafrost, and trees in sub-arctic forestslike trees elsewhere will need time to adapt to new climatic regimes.Scientists are confident about the fact of global warming and climatechange due to human activities. However, substantial uncertainty remainsabout just how large the warming will be and what will be the patterns ofchange in different parts of the world. Although some indications can be given,scientists cannot yet say with a lot of detail which regions will be most affectedand in what way. Intensive research is needed to improve the confidence in scientific predictions.Uncertainty and responseUntil the predictions improve to the point where they can be used as a clearguide to action, politicians and others making decisions are faced with the needto weigh scientific uncertainty against the cost of the various actions whichcould be taken in response to the threat of climate change. Some action can betaken easily at relatively little cost (or even at a net saving of cost), for instancethe development of programmes to conserve and save energy, and many Cambridge University Presswww.cambridge.org
Cambridge University Press0521620899 - Global Warming: The Complete Briefing, Second EditionJohn HoughtonExcerptMore informationNOTES9schemes for reducing deforestation and encouraging the planting of trees.Other actions such as a large shift to energy sources which do not lead to significant carbon dioxide emissions (for example, renewable sources – biomass,hydro, wind or solar energy) in both the developed and the developing countries of the world will take some time. But here, too, a start can be made. Whatis important is that plans are made now in preparation for the major changesthat will almost certainly be required.In the following chapters I shall first explain the science of global warming,the evidence for it and the current state of the art regarding climate prediction. Ishall then go on to say what is known about the likely impacts of climate changeon human life – on water and food supplies for instance. The questions of whywe should be concerned for the environment and what action should be takenin the face of scientific uncertainty is followed by consideration of the technicalpossibilities for large reductions in the emissions of carbon dioxide and howthese might affect our energy sources and usage, including means of transport.Finally I will address the issue of the ‘global village’. So far as the environment is concerned, national boundaries are becoming less and less important;pollution in one country can now affect the whole world. And it is clear fromour current scientific understanding that global warming poses a global challenge, which must be met by global solutions.Questions12Look through recent copies of newspapers and magazines for articles whichmention climate change, global warming or the greenhouse effect. How manyof the statements made are accurate?Make up a simple questionnaire about climate change, global warming and thegreenhouse effect to find out how much people know about these subjects,their relevance and importance. Analyse results from responses to the questionnaire in terms of the background of the respondents. Suggest ways inwhich people could be better informed.Notes1 From World Climate News, No. 1, June 1992: World Meteorological Organization,Geneva.2 After B. V. Shah, 1983, quoted. in ‘Natural Disaster Reduction: how meteorologicalservices can help’, WMO, No. 722, 1989, World Meteorological Organization,Geneva.3 From G. Berz and K. Conrad, ‘Winds of change’, The Review, June 1993, pp. 32–5.4 From ‘The role of the World Meteorological Organization in the InternationalDecade for Natural Disaster Reduction’ WMO, No. 745, 1990, World Meteorological Organization, Geneva.5 Adapted from T. Y. Canby, ‘El Niño’s ill wind’, Natn. Geogr. Mag., 1984, pp.144–83. Cambridge University Presswww.cambridge.org
Cambridge University Press0521620899 - Global Warming: The Complete Briefing, Second EditionJohn HoughtonExcerptMore information2 The Greenhouse EffectThe basic principle of global warming can be understoodby considering the radiation energy from the sun whichwarms the Earth’s surface and the thermal radiation from theEarth and the atmosphere which is radiated out to space. Onaverage these two radiation streams must balance. If the balance is disturbed (for instance by an increase in atmosphericcarbon dioxide) it can be restored by an increase in theEarth’s surface temperature.How the Earth keeps warmTo explain the processes which warm the Earth and its atmosphere, I will beginwith a very simplified Earth. Suppose we could, all of a sudden, remove fromthe atmosphere all the clouds, the water vapour, the carbon dioxide and all theother minor gases and the dust leaving an atmosphere of nitrogen and oxygenonly. Everything else remains the same. What, under these conditions, wouldhappen to the atmospheric temperature?The calculation is an easy one, involving a relatively simple radiation balance. Radiant energy from the sun falls on a surface of one square metre in areaoutside the atmosphere and directly facing the sun at a rate of about 1370 watts– about the power radiated by a reasonably sized domestic electric fire. However, few parts of the Earth’s surface face the sun directly and in any case forhalf the time they are pointing away from the sun at night, so that the averageenergy falling on one square metre of a level surface outside the atmosphere isonly one quarter of this1 or about 343 watts. As this radiation passes throughthe atmosphere a small amount, about 6 per cent, is scattered back to space byatmospheric molecules. About 10 per cent on average is reflected back to spacefrom the land and ocean surface. The remaining 84 per cent, or about 288 wattsper square metre on average, remains actually to heat the surface – the powerused by three good-sized incandescent electric light bulbs.To balance this incoming energy, the Earth itself must radiate on average thesame amount of energy back to space (Fig. 2.1) in the form of thermal radiation. All objects emit this kind of radiation; if they are hot enough we can seethe radiation they emit. The sun at a temperature of about 6,000 C looks white;an electric fire at 800 C looks red. Cooler objects emit radiation which cannot beseen by our eyes and which lies at wavelengths beyond the red end of the spectrum – infrared radiation (sometimes called long-wave radiation to distinguishit from the short-wave radiation from the sun). On a clear, starry winter’s nightwe are very aware of the cooling effect of this kind of radiation being emittedby the Earth’s surface into space – it often leads to the formation of frost.10 Cambridge University PressTHE GREENHOUSE EFFECTwww.cambridge.org
group advising the insurance industry3. Decade Decade Decade 10 years 1960-69 1970-79 1980-89 1983-92 Number of windstorm catastrophes 8 14 29 31 Economic losses 23 34 38 88 Insured losses 5 8 19 52 The increase in storm intensity during recent years has been tracked by the insurance industry, which has been hit hard by recent disasters.