Transcription
Is the climate warming or cooling?David R. Easterling1NOAA/National Climatic Data Center, 151 Patton Avenue, Asheville, NC 28801, USA.email: David.Easterling@noaa.gov;Michael F. WehnerLawrence Berkeley National Laboratory, Berkeley, CA 94720, USA. email:mfwehner@lbl.govSubmitted to Geophysical Research LettersAbstractNumerous websites, blogs and articles in the media have claimed that the climateis no longer warming, and is now cooling. Here we show that periods of no trend or evencooling of the globally averaged surface air temperature are found in the last 34 years ofthe observed record, and in climate model simulations of the 20th and 21st century forcedwith increasing greenhouse gases. We show that the climate over the 21st century canand likely will produce periods of a decade or two where the globally averaged surfaceair temperature shows no trend or even slight cooling in the presence of longer-termwarming.
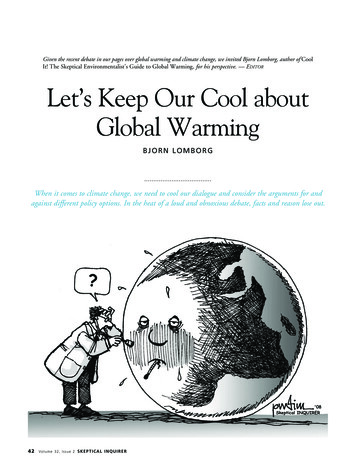
1. Introduction.Anthropogenic climate change is one of the most contentious scientific issues ofour time. Not surprisingly the issue has generated numerous blogs and websites with awide range of views on the subject. According to a number of these sources the climateis no longer warming, in fact, some claim the planet has been “cooling” since 1998 (e.g.Investor’s Business Daily 2008).It is true that if we fit a linear trend line to the annual global land-ocean surfaceair temperature (Smith et al. 2005) shown in Figure 1 for the period 1998 to 2008 there isno real trend, even though global temperatures remain well above the long-term average.The unusually strong 1997-1998 El Niño contributed to unusual warmth in the globaltemperature for 1998 at the start of this period resulting in only a small, statisticallyinsignificant positive trend. However, if we fit a trend line to the same annual globalland-ocean temperatures for the 1977-1985 period or the 1981-1989 period we also getno trend, even though these periods are embedded in the 1975-2008 period showing asubstantial overall warming. Furthermore, if we drop 1998 and fit the trend to the period1999-2008 we indeed get a strong, statistically significant positive trend. It is easy to“cherry pick” a period to reinforce a point of view, but this notion begs the question, whatwould happen to the current concerns about climate change if we do have a sustainedperiod where the climate appears to be cooling even when, in the end, the longer termtrend is warming?The reality of the climate system is that, due to natural climate variability, it isentirely possible to have a period as long as a decade or two of “cooling” superimposedon the longer-term warming trend due to anthropogenic greenhouse gas forcing. Climate
scientists pay little attention to these short-term fluctuations as the short term “coolingtrends” mentioned above are statistically insignificant and fitting trends to such shortperiods is not very meaningful in the context of long-term climate change . On the otherhand, segments of the general public do pay attention to these fluctuations and somecritics cite the most recent period as evidence against anthropogenic-forced climatechange. Here we analyze both the observed record and a series of climate modelsimulations for the occurrence of both positive and negative decadal trends in theglobally averaged surface air temperature to show that it is possible, and indeed likely tohave a period of as long as a decade or two with no trend in an anthropogenically forcedclimate.2. Data and Methods.For this analysis we examine the observed globally averaged surface airtemperature time series for the period 1901-2008 produced using the method described inSmith et al. (2005). This data set is routinely updated and used in climate monitoringactivities by the National Climatic Data Center. Coupled climate model simulations ofglobally averaged surface air temperature were obtained from the Coupled ModelIntercomparison Project 3 (CMIP3: Meehl et al. 2007) database of climate modelsimulations archived at the Program for Climate Model Diagnosis and Intercomparison(PCMDI) at the Lawrence Livermore National Laboratory.Our analysis consisted of fitting least-squares trends to running 10-year periods inthe global surface air temperature time series for: 1. the observed record, 2. an ensembleof long control simulations, 3. an ensemble of 20th century simulations, and 4. an
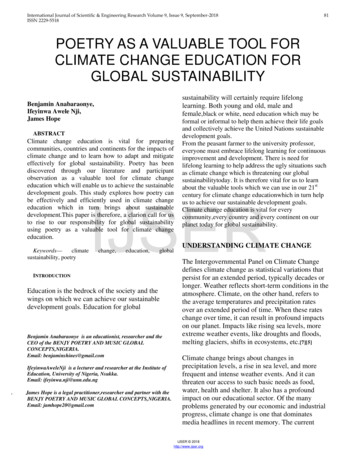
ensemble of simulations forced with the Special Report on Emissions Scenarios (SRES:Nakicenovic and Swart 2000) A2 forcing scenario for the 21st century. This resulted inprobability distribution functions of decadal trends for each of the 4 sets of time series.3. Results.Figure 2 shows the average annual global surface air temperature from a singlesimulation of the ECHAM5 coupled climate model (Roeckner et al. 2003) forced with theSRES A2 forcing scenario. The A2 scenario postulates a “business as usual” future withlittle reduction in anthropogenic emissions resulting in large greenhouse gasconcentrations by the end of the 21st century. We chose this simulation randomly fromthe CMIP3 database of climate model simulations. In this simulation by the end of the21st century the global climate warms by approximately 4oC, consistent with the otherclimate model simulations used in the Fourth Assessment Report (AR4) of theIntergovernmental Panel on Climate Change (IPCC 2007). An individual simulation, asopposed to a multi-model, multi-realization average, reveals interesting decadal scalefeatures that can provide insight into the single trajectory that the actual climate is taking.We highlight two periods in Figure 2, 2001-2010 and 2016-2031. Both of these periodsshow a small, statistically insignificant negative trend based on a simple least-squarestrend line and there are other periods, such as the last seven years of this simulation, thatshow a similar lack of trend. This behavior occurs without any simulated volcaniceruptions or solar variability (natural forcing) that could result in a widespread coolingfor some period of years and thus is presumed entirely due to natural internal variability.This behavior is not unique to this particular realization of the ECHAM5 modeland to illustrate this, we show in Figure 3 the probability distribution functions of decadal
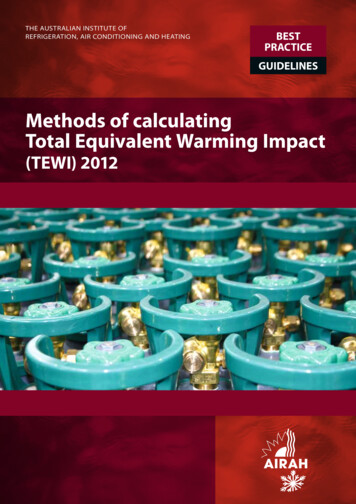
trends in annual average global surface air temperature in the observed record (Smith etal. 2005) and several numerical experiments. The black line is calculated from theobserved record, magenta from pre-industrial control simulations containing noanthropogenic or natural forcing factors that have been detrended due to model drift inthese experiments, the green line from simulations of the 20th century with both naturaland anthropogenic forcing, the blue line from simulations for the first half of the 21stcentury forced with the A2 emissions scenario, and the red line from simulations of theentire 21st century under the A2 scenario. We used all available simulations in theCMIP3 database for the IPCC AR4 in the construction of these distributions.Not surprisingly the probabilities for the long control runs are symmetrical arounda zero trend, with more or less equal chances of a positive or negative decadal trend overthe entire global surface air temperature time series. For the 20th century simulations(using observed natural and anthropogenic forcing) there is a shift in the distribution tomore positive values but there is still a significant chance of a negative decadal trend.The observed record shows a very similar distribution to the 20th century simulations,especially considering that only one version of the observed record was used in thisanalysis adding credence to the conclusions in the IPCC AR4 that the observed warmingsince 1950 is very likely due to increasing greenhouse gases . Finally for thesimulations of the entire 21st century there is still about a 5% chance of a negativedecadal trend, even in the absence of any simulated volcanic eruptions. If we restrict theperiod to the first half of the 21st century the probability increases to about 10% revealingthat the trend in surface air temperature has its own positive trend in the A2 emissionsscenario.
Another interesting question is the percentage of the decadal trends that arestatistically significant in each of the modeling experiments and the observed record.We calculated the percentage of both negative and positive decadal trends outside of the95% confidence interval of the control experiment (as defined from the control variance).As the observations and the transient experiments include increasing greenhouse gasforcing, we expect to find more statistically significant positive trends and fewerstatistically significant negative trends. Table 1 shows that this is indeed the case. Thecontrol experiment has an equal percentage of statistically significant positive andnegative trends. The observations and the 20th century simulations show similar smallpercentages although the model results reveal a somewhat broader distribution. Thedifference may in part be due to the single realization for the observed record. However,for the A2 forcing scenario, both for the first half and the entire 21st century there are nostatistically significant negative trends. But, consistent with the positive shift in theprobability distributions, the percentage of statistically significant positive trendsincreases from 26% for the first half of the 21st century to 47% for the entire century.What does this say about the variability of the climate system? Climate modelsare often criticized for producing a more or less monotonic-type response toanthropogenic forcing in 21st century simulations. Part of this may be due to the lack ofvolcanic and solar forcing in the SRES scenarios of anthropogenic forcing increase forthe 21st century and part could be due to the fact that large-scale oscillatory climatefeatures, such as the El Niño-Southern Oscillation are not well simulated. However, evenconsidering these criticisms, it is clear that the models can and do produce sustainedmulti-year periods of “cooling” embedded within the longer-term warming produced in
the 21st century simulations. Therefore, it is reasonable to expect that the naturalvariability of the real climate system can and likely will produce multi-year periods ofsustained “cooling” or at least periods with no real trend even in the presence of longterm anthropogenic forced warming. Claims that global warming is not occurring thatare derived from a cooling observed over such short time periods ignore this naturalvariability and are misleading.4. Acknowledgements.We acknowledge the modeling groups, the Program for Climate Model Diagnosisand Intercomparison (PCMDI) and the World Climate Research Program’s (WCRP)Working Group on Coupled Modeling (WGCM) for their roles in making available theWCRP CMIP3 multi-model dataset. Support of this dataset and support for this analysisis provided by the Office of Science, U.S. Department of Energy. Additional support toDRE was provided by the Office of Biological and Environmental Sciences, U.S.Department of Energy under Interagency Agreement DE-AI02-96ER62276.
5. ReferencesInvestor’s Business Daily, 2008: Alarmists Still Heated Even As World x?id 310695037962525IPCC, 2007: Climate Change 2007: The Physical Science Basis. Contribution of WorkingGroup I to the Fourth Assessment Report of the Intergovernmental Panel onClimate Change [Solomon, S., D. Qin, M. Manning, Z. Chen, M. Marquis, K.G.Averyt, M. Tignor, and H.L. Miller (eds.)]. Cambridge University Press,Cambridge, United Kingdom and New York, NY, USA, 996 pp.Meehl, G. A., et al., 2007: The WCRP CMIP3 multi-model dataset: A new era in climatechange research, Bull. Amer. Meteor. Soc., 88, 1383-1394.Nakićenović, N., and R. Swart (Eds.) 2000: Special Report on Emissions Scenarios. ASpecial Report of Working Group III of the Intergovernmental Panel on ClimateChange. Cambridge University Press, Cambridge, United Kingdom and NewYork, NY, USA, 599 pp.Roeckner, E., G. Bäuml , L. Bonaventura , R. Brokopf , M. Esch, M. Giorgetta , S.Hagemann , I. Kirchner , L. Kornblueh, E. Manzini , A. Rhodin , U. Schlese , U.Schulzweida , A. Tompkins, The atmospheric general circulation modelECHAM5, Max Planck Institute for Meteorology, Report No. 349, Hamburg 2003.Smith, T.M. et al., 2005: New surface temperature analysis for climate monitoring,Geophys. Res. Letts., 32, L14712, doi:10.1029.2005GL023402.
Figure 1: globally averaged surface air temperature for land and ocean based on the dataset by Smith et al. (2005).Figure 2: One realization of the globally averaged surface air temperature from theECHAM5 coupled climate model forced with the SRES A2 greenhouse gas increasescenario for the 21st century.Figure 3: Probability distribution functions for decadal trends (kelvin/year) in globallyaveraged surface air temperature for the observed record (black), a set of pre-industrialcontrol runs (magenta), the 20th century simulations (green), and the 21st centurysimulations forced with the SRES A2 scenario for the first half of the 21st century (blue)and entire 21st century (red).
Table 1. Percentage of statistically significant (95% confidence level) positive andnegative decadal trends by modeling experiment and the observed record.ExperimentNegative Trends (%)Positive Trends (%)Observations, 1901-20081.03.0Control2.652.6520th Century1.978.63A2, 2000-20500.026.0A2, 2000-20990.047.4
is no longer warming, and is now cooling. Here we show that periods of no trend or even cooling of the globally averaged surface air temperature are found in the last 34 years of the observed record, and in climate model simulations of the 20th and 21st century forced with increasing greenhouse gases. We show that the climate over the 21st .