Transcription
P E N N I U R WO R K I N G PA P E RIs the CRA Still Relevant toMortgage Lending?PAU L C A L E MVice President, Department of Supervision, Regulation, and Credit, Federal Reserve Bank of PhiladelphiaContact Information: Paul.Calem@phil.frb.orgL AU R E N L A M B I E - H A N S O NPrincipal Financial Economist, Department of Supervision, Regulation, and Credit, Federal Reserve Bank of PhiladelphiaContact Information: Lauren.Lambie-Hanson@phil.frb.orgS U SA N WAC H T E RSussman Professor, Professor of Real Estate and Finance, The Wharton SchoolCo-Director, Penn Institute for Urban Research University of PennsylvaniaContact Information: wachter@wharton.upenn.eduS E P T E M B E R 2 019Photo by NCinDC, via Flickr.
2 Penn IUR Working Paper Is the CRA Still Relevant to Mortgage Lending?ContentsSusan Wachteracknowledgesfinancial supportfrom the Zell-LurieReal Estate Centerat the WhartonSchool of theUniversity ofPennsylvania. Theviews expressedhere are those ofthe authors andnot necessarily theFederal ReserveBank of Philadelphiaor the FederalReserve System.1. Introduction.32. Literature Review.33. Evolving Market Shares of Banking Institutions and Nonbanks.44. Lending to Low- or Moderate-Income Households and Communities.65. Conclusion.9Notes.17References. 18A B S T R AC TMarket share of conforming-size, home purchase mortgage originations has steadily and substantially shiftedfrom banking institutions to nonbank lenders over recent years. In 2017, nonbanks originated more than 1.8million conventional and FHA purchase mortgages (53% of the market), as compared to 1.4 million by banks. Incontrast, nonbanks originated 30% of purchase-money mortgages (by volume) in 2000 and 24% in 2007. Doesthe declining role of banking institutions imply that the Community Reinvestment Act (CRA) is becoming lessrelevant to mortgage lending, since only they are subject to the requirements of the CRA?We address this question by exploring the changing composition of home purchase mortgage originations since2000. We focus on the share of FHA and conforming-sized conventional loans to low- or moderate incomehouseholds or to finance properties in low- or moderate-income neighborhoods, and provide a more detailedexamination of the shifts in market composition than previous studies.Our analysis points to a conclusion that the CRA continues to be relevant to maintaining broad access tomortgage credit. We find that the overall share of loans to low-or moderate-income borrowers has decreasedcompared to pre-2004, which we view as a reasonable benchmark period. However, this decrease has mostlybeen offset by an increased share to borrowers (broadly distributed by income) purchasing properties in low- ormoderate-income neighborhoods.
Penn IUR Working Paper Is the CRA Still Relevant to Mortgage Lending? 31 . I N T RO D U C T I O NAs housing markets in the United States recovered from the foreclosure crisis and stabilized during 2012through 2017, the mortgage origination market became reconfigured. Market share steadily and substantiallyshifted from banking institutions to nonbank lenders. By 2017, nonbank institutions were originating aslight majority of conforming-sized conventional mortgages and nearly four-out-of-five Federal HousingAdministration (FHA) insured loans. The volume of mortgage lending by banks decreased from 3 millionloans in 2000 to 1.5 million in 2017, while nonbank loans increased from 1.5 to 2 million loans. Overall lendinghas substantially decreased, particularly for conforming-sized conventional mortgages, as FHA loan volumeincreased.Whereas depository institutions (other than credit unions) are subject to the requirements of the CommunityReinvestment Act (CRA), nonbank lenders are not. This raises the following question: Does the declining roleof banking institutions (especially in originating FHA loans, which tend to be favored by low-and-moderateincome borrowers and those purchasing homes in low- or moderate-income areas), imply that the CRA isbecoming less relevant to mortgage lending?We address this question by exploring the changing composition of home purchase mortgage originations since2000, focusing on the share of FHA and conforming-sized conventional loans provided to low-and-moderateincome households or financing properties in low-and-moderate-income neighborhoods.1 We provide a moredetailed examination of the shifts in market composition than previous studies, such as by distinguishingbetween different size categories of banks and across markets with differing affordability trends.The analysis points to a conclusion that the CRA continues to be relevant. In particular, community bankshave maintained a stable share of the overall market and an increasing share of loans to finance properties inlow- and moderate-income neighborhoods. We also find that the overall share of FHA and conforming-sizedconventional loans from all lenders to low- or moderate-income borrowers has decreased compared to pre2004, which we view as a reasonable benchmark period. This decline is occurring along with tighter creditconditions compared to pre-2005. Moreover, a more pronounced decline is observed in areas with greaterhouse price appreciation, which suggests an impact of declining affordability. However, this decrease hasbeen mostly offset by an increased share of lending to borrowers (broadly distributed by income) purchasingproperties in low- or moderate-income neighborhoods.The remainder of the paper is organized as follows. Section 2 provides a brief review of previous studiesthat have documented and examined the recent shift in market share of mortgage originations to nonbanks.Section 3 presents our longer-term look at the evolving market shares of nonbanks and banking institutionsdifferentiated by size category, for the overall conforming-sized, home purchase loan market and separately forthe conventional and government-insured segments. Section 4 examines, at various levels of aggregation, theevolving share of loans originated to low-and-moderate-income households or to finance properties in low- ormoderate-income neighborhoods. Section 5 concludes.2 . LI T E R AT U R E R E V I E WThe shift in market share of mortgage origination from banking institutions to nonbanks since 2011 has beenwidely reported and discussed both in the popular press and in government and industry publications, and alsohas been the subject of a number of academic studies. Mostly these have focused on the exit of large bankinginstitutions from FHA and VA lending and related issues, including potential impacts on lending to low-andmoderate-income borrowers. 2
4 Penn IUR Working Paper Is the CRA Still Relevant to Mortgage Lending?Kim, Laufer, Pence, Stanton, and Wallace (2018) document the reduction in FHA lending among depositoryinstitutions, and report that as of 2016, nonbanks captured 75% of the combined FHA and VA market. Theypoint to increased capital requirements for the mortgage servicing assets of large banking institutions as areason for this shift of FHA and VA lending to nonbanks and assess the implications for financial stability.3 Inparticular, they argue that concentration of mortgage lending and servicing among nonbanks poses risk of aliquidity crisis in the mortgage market in the event of a major housing market downturn, because “nonbankmortgage companies are subject to liquidity pressures in both their origination and servicing activities.”Fuster et al. (2018) explore the growth of nonbank FinTech lenders in the mortgage origination market. Theypresent evidence that quicker and more efficient processing of loan applications by these lenders has been animportant contributing factor. Gete and Reher (2019) argue that a portion of the growth in nonbank marketshare can be explained by the introduction of the U.S. Liquidity Coverage Ratio rule in 2014, which fueleddemand for Ginnie Mae mortgage-backed securities by the large financial institutions covered by the rule.Bhutta, Laufer, and Ringo (2017) document a significant reduction in lending to low-and-moderate-incomeborrowers between 2010 and 2016. They find similar patterns between banks and nonbanks, but for thelargest three banks (Wells Fargo, Bank of America, and JPMorgan Chase) they find a more precipitous decline.They explain that the steeper decline for these institutions was mostly, but not entirely, a consequence oftheir retreat from FHA lending, which disproportionately serves low-and-moderate-income households. Theyattribute the retreat from FHA lending to recent litigation brought by the Department of Justice against largelenders under the False Claims Act. 4Unlike banks, nonbanks are not subject to CRA, so they may have less incentive to serve low- or moderateincome borrowers and communities. Indeed, recent research has found convincing evidence of a causal impactof CRA on expanding credit access by banks. Ding and Nakamura (2017) and Ringo (2018) study exogenouschanges in metropolitan boundaries, which alter CRA eligibility thresholds, and find that the CRA has a positiveimpact on financing of home purchases by low-and-moderate-income households and in low-and-moderateincome neighborhoods. Ringo’s study focuses on metropolitan boundary changes in 2003 and argues that theadditional loans originated because of the CRA are not inherently riskier than other loans made to borrowerswith similar income levels.Bhutta and Ringo (2015) summarize the literature on the CRA’s role in expanding credit access, and assessthe evidence on whether the CRA contributed to the foreclosure crisis that accompanied the housing marketdownturn of 2007 through 2011. They conclude that the CRA was not a significant contributor to the crisis,since few subprime mortgages were CRA-related, and CRA-related loans did not exhibit worse performance.However, in response to the crisis and the consequent tightening of regulations and imposition of penalties,banks have tightened their supply of credit.Gete and Reher (2017) consider the impact of this tightening of mortgage credit by lenders who experiencedregulatory shocks following the Dodd-Frank Act. They find that areas with greater exposure to these lendersexperience a greater overall restriction in the supply of credit, resulting in more households being unable tobecome homeowners. Similarly, Mondragon (2018) finds that counties more exposed to the collapse of a largemortgage lender experienced a larger reduction in total mortgage credit and ultimately in local employmentrates.53 . E VO LV I N G M A R K E T S H A R E S O F BA N K I N G I N ST I T U T I O N S A N DN O N BA N K SWe use Home Mortgage Disclosure Act (HMDA) data from 2000 through 2017 to study the evolving role ofbanks versus nonbanks and its implications for the CRA.6 HMDA data are submitted annually in early spring
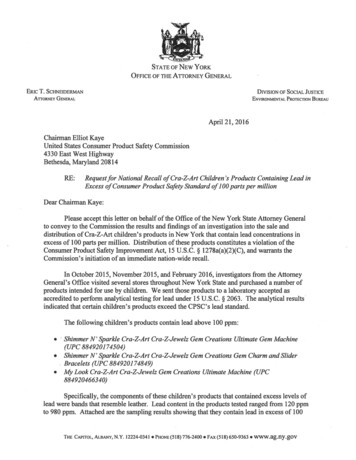
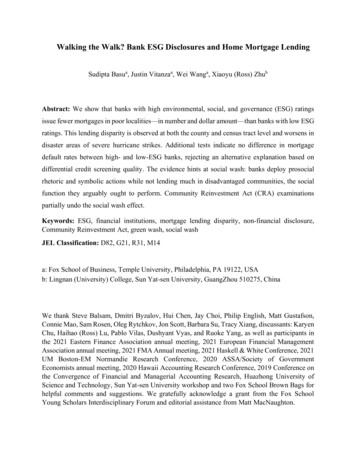
Penn IUR Working Paper Is the CRA Still Relevant to Mortgage Lending? 5by mortgage lending institutions, providing information on each home purchase and refinance mortgageapplication from the preceding year. HMDA filers include all commercial banks, savings and loan institutions,credit unions, and mortgage companies that meet minimum asset size thresholds and have a branch in ametropolitan area.7HMDA data provide the action taken on each loan application (whether it was approved, denied, or withdrawn);the year of the application and of the action taken; loan purpose (purchase or refinance); loan amount; lienposition (first- or junior-lien); loan type (conventional, FHA, VA, or other government-insured); occupancy status(owner-occupied, second home, or investor property); and property type (one-to-four family or multi-family).HMDA data also provide the income and racial or ethnic classification of the applicant (and of the co-applicant,if applicable) and the state, county, and Census tract location of the subject property. In addition, the dataindicate whether an originated loan was sold prior to year-end, and the type of purchaser. 8We restrict attention to originated (approved and not withdrawn) conventional and FHA loans on first-lienhome purchase mortgages originated and secured by one- to four-family properties. In particular, we excluderefinance loans, because the refinance market is largely distinct from the market for home purchase loans, as itis comprised of households with existing mortgages who are seeking to extract equity (cash-out refinance) orobtain more favorable terms (interest rate refinance).Loan counts. We begin by charting mortgage origination volumes by institution category, annually for 2000through 2017. Panel A of Figure 1 displays the number of purchase mortgage originations each year by banks(including both commercial banks and thrifts), nonbanks, and credit unions. Panels B, C, and D break out thePanel A observations by loan type: conforming-sized conventional, FHA, and jumbo.As seen in Figure 1, total home purchase loan originations have been on a steady upswing since 2011. Thisgrowth primarily reflects the lending activity of nonbanks; bank lending has not kept pace. Although originationvolume of credit unions has been rising since 2011 for each loan type, and most noticeably for conventionalconforming, these volumes are minimal compared to banks and nonbanks.FHA lending by banking institutions has declined precipitously—whereas banks and nonbanks were aboutequally active in FHA lending in 2011, by 2017 nearly 80 percent of FHA loans were originated by nonbanks.Although banks had long been dominant in the conventional conforming market, their volume of conventional,conforming-sized mortgage originations has been flat since 2013, while the loan volume that of nonbanks hasincreased steadily, surpassing that of banks in 2017. Banks remain dominant in the jumbo mortgage market.While this market has grown steadily since 2011, origination volumes remain well below pre-downturn levels.Market shares. Figure 2 shows market shares by institution category, annually for 2000 through 2017. PanelA displays market shares of conforming conventional plus FHA originations for nonbanks and three sizecategories of banks: large ( 50 billion in assets), regional ( 10 – 50 billion in assets), and community banks( 10 billion in nominal assets), based on total assets from end-of-year Call Report filings. Panels B, C, and D,respectively, display market shares for the conforming-sized conventional, FHA, and jumbo loan type segments.Note that while we include credit unions in market totals and when calculating market shares of other lenders,we do not distinguish them in the chart due to their minimal market shares.Since 2011, nonbanks have increased their market share of each loan type. As of 2017, nonbanks originatedclose to half of all conventional conforming and nearly 80 percent of FHA mortgages. These volumes are muchhigher than in the years preceding the 2007 through 2011 housing market downturn, when nonbanks’ marketshares were relatively stable at roughly 45 percent of FHA and 30 to 35 percent of conventional conformingoriginations. As of 2017, nonbanks’ market share of jumbo originations was 20 percent, roughly the same as in2000 through 2003 but below their peak share of just over 30 percent in 2005 and 2006.
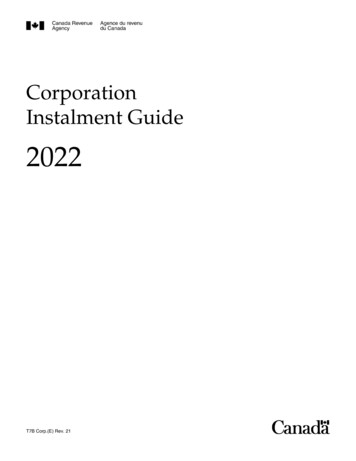
6 Penn IUR Working Paper Is the CRA Still Relevant to Mortgage Lending?The market share of regional banks dropped sharply between 2004 and 2006, consistently across loantype segments, with overall share dropping from 25 down to 10 percent. After 2006, their market share ofjumbo originations remained roughly stable at about 10 percent. Regional banks’ market shares of FHA andconventional conforming originations continued a steady decline through 2012, and then stabilized at an overallmarket share of about 6 percent.Large banks’ market share exhibits broadly similar patterns over time between FHA and conventionalconforming—roughly stable during 2000 through 2004 (ranging between 15 and 20 percent for FHA and20 to 25 percent for conventional conforming; rising sharply in 2005 through 2007 for each loan type, andsubsequently declining substantially. As of 2012 both had returned to their pre-2004 levels, but then continuedto decline. As of 2017, large banks had nearly entirely exited the FHA market, and were originating only 10percent of conventional conforming mortgages. Large banks’ market share of jumbo originations also rosesharply during 2005 through 2007, when it peaked at 60 percent. It has since fallen back to 50 percent as of2017, still well above pre-2005 levels.Community banks are characterized by a relatively stable market share, making up 13-28% of conventional loansbetween 2000 and 2017 (Figure 2 Panel B), and originating 13-19% of FHA loans (Panel C). Since 2014, theyhave lost some ground to nonbanks, but as of 2017 their market share is only slightly below its 2000 through2003 average, overall as well as for each loan type.4 . LE N D I N G TO LOW- O R M O D E R AT E - I N CO M E H O U S E H O LD S A N DCO M M U N I T I E SDoes the declining role of banking institutions in home purchase lending, especially in originating FHA loans(which tend to be favored by low-and-moderate-income borrowers and those purchasing homes in low- ormoderate-income areas), imply that the CRA is becoming less relevant to this credit market? We have notedthat for each loan type, the market share of community banks remains (as of 2017) close to what it what itwas historically during 2000 through 2003, while the market share for large and regional banks declined. Asthat could be considered a relatively normal historical period for the housing market, in contrast to the rapidlyrising house price environment (housing bubble) of 2004-2006 and subsequent severe downturn, it provides areasonable benchmark.In this context, it is important to recognize that, despite the relatively high proportion of loans to low- ormoderate-income households and communities that characterizes FHA lending, these low- or moderateincome borrowers and communities have traditionally relied on conventional loan products to an importantextent. Thus, despite the large shift in market share of FHA lending to nonbanks, the ongoing relevance ofCRA may be reflected in banks’ role serving low- or moderate-income households and communities throughconventional mortgage lending.To further explore this issue, we now examine the evolving shares of FHA and conforming-sized conventionalloans provided to low- or moderate income households or financing properties in low- or moderate-incomeneighborhoods, by loan type and institution category. In presenting this analysis, we again do not distinguishcredit unions and also will not separately show regional banks due to their small market shares, so as to avoidcrowding the charts. However, we include credit unions and regional banks when aggregating all lenders in theanalysis. We exclude a small number of loans originated by international lenders.Lending to low- or moderate-income borrowers. Figure 3 shows the volume and Figure 4 shows thepercentage of loans originated to low- or moderate-income borrowers, annually by loan type during 2000through 2017. Panel A of Figure 4 displays the annual percentage originated to these borrowers among allhome purchase mortgages (FHA, conventional conforming, and jumbo). Panels B, C, and D, respectively, show
Penn IUR Working Paper Is the CRA Still Relevant to Mortgage Lending? 7the annual percentages originated to these borrowers for conventional conforming plus FHA, conventionalconforming only, and FHA only.As seen in Figure 4, the share of FHA and conforming-sized conventional mortgages originated to low- ormoderate-income borrowers by HMDA reporters dropped sharply during the housing market “bubble” periodof 2005 and 2006. This drop is common to all HMDA reporters, banks as well as nonbanks. The result of theaffordability pressures was an increase in the share of loans originated to higher income households.The overall percentage of conventional conforming plus FHA mortgages originated to low- and moderateincome borrowers partially rebounded in 2007 and 2008, reflecting a shift in the market toward FHAborrowing. The rebound accelerated in 2009, bringing the overall percentage to a historical peak at 35 percent,likely due to exceptionally weak demand for mortgages from middle and upper income households, combinedwith falling home prices making purchases more affordable.Between 2009 and 2014, as the housing market recovered and housing prices rebounded, the overallpercentage of conventional conforming plus FHA mortgages originated to low- and moderate-incomeborrowers substantially declined. Since 2014, this overall percentage and the percentage originated to low- andmoderate-income borrowers within the conforming conventional segment seem to have stabilized, but are wellbelow what they were in the early 2000’s, as are the dollar volumes of lending. Within FHA, the percentageoriginated to low-and moderate-income borrowers continued to decline after 2014, but the increase in FHArelative to conforming conventional originations offset this decline. Overall, there was a long-run decline in theshare of conventional conforming mortgages originated to low- and moderate-income borrowers, from about32 percent in the early 2000’s to about 26 percent in 2017.The long-run decline in the share of conventional conforming mortgages originated to low- and moderateincome borrowers may reflect tighter credit standards since the mortgage crisis, as well as a long-run decline inhome affordability. In addition, large and regional banking institutions exited from FHA lending and decreasedtheir lending share to the conventional conforming segment. These trends seem to suggest a reduced role forthe CRA in mortgage lending particularly for large and regional banks as nonbanks, not covered by the CRA,expanded their lending to this market, at the expense of covered banks.Notably, however, community banks not only have retained market share, but consistently have originated acomparatively large percentage of their conforming conventional and FHA mortgages to low- or moderateincome borrowers, including in recent years. We next turn our attention to the geographic distribution of banklending.Lending to CRA-qualifying neighborhoods. Figure 5 shows the percentage of purchase-money mortgagesoriginated in a CRA-qualifying (low- or moderate-income or distressed/underserved) Census tract, annuallyby loan type and institution category, during 2000 through 2017. Panel A displays the annual percentageoriginated to these neighborhoods among all home purchase loans (FHA, conventional conforming, andjumbo). Panels B, C, and D, respectively, show the annual percentages originated to these neighborhoods forconventional conforming plus FHA, conventional conforming only, and FHA only.Beginning in 2006, the Federal Financial Institutions Examination Council initiated a list of distressed andunderserved nonmetropolitan tracts that are middle or high income but are CRA-eligible due to features suchas high poverty rates or population loss. Together with low- or moderate-income Census tracts (those withmedian family income less than or equal to 80% of the area median income), these tracts make up CRA-eligibleneighborhoods. Community banks originate a greater share of their loans in nonmetropolitan tracts, which maydrive their relatively larger increase in low- or moderate-income lending to CRA-eligible tracts in 2006 andlater, as compared to other lender types that are more active in metropolitan areas, which were not affected bythe adoption of the distressed and underserved status.
8 Penn IUR Working Paper Is the CRA Still Relevant to Mortgage Lending?From 2007 to 2011, the percentage of loans made in CRA-qualifying communities declined within eachinstitution category.9 Since 2012, the percentage of loans originated to these communities has been increasingwithin each institution category, surpassing pre-2004 levels by 2017.10 With respect to conventional conformingmortgages, this trend has been strongest among community banks.Lending to low- or moderate-income borrowers or to CRA-qualifying neighborhoods. Figure 6 shows thepercentage of loans originated to low- or moderate income or borrowers or for purchase of a property in aCRA-qualifying (low- or moderate-income or distressed/underserved) Census tract, annually by loan type andinstitution category, during 2000 through 2017. Panel A displays the annual percentage originated to theseborrowers or neighborhoods among all home purchase mortgages (FHA, conventional conforming, and jumbo).Panels B, C, and D, respectively, show the annual percentages originated to these borrowers or neighborhoodsfor conventional conforming plus FHA, conventional conforming only, and FHA only.As seen in Figure 6, since 2006, community banks have had a relatively high percentage of their conventionalconforming loans originated to low- or moderate-income borrowers or in CRA-qualifying Census tracts.Moreover, the percentage of conventional conforming plus FHA loans originated to low- or moderate-incomeborrowers or to CRA-qualifying Census tracts by community banks in recent years (since 2015) is about thesame as in the early 2000’s (about 35 percent).11Since 2013, the percentage of conventional conforming mortgages originated to low- or moderate-incomeborrowers or in CRA-qualifying Census tracts, overall and within each lender category, has been trending up.For all lenders combined, the percentage of conventional conforming plus FHA mortgages originated to low- ormoderate-income borrowers or in CRA-qualifying Census tracts in recent years (since 2015) is only marginallyless than in the early 2000’s (about 38 versus 36 percent.)These observations are consistent with a continuing role of the CRA in buffering the impact of relatively tightcredit standards and rising home prices on access to affordable home purchase financing. These facts suggestthat, despite the declining market share of banking institutions relative to nonbanks, the CRA continues to havean impact in encouraging banking institutions to lend to borrowers home purchases in low- and moderateincome neighborhoods.Affordability relationships. We have speculated that declining affordability of homes may be a significant factorcontributing to observed declines in lending to low- and moderate-income borrowers despite the relativeconstancy of lending to low-and-moderate-income neighborhoods. In an attempt to shed some light on thisissue, we repeat the preceding analysis distinguishing between states that experienced “low” and “high” rates ofhouse price appreciation over the (post-downturn) period of 2012 through 2017.These are defined, respectively, as states in the bottom and top 25th percentiles of the distribution of 20122017 state-level appreciation rates; they represent areas that remained relatively affordable versus thosewhere affordability eroded over that period. For the sake of brevity, we confine our attention to conventionalconforming and FHA loans, grouped together, and show in Figure 7: (1) the percentage of these loans originatedto low- or moderate-income borrowers, (2) the percentage of loans originated in CRA-qualifying Census tracts,and (3) the percentage of loans to either low- or moderate-income borrowers or CRA-qualifying tracts, bylender category.The resulting comparisons, shown in Figure 7, appear consistent with an impact of affordability on compositionof borrowing. The percentages of loans originated to low- or moderate-income borrowers have declinedsince 2009 more sharply in the areas that experienced high price appreciation during 2012-2017. However,the percentage of loans to CRA-qualifying census tracts rose during this time, and increases were somewhatgreater in high-appreciation areas for large banks and nonbanks. In recent years, overall CRA-eligible lending,shown in the bottom set of charts in Figure 7, is marginally lower in high-appreciation areas and marginally
Penn IUR Working Paper Is the CRA Still Relevant to Mortgage Lending? 9higher in low-appreciation areas in comparison to the pre-2004 benchmark period. We noted above (basedon Figure 6) that since 2013, the percentage of conventional conforming mortgages originated to low- ormoderate-income borrowers or financing home purchases in CRA-qualifying Census tracts has been trendingup. A natural question is whether this trend reflects an increasing percentage of loans in CRA-qualifying Censustracts being originated to higher income borrowers, which may be seen as less consistent with the originalintent of the CRA.Figure 8 shows the composition of borrowers financing prop
The volume of mortgage lending by banks decreased from 3 million loans in 2000 to 1.5 million in 2017, while nonbank loans increased from 1.5 to 2 million loans. Overall lending has substantially decreased, particularly for conforming-sized conventional mortgages, as FHA loan volume