Transcription
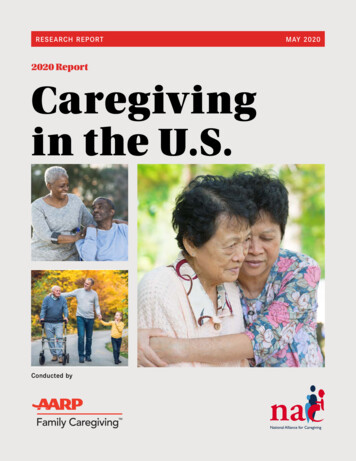
RESEARCH REPORT2020 ReportCaregivingin the U.S.Conducted byMAY 2020
Bottom left cover photo courtesy of Mediteraneo/stock.adobe.com.
AcknowledgmentsThe National Alliance for Caregiving (NAC) and AARP are proud to present Caregiving in the U.S. 2020.Many people played important roles throughout the research process, including:C. Grace Whiting, JD, President and Chief Executive Susan Reinhard, PhD, Senior Vice PresidentOfficer, National Alliance for Caregivingand Director, AARP Public Policy InstitutePatrice A. Heinz, Vice President, Strategy &Operations, National Alliance for CaregivingLynn Friss Feinberg, MSW, Senior StrategicPolicy Advisor, AARP Public Policy InstituteGabriela Prudencio, MBA, Hunt Research Director,National Alliance for CaregivingLaura Skufca, MA, Senior Research Advisor,AARPMichael R. Wittke, BSW, MPA, Senior Director,Robert Stephen, MBA, Vice President, HealthPublic Policy and Advocacy, National Alliance for& Caregiving, AARP ProgramsCaregivingRita Choula, MA, Director, Caregiving Projects,AARP Public Policy InstituteADVISORY PANELMaría P. Aranda, PhD, Associate Professor and Executive Director, USC Edward R. Roybal Instituteon Aging, USC Suzanne Dworak-Peck School of Social WorkJoseph E. Gaugler, PhD, Robert L. Kane Endowed Chair in Long-Term Care and Aging and Professor,School of Public Health, University of MinnesotaCarol Levine, MA, Senior Fellow, United Hospital Fund, New York City (former Director of UHFFamilies and Health Care Project)Feylyn Lewis, PhD, Research Fellow, University of SussexDavid Lindeman, PhD, Director Health, Center for Information Technology Research in the Interestof Society (CITRIS), UC Berkeley; Director, Center for Technology and Aging (CTA)Nancy E. Lundebjerg, MPA, Chief Executive Officer, American Geriatrics SocietySteve Schwab, CEO, Elizabeth Dole Foundation (with special thanks to Laurel Rodewald)Regina A. Shih, PhD, Senior Policy Researcher, RAND CorporationThe research was conducted by Greenwald & Associates with study direction by Lisa Weber-Raley,Senior Vice President, and project support from Karina Haggerty, Rashanda McLaurin, and ChristinaBaydaline. (www.greenwaldresearch.com)This research was made possible through generous sponsorship from:AARPBest Buy Health Inc. d/b/a GreatCallEMD Serono Inc.Home Instead Senior Care TechWerksThe Gordon and Betty Moore FoundationThe John A. Hartford FoundationTransamerica InstituteUnitedHealthcare(c) 2020 NAC and AARPReprinting with permissionCAREGIVING IN THE U.S. 2020i
iiCAREGIVING IN THE U.S. 2020
Table of ContentsACKNOWLEDGMENTS.iAdvisory Panel.iI. INTRODUCTION. 1Overview of Methodology. 1Reading This Report.3II. EXECUTIVE SUMMARY.4III. DETAILED FINDINGS.9A. Prevalence of Caregiving.9B. Basics of the Caregiving Situation.10C. Care Recipient Living Situation.21D. Care Recipient’s Condition. 24E. Caregiving Activities and Level of Care. 30F. Presence of Other Help.41G. Well-Being of Caregivers. 47H. The Financial Situation of Caregivers. 56I. Impact of Caregiving on Work. 62J. Services, Support, and Information .71K. Technology . 82L. Long-Range Planning . 86M. Respondent Profile . 89FiguresFigure 1.Figure 2.Figure 3.Figure 4.Figure 5.Figure 6.Figure 7.Figure 8.Figure 9.Figure 10.Figure 11.Figure 12.Figure 13.Figure 14.Figure 15.Figure 16.Figure 17.Prevalence of Caregiving by Age of Care Recipient, 2020 Compared to 2015.4Estimates of Population Prevalence by Age of Recipient.9Caregiver Age.10Caregiver Gender. 11Percentage of Caregivers of Adults Who Are in Each Generation, 2020 vs. 2015. 11Current Versus Past Care.12Number of Care Recipients.12Percentage Caring for Two or More Adults, by Caregiver Age. 13Gender of Care Recipient. 13Care Recipient Age.14Care Recipient Generation.14Age of Main Care Recipient by Age of Caregiver. 15Care Recipient Relation to Caregiver.16Care Recipient Relation to Caregiver by Caregiver Age. 17Duration of Care.18Choice in Taking on Caregiver Role.19Care Recipient Living Alone.21CAREGIVING IN THE U.S. 2020iii
Figure 18.Figure 19.Figure 20.Figure 21.Figure 22.Figure 23.Figure 24.Figure 25.Figure 26.Figure 27.Figure 28.Figure 29.Figure 30.Figure 31.Figure 32.Figure 33.Figure 34.Figure 35.Figure 36.Figure 37.Figure 38.Figure 39.Figure 40.Figure 41.Figure 42.Figure 43.Figure 44.Figure 45.Figure 46.Figure 47.Figure 48.Figure 49.Figure 50.Figure 51.Figure 52.Figure 53.Figure 54.Figure 55.Figure 56.Figure 57.ivCaregiver Distance from Care Recipient.21Where Care Recipient Lives. 22Where Care Recipient Lives by Relation to Caregiver. 23Frequency of Caregiver Visits. 23Types of Care Recipient Conditions. 24Types of Care Recipient Conditions by Care Recipient Age. 25Types of Care Recipient Conditions by Caregiver Tenure. 25Care Recipient’s Main Problem or Illness. 27Selected Main Problem or Illness by Care Recipient Age. 28Presence of Alzheimer’s or Dementia. 28Frequency of Care Recipient Hospitalization. 29Hours of Care Provided. 30Help with Activities of Daily Living (ADLs).31Difficulty of Helping with ADLs. 32Help with Instrumental Activities of Daily Living (IADLs). 33Time Spent on Managing Recipient’s Finances. 34Help with Other Key Activities. 35Help with Other Key Activities by Caregiver–Care Recipient Relationship. 37Assistance with Medical/Nursing Tasks. 37Ease of Coordinating Care. 38Level of Care Index. 40Components of Level of Care Index by Intensity Category. 40Presence of Other Unpaid Caregivers.41Primary Caregiver Status. 42Caregivers who are Children.43Children Providing Care, Children in Household, and Co-Residence with Recipient byCaregiver Generation. 44Use of Paid Help. 44Combination of Paid or Unpaid Help. 45Caregiving Situation by Presence of Paid and Unpaid Help. 46Caregiver Self-Rated Health. 47Self-Rated Health Status of Caregivers Compared to General U.S. Adult Population. 47Caregiver Health Changes. 49Difficulty Caring for Own Health. 50Caregiver Well-Being by Difficulty Taking Care of Health.51Physical Strain of Caregiving. 52Emotional Stress of Caregiving. 53Feeling Alone. 54Sense of Purpose. 55Financial Strain of Caregiving. 56Top Financial Impacts as a Result of Caregiving. 57CAREGIVING IN THE U.S. 2020
Figure 58.Figure 59.Figure 60.Figure 61.Figure 62.Figure 63.Figure 64.Figure 65.Figure 66.Figure 67.Figure 68.Figure 69.Figure 70.Figure 71.Figure 72.Figure 73.Figure 74.Figure 75.Figure 76.Figure 77.Figure 78.Figure 79.Figure 80.Figure 81.Figure 82.Figure 83.Figure 84.Figure 85.Figure 86.Figure 87.Figure 88.Figure 89.Financial Impacts as a Result of Caregiving by Caregiver’s Household Income. 58Financial Impacts as a Result of Caregiving by Caregiver Age. 59Financial Impacts by Age of Care Recipient. 59Mean Financial Impacts by Race/Ethnicity of Caregiver and Caregiver HouseholdIncome. 60Financial Impacts by Caregiver-Perceived Financial Strain.61Working while Caregiving. 62Hours Worked Among Employed Caregivers. 62Work, Financial Impacts, and Age by Relationship of Caregiver and Recipient. 63Supervisor Knowledge of Caregiver’s Role. 65Workplace Benefits for Caregivers. 66Workplace Benefits by Hours Worked Per Week. 67Work Impacts as a Result of Caregiving. 68Employment in Past while Caregiving. 69Reasons Caregivers Stopped Working. 70Affordability of Services in Recipient’s Area.71Financial Help for Recipient. 72Caregiver Training and Information Needs. 73Sources of Help or Information used by Caregivers. 75Conversations with Health Care Providers. 76Discussions with Care Professionals by Level of Care Index (Intensity) and Hoursof Care. 78Respite Services. 79Use of Caregiver Support Services. 80Policy Proposals for Caregiver Support.81Software and Monitoring Solutions. 82Caregiver Use of Online Solutions. 84Expectations of Future Caregiving Role. 86Expectations of Future Caregiving Role by Caregiver Generation. 86Long-Range Planning. 87Percent with Long-Term Plans in Place by Financial Strain of Caregiver. 88Demographic Summary of Caregivers of Adults, 2020 and 2015. 89Demographic Summary—All Caregivers and by Race/Ethnicity. 92Demographic Summary by Care Recipient Age. 95CAREGIVING IN THE U.S. 2020v
viCAREGIVING IN THE U.S. 2020
I. IntroductionThis study presents a portrait of unpaid family caregivers1 today. The National Alliance for Caregiving(NAC) and AARP are proud to present Caregiving in the U.S. 2020, based on data collected in 2019.A national profile of family caregivers first emerged from the 1997 Caregiving in the U.S. study. Relatedstudies were conducted in 2004, 2009, and 2015 by NAC in collaboration with AARP. This studybuilds on those prior efforts and replicates the new methodology implemented in 2015, allowing forexamination of changes to caregiving since the last data collection effort in 2015.The core areas we examined in this study include the following: The prevalence of caregivers in the United States Demographic characteristics of caregivers and care recipients The caregiver’s situation in terms of the nature of caregiving activities, the intensity andduration of care, the health conditions and living situation of the person to whom care isprovided, and other unpaid and paid help provided How caregiving affects caregiver stress, strain, and health Financial impact on caregivers Impacts on and supports provided to working caregivers Information needs and resources Technology and role of online supportsBecause adult caregivers’ circumstances can vary markedly depending on the age of their carerecipient, NAC and AARP will be publishing two companion reports in the coming months thatseparately explore the experiences of caregivers whose recipient is (a) age 18 to 49, with trendcomparisons to the 2015 study; and (b) age 50 or older, with trend comparisons to the 2015 study.OVERVIEW OF METHODOLOGYThis report is based on nationally representative quantitative online surveys with 1,392 caregivers ages18 and older. Caregivers of adults are defined as those who provide unpaid care, as described in thefollowing question:At any time in the last 12 months, has anyone in your household provided unpaid careto a relative or friend 18 years or older to help them take care of themselves? This mayinclude helping with personal needs or household chores. It might be managing a person’sfinances, arranging for outside services, or visiting regularly to see how they are doing.This adult need not live with you.1Family caregivers are not exclusively related to the person they are providing care to; they include any adult who providesunpaid care or support to a family member or friend.CAREGIVING IN THE U.S. 20201
Additionally, the study asked respondents if they had provided care to a child with special needs in thepast year, as described in the following question2:In the last 12 months, has anyone in your household provided unpaid care to any childunder the age of 18 because of a medical, behavioral, or other condition or disability?This kind of unpaid care is more than the normal care required for a child of that age.This could include care for an ongoing medical condition, a serious short-term condition,emotional or behavioral problems, or developmental problems.While caregivers of someone of any age were eligible to complete the full online survey, this reportsummarizes the findings for those caring for an adult only. Results from the screening question aboutcaring for a child with special needs were included in the prevalence estimates only. A special reporton family caregivers of children with special needs will be published in a forthcoming report. Thequestionnaire was designed to replicate many of the questions posed in the 1997, 2004, 2009, and 2015NAC/AARP Caregiving in the U.S. studies, as well as to explore new areas. The full questionnaires, forboth web and phone administration, are presented in appendix A to this report.Caregiving in the U.S. 2020 utilized Ipsos’ (formerly Gfk) national, probability-based, onlineKnowledgePanel as was used in the 2015 wave. For more information about KnowledgePanel , seeappendix B to this report. Online surveys were conducted with a random sample of 1,320 caregivers.To supplement this random sample, 179 additional online surveys were conducted via targetedsampling of racial/ethnic groups, yielding the 1,499 base study, full online surveys with caregivers3(by race/ethnicity: 858 non-Hispanic White caregivers, 215 non-Hispanic African American caregivers,222 Hispanic caregivers, 130 Asian American caregivers,4 and 74 caregivers of another race/ethnicity).In addition to the 1,499 caregivers in the base study, the study included an oversample of 160 oldercaregivers ages 75 and older. Further, 80 Asian American caregivers were surveyed via telephone(73 landline and 7 cell phone) to bring the total Asian American subsample to 210 caregivers (197caring for an adult and 13 caring for a child only).Online respondents were given the option of conducting the survey in Spanish or English, and31 percent of Hispanic respondents chose the Spanish version. The median length of the survey was19.5 minutes online and 34.1 minutes via telephone. The surveys were conducted between May 29,2019, and July 27, 2019.All the data gathered from the screeners were used to estimate prevalence—the proportion ofcaregiving individuals and households in the United States (shown in appendix B).All fully screened respondents—regardless of caregiver status—were weighted by the individual’s age,sex, and race/ethnicity to population estimates from the IPUMS public-use data file of the March 2019Current Population Survey, conducted by the U.S. Census Bureau.The margin of error for the overall 2020 results is plus or minus approximately 2.5 percentage pointsat the 95 percent confidence level. This means that 95 times out of 100, a difference of greater thanroughly 2.5 percentage points would not have occurred by chance. For subgroups of caregivers, themargin of error is larger. All details of the methodology are included in appendix B to this report. For acomparison of 2015 and 2020 results for caregivers of adults, see appendix C to this report.2These two questions used to identify caregivers are the same questions used in Caregiving in the U.S. 2015. These questionswere also used in the 2009 study with minor wording edits made in 2015 to make them suitable for online self-administration.3For additional details about sampling, including oversamples, see appendix B, Detailed Methodology.4Asian American is defined to align with the U.S. Census and is inclusive of those of origin, background, or descent of areas ofSoutheast Asia, Indian subcontinent, and east Asia, as well as the Pacific Islands.2CAREGIVING IN THE U.S. 2020
READING THIS REPORTThis report is based on a nationally representative quantitative online survey with 1,392 caregiversages 18 and older who cared for an adult in the 12 months prior to the time of the survey. The samplesizes shown throughout represent the unweighted number of people who answered each question. Allsubstantive results (means, medians, percentages) have been weighted and rounded.To signal statistically significant differences between subgroup findings, the report uses an asterisk tohighlight any numerical result that is significantly higher than the comparison group, at the 95 percentconfidence level. When more than two groups are being compared in columns of a table, a superscriptletter next to a numerical result indicates it is significantly higher (at the 95 percent confidence level)than the numerical result in the column designated by that letter.In the graphics, significant increases or decreases are displayed as the percentage point change from2015 to 2020 along with a graphic up or down arrow.All substantive results (means, medians, percentages) have been weighted and rounded. In addition,“don’t know” or “refused” responses are not always presented in figures. For these reasons, data insome figures will not add to 100 percent. The results for multiple response questions may also add togreater than 100 percent.CAREGIVING IN THE U.S. 20203
II. Executive SummaryFamily and friends comprise the most basic unit of any society. For individuals who take on theresponsibility of caring for another person through sickness or disability, it can often be challengingto see beyond the individual experience. Yet in the aggregate, family caregivers—whether they befamilies of kin or families of choice—are woven into the fabric of America’s health, social, economic,and long-term services and supports (LTSS) systems. As the country continues to age, the need tosupport caregivers as the cornerstone of society will only become more and more important.Today, more than 1 in 5 Americans (21.3 percent) are caregivers, having provided care to an adult orchild with special needs at some time in the past 12 months. This totals an estimated 53.0 millionadults in the United States, up from the estimated 43.5 million caregivers in 2015.5When looking at caregivers for adults only, the prevalence of caregiving has risen from 16.6 percent in2015 to 19.2 percent in 2020—an increase of over 8 million adults providing care to a family memberor friend age 18 or older, primarily driven by a significant increase in the prevalence of caring for afamily member or friend who is age 50 or older. Figure 1 shows the prevalence rate, estimated numberof caregivers in the United States, and change in the past five years.Figure 1. Prevalence of Caregiving by Age of Care Recipient, 2020 Compared to 2015OverallCaregivers of recipients ages 0–17*Caregivers of recipients ages 18 Caregivers of recipients ages 18–49Caregivers of recipients ages 50 2020PrevalenceEstimatedNumber ofU.S. AdultsWho AreCaregivers2015PrevalenceEstimatedNumber ofU.S. AdultsWho AreCaregivers21.3%*53.0 million18.2%43.5 million14.1 million4.3%10.2 million19.2%5.7%*47.9 million16.6%39.8 million2.5%*16.8%6.1 million41.8 million2.3%14.3%5.6 million34.2 million* Significantly higher than in 2015.Compared to 2015, a greater proportion of caregivers of adults are providing care to multiple peoplenow, with 24 percent caring for two or more recipients (up from 18 percent in 2015). This finding, incombination with the increased prevalence of caregiving, suggests a nation of Americans who continueto step up to provide unpaid care to family, friends, and neighbors who might need assistance due tohealth or functional needs. This increase in prevalence may be due to any of the following: The increasingly aging baby boomer population requiring more care Limitations or workforce shortages in the health care or long-term services and supports (LTSS)formal care systems Increased efforts by states to facilitate home- and community-based services Increasing numbers of Americans who are self-identifying that their daily activities, in supportof their family members and friends with health or functional limitations, are caregiving The confluence of all of these trends54As with previous Caregiving in the U.S. studies, prevalence estimates include those who have provided care in the 12 monthsbefore the time they were surveyed, whether they were a caregiver at the time of survey or had been a caregiver in the prior12 months but no longer were. With the margin of error, the estim
CAREGIVING IN THE U.S. 2020 1 I. Introduction This study presents a portrait of unpaid family caregivers1 today. The National Alliance for Caregiving (NAC) and AARP are proud to present Caregiving in the U.S. 2020, based on data collected in 2019.


