Transcription
A TERNER CENTER REPORT - MARCH 2020The Hard Costsof Construction:Recent Trends in Laborand Materials Costsfor Apartment Buildingsin CaliforniaAUTHORS:HAYLEY RAETZTEDDY FORSCHERELIZABETH KNEEBONECAROLINA REIDCopyright 2020 Terner Center for Housing InnovationFor more information on the Terner Center, see our website atwww.ternercenter.berkeley.edu
A TERNER CENTER REPORT - MARCH 2020Executive SummaryAgainst the backdrop of a statewidehousing crisis, affordable and marketrate developers have seen increasing development costs, which can hinder the feasibilityof new projects and contribute to affordabilityconstraints. The rising cost of building housingis fueled by multiple factors, including land,capital costs, regulations, materials, and labor.In this report, we focus on the subset of thesecosts that have seen some of the largest escalations in recent years: materials and labor, alsoreferred to as hard construction costs. Hardconstruction costs comprise more than sixtypercent of total development costs. Yet understanding what goes into hard costs is difficultdue to the lack of publicly-available, detaileddata on specific projects.To shed light on the drivers of hard construction costs, we compiled and analyzed a uniquenew dataset of line-item level constructioncosts for 240 multifamily projects built inCalifornia between 2009 and 2018. We find: The per-square-foot hard costs forconstructing multifamily housing inCalifornia climbed 25 percent overthe course of a decade.On average, hard costs per square foot in2018 were 44 higher compared to 20082009, after adjusting for inflation. Cost increases have been mostpronounced in the line-item categories for finishes and for wood, plastics, and composites.Detailed data shows that since 2010, wood,plastics, and composites costs rose by 110percent after accounting for inflation, andfinishes costs rose by 65 percent. Trends in both labor and materialshave likely contributed to hardcost increases, but do not entirelyaccount for the pace of change.Controlling for key factors, our regressionanalysis found that projects that beganconstruction between 2016 and 2018 were,on average, 68 more expensive per squarefoot than projects started between 2009and 2011. It’s more expensive to build in theBay Area and Los Angeles.Controlling for project characteristics,compared to the rest of the state, averagehard costs were 35 more expensive persquare foot in the Los Angeles region and 81 more expensive per square foot in theBay Area. The Bay Area has comparativelyhigher construction wages than elsewherein California, which could help to explainthe difference in hard costs at the regionallevel. While we were unable to control forthe effects of local regulations, these toocould be adding to regional variations inconstruction costs. Building with concrete and steelcosts more.Type I construction (mainly composed ofconcrete and steel) is significantly moreexpensive than other construction types.This in turn means that these high-risebuildings are more likely to be financiallyfeasible in markets with high rents. Affordable housing projects costmore on average than market-rateand mixed-affordability projects,but this difference loses significanceafter controlling for project size.Controlling for observable cost drivers,affordable projects cost on average 48more per square foot than market-rate2
A TERNER CENTER REPORT - MARCH 2020projects or projects that mix affordable andmarket-rate units. The significance of thisdifference disappears when controlling forthe size of the project. While more data areneeded to tease out the implications of thisfinding, it suggests that market-rate developers are more likely to realize efficienciesof scale than affordable housing developersbecause they tend to build larger buildings. Prevailing wage requirements areassociated with higher hard costs.Our analysis joins a body of evidence thatfinds a significant relationship betweenprevailing wage requirements and highercosts. However, it should be noted thatprevailing wage requirements are a policychoice designed to provide public benefitby stabilizing employment and benefits ina high-risk field; those broader benefitswould not be captured in an analysis ofhard construction data.Overall, our findings point to the importanceof policies that can help to mitigate risingconstruction costs. Streamlining and bringingmore certainty to the permitting and approvalprocesses can mitigate labor and materialscost increases, as well as having the addedbenefit of bringing down pre-construction andcontingency costs. Reviewing regulations andbuilding codes for inefficiencies can also reinin escalating hard costs. Innovative construction techniques that aim to lower costs andincrease efficiency—such as industrial andmass timber construction—could benefit fromadditional state and local support, as couldtraining programs that create a pipeline fortalent in the construction industry.IntroductionThe cost of development is often cited asa fundamental obstacle to building morehousing in California, especially housing thatis affordable to low- and moderate-incomehouseholds.1 As the costs to build go up, therents for those units go up as well. If the costsbecome too great, rising construction costscan make a project financially infeasible.For example, a multifamily unit that costs 800,000 to build will need to chargeapproximately 4,000 in monthly rent2—aprice well over the typical monthly earnings inthe state —to cover those costs and meet returnon investment requirements for investors.Many different factors layer together to affectthe bottom-line costs of building new housingand whether or not a project will ultimately“pencil”: the costs of acquisition (e.g., landand closing costs), hard construction costs(e.g., materials and labor), soft costs (e.g.,legal and professional fees, insurance, anddevelopment fees), and the costs of conversiononce a project is completed (e.g., title fees andthe operating deficit reserve). Among thesevarious components of a project’s total “coststack,” by far the largest share of a project’stotal cost comes from materials and labor—orhard costs.Given the significant role hard costs playin determining the financial feasibility ofnew housing construction, this analysisfocuses on recent trends in materials andlabor costs and what might explain them. Tobetter understand these costs components,we collected data from developers, generalcontractors, and financial institutions for bothmarket and affordable multifamily housingdevelopments that began constructionbetween 2008 and 2018. We created a uniquedataset of more than 240 projects throughoutthe state of California, which includesinformation on estimated constructioncosts, final construction costs, construction3
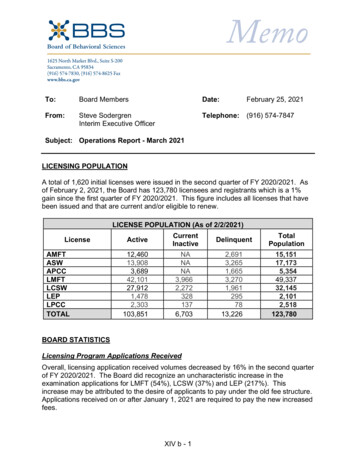
A TERNER CENTER REPORT - MARCH 2020This report is part of the Terner Center’s The Cost of Building Housing Research Series,which examines the different cost factors that layer together to comprise the totalcosts to build housing in California. Accompanying this report, we have also releasedThe Costs of Affordable Housing Production: Insights from California’s 9% Low-IncomeHousing Tax Credit Program, which looks specifically at the factors influencing thecosts of development for new construction financed through the 9% LIHTC programs.Previous studies include Making It Pencil: The Math Behind Housing Development, inwhich we outline how land costs, construction costs, local fees, and financing costs allcontribute to the total development cost for a housing project. In our work on impactfees and development fees, we found that waning tax revenue and the loss of state andfederal funding for infrastructure resulted in rising local exactions on new housing. Andin Perspectives: Practitioners Weigh in on Drivers of Rising Housing Construction Costsin San Francisco, we examined the ways in which lengthy permitting processes as wellas local regulations and requirements can increase the cost of both market-rate andaffordable housing projects.schedules, and project characteristics (such assize, location, etc.). While other data sourcesprovide insight into broad changes in costs inthe form of price indices, or consolidate datato inform cost estimation, our data allow us toreview line item costs directly. Our data offer arare and detailed window into specific factorsunderlying the hard costs of construction forindividual projects. With these data, we areable to trace how hard costs have changedover time, as well as understand which typesof costs have seen the steepest increases. Thefollowing analysis unpacks these factors andconsiders state-level approaches to mitigatethe rising cost of construction, with the aimof producing more market-rate and affordablehousing at lower price points.schedules, and project characteristics (suchas size, location, etc.). Responses typicallycame in the form of original project bids, finalcost sheets, and final construction schedules.We also collected additional details on eachproject through a survey completed by theresponding organizations. We then digitizedPDFs or scanned documents, cleaned, andstandardized responses to create a uniquedatabase (the “Terner dataset”) of morethan 240 multifamily projects constructedthroughout the state of California.3 Given thefocus of this analysis, the sample only includesdata on hard construction costs, and not onother factors considered elsewhere in the Costof Building Housing Research Series, such asland, financing, and contingency costs.MethodologyDefining Construction CostsDetailed data on hard construction costs—also referred to in this analysis as simply“construction costs”—are not publicly available or easily accessible. We reached out todozens of market-rate and affordable housingdevelopers, general contractors, and financial institutions to request data on housingprojects started between 2008 and 2018,including data on estimated constructioncosts, final construction costs, constructionAccording to the data we collected on totalproject costs, hard construction costs represented more than 60 percent of the total costof producing a new residential building inCalifornia over the past decade.4This analysis reports on bid costs, orestimated project costs, rather than the finalconstruction costs for projects. While this mayunderestimate final costs, the data from bidsheets were more complete. These bids are4
A TERNER CENTER REPORT - MARCH 2020also what are used to determine the amount ofsubsidy that is needed for affordable projects.To consider the cost of materials and labor atthe time of the bid, our analysis categorizesprojects based on the year construction began,rather than the date of completion.The developers and general contractors thatprovided data for this project track theirline item level costs differently, parsingcosts at varying levels of detail. In order tostandardize our analysis across a variety ofline item categories, we coded each line itemaccording to its Construction SpecificationsInstitute MasterFormat division,5 a standardcommonly used in U.S. construction (alsoreferred to in this analysis as CSI divisionsor codes). The line items were coded basedon keywords, and any remaining line itemswere coded by hand before the dataset wasreviewed a second time to ensure fidelity tothe MasterFormat divisions. In a few cases,project line items were broad enough that theyincorporated multiple divisions; in those caseswe removed the overly broad costs from theline item level analysis, but included the costswhen assessing total hard construction costs.Key Characteristics of Projects in theTerner DatasetAmong the projects included in the Ternerdataset, 79 percent are affordable developments, while market-rate and mixed-affordability projects make up 11 and 10 percent ofthe dataset, respectively (Figure 2). “Mixed”projects, or projects that contain a mix ofaffordable and market-rate units, tilt heavilytowards market-rate: in the typical mixedproject, 14 percent of units are affordable.Most projects in our sample are primarilywood construction—39 percent of the projects are type V (i.e., wood construction), while11 percent are type V over I (i.e., wood over aconcrete podium, which is typically a parkingstructure). Only 6 percent of the projects aretype I, or tower construction (i.e., steel andconcrete high-rises). Just over one-third ofprojects (36 percent) did not include data onthe construction type. Almost half of the projects in our sample (49 percent) are non-prevailing wage projects, 42 percent adhere toprevailing wage regulations, and9 percent did83.2%not report their prevailing wage status.Figure 1: Total Development Costs for Multifamily Projects in California (Completed 2010-2019)5
A TERNER CENTER REPORT - MARCH 2020Figure 2: Characteristics of Projects in the Terner DatasetFigure 3: Regions for Cost Analysis6
A TERNER CENTER REPORT - MARCH 2020In order to assess regional differences incosts while maintaining the anonymity ofrespondents, we compared the costs of projectsbuilt in the two largest urban centers—theBay Area and Los Angeles regions—to thosebuilt in the rest of the state (Figure 3). Fiftypercent of the projects are located within theSan Jose-San Francisco-Oakland CombinedStatistical Area (CSA), while 33 percent ofprojects are in the Los Angeles-Long BeachCSA. The remaining 17 percent of the projectsare located in the rest of the state.One challenge in understanding differences inconstruction costs is that different locations,and/or building types, will influence costs. Toaccount for these differences, we present theresults of a series of multivariate regressionmodels that allow us to control for these differences. This approach allows us to examine theindependent association of different projectcharacteristics—such as construction type,region, or the year construction started—onoverall construction costs.Line Item Data onRising Construction CostsThe per-square-foot hard costs forconstructing multifamily projects inCalifornia climbed 25 percent over thecourse of a decade.The Terner dataset confirms what constructionprofessionals have reported for years:realconstruction costs have risen since therecession. A weighted average of hard costsper project square foot, adjusted to 2018dollars, shows that costs have increased acrossthe state (Figure 4).In 2008-2009, hard costs averaged 177 persquare foot. By 2018 that average had risen to 222 per square foot—a 25 percent increase.While these increases have been felt across thestate, costs are highest—and their increaseshave been most precipitous—in the Bay Area(see Case Study on page 15).Figure 4: Hard Construction Cost Per Square Foot, California (2018 )7
A TERNER CENTER REPORT - MARCH 2020The cost increases captured in the Ternerdataset align with other industry measures ofconstruction costs. The California Construction Cost index, for example, recorded a 24percent change in costs between 2009 and2018.6 Because prices declined following therecession, increases in recent years have registered as much steeper, given that they startedfrom a lower base.7 Between 2014 and 2018,hard construction costs in California rosealmost 80 per square foot, or 44 percent.Evidence suggests the trend has not abatedsince 2018. The California Construction CostIndex increased by 3.6 percent in 2019, thehighest increase since a 4.4 percent increasein 2016.8Cost increases have been mostpronounced in the line-item categoriesfor wood, plastics, and composites andfor finishes.On any construction project, the largestcontributors to hard costs include thefollowing MasterFormat divisions: a) metals,b) concrete, c) finishes, and d) wood, plasticsand composites. Metals costs include metalframing, joists, decking, stairs, and railings,among others. Concrete costs cover concreteforming and accessories, concrete reinforcing,cast-in-place concrete, precast concrete, castdecks and underlayment, mass concrete, andconcrete cutting and boring. Finishes costsconsist of plaster and gypsum board, tiling,ceilings, flooring, wall finishes, painting andcoating, among others. Finally, wood, plastics,and composites costs include rough carpentry,finish carpentry, architectural woodwork,structural plastics and composites, and plasticfabrications such as railings and paneling. 9Figure 5 documents the trends for each ofthese line items in the Terner dataset.Adjusting for inflation, metal costs haveremained relatively stable over time, averagingbetween 5 and 10 per square foot. Concrete,while significantly higher than in 2014, is onlyslightly more expensive per square foot thanit was in 2008. In contrast, by far the biggestFigure 5: Line Item Construction Costs (2008-2018)8
A TERNER CENTER REPORT - MARCH 2020increases have occurred in line-item costs forwood, plastics, and composites, which roughlydoubled between 2014 and 2018. These trendsremain the same when the sample is isolatedto type V—or primarily wood construction—projects, implying the change in line item costsis not driven by changes in construction typeover time. Line-item costs for finishes havealso climbed well above 2008-levels. It couldbe that higher construction costs and a hotterhousing market have increased spending onfiner floor coverings and other finishes to buildout more expensive units and meet the expectations of a higher rental or sale price point.Trends in both labor and materialshave contributed to hard cost increases,but do not entirely account for the paceof change.While we can see which areas have experiencedthe greatest increases in overall costs, it is notpossible to completely disentangle which ofthese costs are driven by materials and whichare driven by labor. General contractors anddevelopers typically only track bundled laborand materials costs at the line item level;for example, they might record the cost ofearthwork, but not the overhead for theearthwork subcontractor, or the cost of laborto dig a foundation.In order to assess the relative role of laborversus materials costs, we compared thechanges in line item costs from the TernerCenter dataset to publicly available data onmaterials cost indices and wage rates at thestate level.Wage and Employment TrendsA review of construction wages in California reveals that, while wages have risen innominal terms, when adjusted for inflation,wages in key construction occupations (thoseclosely associated with the four MasterFormatdivisions reviewed above) are generally closeto 2006 levels, at the height of the previousbuilding boom. In nominal terms, wages forall construction and extraction occupations inCalifornia rose by 29 percent between 2006and 2018, and by 13 percent since 2010, belowthe statewide increase in hard costs of 25percent. In real terms, however, wages haveonly risen by just 3.4% since 2006.These averages, however, hide the tightnessin the construction labor market in someareas. Since the recession, there has been asignificant mismatch between the numberof permitted units—increasing more than430 percent between 2009 and 2018—andthe growth in the construction sector, wherethe number of workers has only expanded by32 percent. General contractors noted thatanti-immigration rhetoric, as well as a tightlabor market overall, has made it hard to findconstruction workers, let alone workers withmore multifamily construction experienceand/or those trained in the specific trades.Indeed, surveys of housing developers haveconsistently listed a shortage of workers asa top concern.10 For example, in responseto a 2019 survey of general contractors inCalifornia, more than 60 percent of firmsresponded that they were “having a hard timefilling some or all positions” for craft andsalaried workers, reflecting the twin challengeof a constrained labor force at the same timeas new development has increased.11Statewide employment data also revealsthat certain types of skilled labor are laggingmore than others. Employment of carpentersdropped by 30 percent between 2006 and2018, and reinforcing iron and rebar workersdeclined by 52 percent over the same period.Similarly, employment of cement masons andconcrete finishers decreased by 18 percent anddrywall and ceiling tile installers dropped by23 percent.12, 13 A survey of California generalcontractors captured the tightness in the9
A TERNER CENTER REPORT - MARCH 2020Table 1: Nominal and Real Hourly Median Wages for Selected California Construction Occupations, and PercentChange in Wages from 2006-2018 and 2010-2018California OccupationsWages(unadjustedfor inflation)Wages(adjustedfor nationalinflation)Construction& ExtractionOccupationsCarpenters2006 20.63 23.502010 23.552018CementMasons &ConcreteFinishersDrywall &Ceiling TileInstallersSheet MetalWorkersStructuralIron & SteelWorkers 19.49 21.48 20.93 25.17 25.49 23.10 23.45 26.13 26.47 26.56 27.29 25.82 26.78 25.77 31.98Percent ent Change,2010-201812.8%7.1%11.8%14.2%-1.4%20.8%2006 25.70 29.27 24.28 26.75 26.07 31.352010 27.12 29.35 26.60 27.00 30.09 30.482018 26.56 27.29 25.82 26.78 25.77 31.98Percent Change,2006-20183.4%-6.8%6.4%0.1%-1.1%2.0%Percent re 6: Multifamily Permits and Construction Employment in California (2002-2018)Sources: State of California Department of Finance, Construction Permits, Annual data, from 1975, Residential (units and valuation). Retrievedfrom: tors/Construction Permits/.; Federal Reserve Bank of St. Louis and U.S. Bureau ofLabor Statistics, All Employees: Construction: Residential Building Construction in California [SMU06000002023610001A]. Retrieved from: FRED,Federal Reserve Bank of St. Louis; 10001A. January 9, 2020.10
A TERNER CENTER REPORT - MARCH 2020labor market across a host of different typesof workers: 70 percent or more of respondentsnoted that it was harder to hire plumbersand pipelayers in 2019 than the year before,and more than 60 percent said the same forroofers, equipment operators-cranes, heavyequipment, drywall installers, sheet metalworkers, and cement masons. More than50 percent of respondents found it harderto hire concrete workers and carpenters, aswell as pipefitters/welders, mechanics, andlaborers. Perhaps reflecting the increase iniron workers, only 33 percent of respondentsnoted that the trade was more difficult to hirefor than the year previous.14Materials Cost TrendsIn order to assess the relationship betweenmaterials costs and hard cost line item trendsin California, we compared price trendsbetween key materials indices and the Ternerdataset (Table 2).Most key line items tracked closely with theircorresponding materials cost indices; finishes,concrete, and metal costs all rose in parallelwith materials costs (Table 2). In contrast,wood, plastics, and composites line item costsTable 2: Percent Change in Terner Line Item Costs andRelated Industry Indices for MaterialsPercent Change, 2010-2018Terner DataIndustry /Lumber11039Source: Terner Center analysis of U.S. Bureau of Labor Statistics data:U.S. Bureau of Labor Statistics. Producer Price Indexes. Retrievedfrom: https://www.bls.gov/ppi/.climbed at a significantly faster rate than thelumber materials index. While the materialsindex increased by 39 percent between 2010and 2018, the wood, plastics, and compositesline item costs in California housing projectsincreased by 110 percent over the same period,with costs remaining high after 2014 (Figure7). As previously noted, real wages for occupations closely associated with the line itemsreviewed all either dropped or remained relatively flat, leaving a question as to the centraldriver of increasing costs for wood, plasticsand composites.A number of factors can influence materialscosts. Some are macroeconomic forces influenced by global trade patterns and federalpolicy decisions. For instance, the NationalAssociation of Home Builders estimated thatthe tariffs imposed in 2018 on Chinese importstranslated to a 1 billion increase in residential construction costs.15 Others are shaped bystate and local policy decisions—from regulatory requirements to building codes to negotiations around the elements of specific projects—that may dictate the types of materialsused in a given project. Although such decisions affect total costs, the impact can be hardto quantify.Interviews conducted by Terner Centerresearchers suggested that general contractors and subcontractors are asking for higherlevels of overhead, profit, and contingency,in some cases to hedge against risk and costsassociated with a restricted workforce, suchas losing workers or subcontractors to moreprofitable projects in the middle of a job.While the structure of the Terner data did notallow us to review profit or contingency separately, San Francisco tied with New York Cityfor the highest contractor’s margins in anyU.S. city surveyed in the most recent Turnerand Townsend survey, at seven percent.1611
A TERNER CENTER REPORT - MARCH 2020Figure 7: Wood, Plastics, and Composites Line Item Cost Index and Producer Price Index by Commodity for Lumberand Wood Products: Lumber (Base Year 2008)Source: Terner Center analysis of Terner Center data and U.S. Bureau of Labor Statistics data: U.S. Bureau of Labor Statistics, Producer PriceIndex by Commodity for Lumber and Wood Products: Lumber [WPU081]. Retrieved from: FRED, Federal Reserve Bank of St. Louis; https://fred.stlouisfed.org/series/WPU081, January 9, 2020.Putting It All Together:The Drivers of IncreasedConstruction CostsAs materials and labor costs have gone up,it is not surprising that overall constructioncosts have also risen. One possible explanation for the higher costs is that the mix ofprojects being built has changed over time—for instance, a shift toward more high-risecondominiums that require more expensiveconstruction materials—or that more development is occurring in high-cost markets, wherelabor costs will be higher.To understand all the factors that influenceconstruction costs in tandem, we developed aregression model that allows us to assess howeach factor influences the bottom-line cost ofbuilding. Table 3 presents the results of thisanalysis, first without controlling for projectsize (model 1) and then after taking projectsize into account (model 2).The key findings are: Hardcosts of building housing inCalifornia have increased by 68 persquare foot, on average.Even accounting for other relevant factorsin the model, it is more expensive to build asimilarly-sized unit in California comparedto a decade ago. It is more expensive to build in theBay Area and Los Angeles.Controlling for key factors like construction type, prevailing wage requirements,affordability, and year construction started,12
A TERNER CENTER REPORT - MARCH 2020Table 3: Model Identifying Factors that Contribute to Per Square Foot Hard Costs, California, 2008-2018Per Square FootVariablesModel 1Model 2-0.23***Project Size (Number of Units)(0.09)Year Construction Began (Compared toProjects Started in 23.40)(29.06)Number of Observations223223R- Squared0.290.31Adjusted R-Squared0.260.28Project Started 2007-2008Project Started 2012-2015Project Started 2016-2018Type of Construction (Compared to AllOther Types)Construction Type IRegion (Compared to Los Angeles)San Jose- San Francisco-OaklandOtherProject CharacteristicsProject Is Affordable HousingProject Includes Prevailing WageConstantNotes: Standard errors in parentheses. *** p 0.01, ** p 0.05, *p 0.10.13
A TERNER CENTER REPORT - MARCH 2020urban areas showed statistically significantcost differences. Compared to projects inother parts of the state, Bay Area projectscost 81 more per square foot to build, andprojects in the Los Angeles region cost 35more per square foot. (See Case Study onpage 15 for more on Bay Area costs.) Building with steel and concrete costsmore.Type I projects, which are typically over5-7 stories and constructed with steel andconcrete, cost an average of 65 more persquare foot than other types of construction, like Type V over I (i.e., wood framefloors over a concrete platform). Type Iprojects use more expensive components inorder to build higher, and are more likelyto be found in infill locations, such as SanFrancisco or Los Angeles, where zoningallows higher density construction. Whenwe also control for the number of units in aproject (which reduces costs slightly due toeconomies of scale), the additional cost ofType 1 projects rises slightly to 71 dollarsper square foot. Affordablehousing projects costmore on average than market-rateand mixed-affordability projects,but this difference loses significanceafter controlling for project size.Controlling for year, region, constructiontype, and prevailing wage requirements,affordable projects cost, on average, 48more per square foot compared to marketrate projects and projects that mixedaffordable and market-rate units. In acompanion study, The Costs of AffordableHousing Production: Insights from California’s 9% Low-Income Housing Tax CreditProgram, we examine the drivers of costsfor affordable projects in more detail, andfind that funding complexity, includingthe associated prevailing wage and otherlocal hire requirements, is associated withhigher development costs, especially ifmultiple projects subject to labor requirements move forward simultaneously ina constrained labor market. In order tosecure local approvals, affordable housingprojects are also often subject to increaseddesign requirements. In some cases, purelyaesthetic changes required by a locality canincr
A TERNER CENTER REPORT - MARCH 2020 2 Executive Summary A gainst the backdrop of a statewide housing crisis, affordable and market-rate developers have seen increasing devel-opment costs, which can hinder the feasibility of new projects and contribute to affordability constraints. The rising cost of building housing