Transcription
Cyber SecurityBreaches Survey2021The Cyber SecurityBreaches Survey is aquantitative and qualitativestudy of UK businesses,charities and educationinstitutions. It helps theseorganisations to understandthe nature and significanceof the cyber security threatsthey face, and what othersare doing to stay secure. Italso supports thegovernment to shape futurepolicy in this area.For this latest release, thequantitative survey wascarried out in winter 2020/21and the qualitative elementin early 2021.Responsible analyst:Emma Johns07990602870Statistical enquiries:evidence@dcms.gov.uk@DCMSinsightGeneral enquiries:enquiries@dcms.gov.ukMedia enquiries:020 7211 2210
Department for Digital, Culture, Media and SportCyber Security Breaches Survey 2021: Statistical ReleaseContentsSummary. 1Chapter 1: Introduction. 41.1 Code of practice for statistics . 41.2 Background . 41.3 Methodology . 41.4 Changes since the 2020 survey . 51.5 Interpretation of findings . 51.6 Acknowledgements. 6Chapter 2: Profiling UK businesses and charities . 72.1 The digital footprint of different organisations . 72.2 Use of industrial control systems . 82.3 Use of personal devices . 92.4 Older versions of Windows . 9Chapter 3: Awareness and attitudes . 113.1 Perceived importance of cyber security . 113.2 Involvement of senior management . 133.3 Sources of information . 163.4 Cyber security priorities and drivers of change . 20Chapter 4: Approaches to cyber security . 224.1 Identifying, managing and minimising cyber risks . 224.2 Insurance against cyber security breaches. 274.3 Technical cyber security controls . 294.4 Staff training and awareness raising . 314.5 Responsibility for cyber security . 324.6 Outsourcing of cyber security functions . 324.7 Cyber security policies and other documentation . 334.8 Cyber accreditations and government initiatives . 354.9 Dealing with COVID-19. 39Chapter 5: Incidence and impact of breaches or attacks . 425.1 Identified breaches or attacks . 425.2 The breaches and attacks considered most disruptive . 455.3 Frequency of breaches or attacks . 465.4 How are businesses affected? . 475.5 Financial cost of breaches or attacks . 51Chapter 6: Dealing with breaches or attacks. 566.1 Incident response . 566.2 Reporting breaches or attacks . 576.3 Actions taken to prevent future breaches or attacks . 58Chapter 7: Conclusions . 60Annex A: Further information . 62Annex B: Guide to statistical reliability . 63
Department for Digital, Culture, Media and SportCyber Security Breaches Survey 2021: Statistical Release1SummaryThis sixth survey in the annual series continues to show that cyber security breaches are aserious threat to all types of businesses and charities. Among those identifying breaches orattacks, their frequency is undiminished, and phishing remains the most common threat vector.Four in ten businesses (39%) and a quarter of charities (26%) report having cyber securitybreaches or attacks in the last 12 months. Like previous years, this is higher among mediumbusinesses (65%), large businesses (64%) and high-income charities (51%).1This year, fewer businesses are identifying breaches or attacks than in 2020 (when it was 46%),while the charity results are unchanged. This could be the result of a reduction in trading activityfrom businesses during the pandemic, which may have inadvertently made some businessestemporarily less detectable to attackers this year.However, other quantitative and qualitative evidence from the study suggests that the risk levelis potentially higher than ever under COVID-19, and that businesses are finding it harder toadminister cyber security measures during the pandemic. For example, fewer businesses arenow deploying security monitoring tools (35%, vs. 40% last year) or undertaking any form ofuser monitoring (32% vs. 38%). Therefore, this reduction among businesses possibly suggeststhat they are simply less aware than before of the breaches and attacks their staff are facing.Among those that have identified breaches or attacks, around a quarter (27% of thesebusinesses and 23% of these charities) experience them at least once a week. The mostcommon by far are phishing attacks (for 83% and 79% respectively), followed by impersonation(for 27% and 23%). Broadly, these patterns around frequency and threat vectors are in line withthe 2020 and 2019 results.A sizeable number of organisations that identify breaches report a specific negative outcome orimpact. On average, for those that do, the costs are substantial.Among the 39 per cent of businesses and 26 per cent of charities that identify breaches orattacks, one in five (21% and 18% respectively) end up losing money, data or other assets.One-third of businesses (35%) and four in ten charities (40%) report being negatively impactedregardless, for example because they require new post-breach measures, have staff timediverted or suffer wider business disruption.These figures have shifted gradually over time – the proportions experiencing negativeoutcomes or impacts in 2021 are significantly lower than in 2019 and preceding years. This isnot due to breaches or attacks becoming less frequent, with no notable change in frequency thisyear. Instead, it may, in part, be due to more organisations implementing basic cyber securitymeasures following the introduction of the General Data Protection Regulation (GDPR) in 2018.It could also reflect other trends such as the rising use of cloud storage and backups.Nevertheless, where businesses have faced breaches with material outcomes, the average(mean) cost of all the cyber security breaches these businesses have experienced in the past12 months is estimated to be 8,460. For medium and large firms combined, this average costis higher, at 13,400. There are too few charities in the sample to report average costs in thisway, but the overall costs recorded for businesses and charities follow a similar pattern.1For businesses, analysis by size splits the population into micro businesses (1 to 9 employees), small businesses(10 to 49 employees), medium businesses (50 to 249 employees) and large businesses (250 employees or more).For charities, we look at annual income bands, with high income being 500,000 or more.
Department for Digital, Culture, Media and SportCyber Security Breaches Survey 2021: Statistical Release2Despite COVID-19 stretching many organisation’s cyber security teams to their limits, cybersecurity remains a priority for management boards. But it has not necessarily become a higherpriority under the pandemicThree-quarters (77%) of businesses say cyber security is a high priority for their directors orsenior managers, while seven in ten charities (68%) say this of their trustees. While there havebeen minor fluctuations in these findings over the past three years, cyber security remains ahigher priority compared to when we first surveyed each group (i.e. 69% in 2016 for businessesand 53% in 2018 for charities).Half of businesses (50%) and four in ten charities (40%) update their senior management teamsabout the actions taken on cyber security at least quarterly, in line with the 2020 results.However, the percentage of charities reporting that their senior managers are never updated oncyber security has increased since last year (to 23%, vs. 12% in 2020).Overwhelmingly, businesses (84%) and charities (80%) say COVID-19 has made no change tothe importance they place on cyber security. The qualitative research suggests that someorganisations have increased their investment in IT and cyber security in response to thepandemic. Many organisations adopted new security solutions, including cloud security andmulti-factor authentication, or new rules requiring VPN connections to access files.These changes were often characterised as being about business and IT service continuity.However, in some cases, interviewees felt that management boards and end users did not fullyappreciate the role of cyber security in facilitating long-term business continuity. In theimmediacy of the pandemic, cyber security measures were sometimes viewed in the short termas being in conflict with business continuity, rather than complementing it.The COVID-19 pandemic has led to significant changes in ways of working. This has madecyber security harder for many organisations.In qualitative interviews, many organisations explained that COVID-19 and the ensuing move tohome working initiated substantial changes in their digital infrastructure. Many issued laptops ortablets to staff, set up Virtual Private Networks (VPNs) or expanded existing VPN capacity,started using cloud servers and had to quickly approve new software. In a new question thisyear, the survey finds that a third of businesses (34%) and a fifth of charities (20%) have a VPN.These changes have led to new challenges for organisations to contend with, as part of theircyber security management approaches: Direct security and user monitoring have become harder in organisations where staff areworking remotely. As previously noted, fewer businesses are deploying security monitoringtools than in 2020 (down from 40% to 35%). Fewer businesses (32%, vs. 38% in 2020)and charities (29% vs. 38%) are now undertaking any form of user monitoring. Upgrading hardware, software and systems has also become more difficult. With staffworking at home, there are more endpoints for organisations to keep track of. Fewerbusinesses (83%, vs. 88% in 2020) and charities (69% vs. 78%) report having up-to-datemalware protection. Fewer businesses (78% vs. 83%) and charities (57% vs. 72%) haveset up network firewalls. In large businesses in particular, having laptops with unsupportedversions of Windows is a significant security risk (affecting 32% of large businesses). More generally, the pandemic had stretched resources and led to competing priorities in ITand cyber security teams. In some cases, there was a perceived conflict betweenprioritising IT service continuity and maintenance work, and aspects of cyber security suchas patching software.
Department for Digital, Culture, Media and SportCyber Security Breaches Survey 2021: Statistical Release3COVID-19 has been an unexpected and unprecedented challenge for organisations. But interms of cyber security, the findings highlight that there is more they can do to plan for, andensure they are resilient to, future uncertainties.The survey findings highlight that a minority of organisations overall have taken actions in thefollowing areas – although they are far more common among medium and large businesses: taking out some form of cyber insurance (43% of businesses and 29% of charities) – thisis up from 32 per cent for businesses in 2020 undertaking cyber security risk assessments (34% and 32%) testing staff, such as through mock phishing exercises (20% and 14%) carrying out cyber security vulnerability audits (15% and 12%) reviewing cyber security risks posed by suppliers (12% and 8%).As the UK emerges from the COVID-19 pandemic, organisations might also consider what morethey can do to manage cyber security risks in a “blended” working environment (i.e. where staffare regularly working both in offices and at home): Three in ten businesses (31%) and slightly fewer charities (27%) have a businesscontinuity plan that covers cyber security. This was a new question for 2021. A quarter of businesses and charities (23% of each) have cyber security policies thatcover home working. A fifth of businesses (18%) and a quarter of charities (23%) havepolicies that cover the use of personal devices for work. The extent to which these areasfeature in cyber security policies has not changed significantly since last year. Over four in ten businesses (46%) and three in ten charities (30%) are using smart (i.e.network-connected) devices in workplaces. This was also a new question for 2021, andhighlights a potential new area of cyber risk for organisations to address.The qualitative research also highlights organisations’ cyber security ambitions for the futureand the broader challenges they expect to face. Many expect to make continuousimprovements in their cyber security, which includes, for example, rolling out multi-factorauthentication, or tweaking policies and processes to cover Software as a Service (SaaS).Some also expect to move further away from an approach of locking down user activity, towardsone that prioritises functionality and flexibility. Cyber security teams may therefore need torealign themselves to wider strategic business needs in some cases, emphasising how staff canuse new technologies, software and platforms securely rather than banning them.
Department for Digital, Culture, Media and SportCyber Security Breaches Survey 2021: Statistical Release4Chapter 1: Introduction1.1 Code of practice for statisticsThe Cyber Security Breaches Survey is an official statistic and has been produced to thestandards set out in the Code of Practice for Statistics.1.2 BackgroundPublication date: March 2021Geographic coverage: United KingdomThe Department for Digital, Culture, Media and Sport (DCMS) commissioned the Cyber SecurityBreaches Survey of UK businesses, charities and education institutions as part of the NationalCyber Security Programme. The findings help these organisations to understand the nature andsignificance of the cyber security threats they face, and what others are doing to stay secure. Italso supports the Government to shape future policy in this area, in line with the National CyberSecurity Strategy 2016–2021.The latest survey was carried out by Ipsos MORI. It covers: awareness and attitudes towards cyber security, including the impact of COVID-19 approaches to cyber security, including the technical and governance processes thatorganisations have in place to identify and manage cyber risks the nature and impact (including estimated costs) of cyber security breaches differences by size and sector.This 2021 publication follows previous surveys in this series, published annually since 2016. Ineach publication year, the quantitative fieldwork has taken place in the winter of the precedingyear (for example, in winter 2020/21, for this latest survey).This Statistical Release focuses on the business and charity results. The results for educationalinstitutions have been included in a separate Education Annex.1.3 MethodologyAs in previous years, there were two strands to the Cyber Security Breaches Survey: We undertook a random probability telephone survey of 1,419 UK businesses, 487 UKregistered charities and 378 education institutions from 12 October 2020 to 22 January2021. The data for businesses and charities have been weighted to be statisticallyrepresentative of these two populations. We carried out 32 in-depth interviews in January 2021, to gain further qualitative insightsfrom some of the organisations that answered the survey.Sole traders and public-sector organisations were outside the scope of the survey. In addition,businesses with no IT capacity or online presence were deemed ineligible, which led to a smallnumber of specific sectors (agriculture, forestry and fishing) being excluded. These exclusionsare consistent with previous years, and the survey is considered comparable across years.The educational institutions, covered in the separate Education Annex, comprise 135 primaryschools, 158 secondary schools, 57 further education colleges and 28 higher educationinstitutions.More technical details and a copy of the questionnaire are available in the separately publishedTechnical Annex.
Department for Digital, Culture, Media and SportCyber Security Breaches Survey 2021: Statistical Release51.4 Changes since the 2020 surveyThe 2021 survey is methodologically consistent with previous years, in terms of the samplingand data collection approaches. This allows us to look at trends over time with confidence,where the same questions have been asked across years. However, this year’s study makesthe following important changes: a small number of questionnaire changes to stay in line with DCMS policy objectives (e.g.new questions related to COVID-19 and managing supplier risks) a redesign in the way we collect data on the costs of breaches in the survey, as part of areflection on findings from a separate 2020 DCMS research study on the full cost of cybersecurity breaches an increase in the sample sizes for charities, primary schools, secondary schools andfurther education colleges, allowing for a more statistically robust dataset for these groups.This Statistical Release flags any changes that mean findings are no longer comparable withprevious years (i.e. where the question wording has changed). A full list of these changes is inthe Technical Annex. In particular, the changes to the cost data mean we can no longer makedirect comparisons to previous years, but can still comment on whether the pattern of results issimilar to previous years.1.5 Interpretation of findingsHow to interpret the quantitative dataThe survey results are subject to margins of error, which vary with the size of the sample andthe percentage figure concerned. For all percentage2 results, subgroup differences by size, andsector, as well as changes since the previous surveys, have been highlighted only wherestatistically significant (at the 95% level of confidence).3 By extension, where we do notcomment on differences across years, for example in line charts, this is specifically becausethey are not statistically significant differences.There is a further guide to statistical reliability at the end of this release.Subgroup definitions and conventionsFor businesses, analysis by size splits the population into micro businesses (1 to 9 employees),small businesses (10 to 49 employees), medium businesses (50 to 249 employees) and largebusinesses (250 employees or more).For charities, analysis by size is primarily considered in terms of annual income band. Thesample size for charities (487) has increased this year compared to the smaller 2020 samplesize (387). As a result, we have been able to highlight more income band differences this year,with the greatest focus being on the subgroups of high-income charities (with 500,000 or morein annual income) and those with very high incomes (of 5 million or more).Due to the relatively small sample sizes for certain business sectors, these have been groupedwith other similar sectors for more robust analysis. Business sector groupings referred to acrossthis report, and their respective SIC 2007 sectors, are:2Where subgroup mean scores are compared, the large variation in the data often means that these differencesare not statistically significant – this is made clear throughout. However, looking at the pattern of mean scoresacross subgroups, and the direction of travel since the 2016 and 2017 surveys, can still generate valuable insightsin these instances.3 Subgroup differences highlighted are either those that emerge consistently across multiple questions or evidencea particular hypothesis (i.e. not every single statistically significant finding has been commented on).
Department for Digital, Culture, Media and SportCyber Security Breaches Survey 2021: Statistical Release 6administration and real estate (L and N)construction (F)education (P)health, social care and social work (Q)entertainment, service and membership organisations (R and S)finance and insurance (K)food and hospitality (I)information and communications (J)utilities and production (including manufacturing) (B, C, D and E)professional, scientific and technical (M)retail and wholesale (including vehicle sales and repairs) (G)transport and storage (H).Typically, we have not commented on differences by region. Where these differences appear inthe data, there is generally no consistent pattern across years (which is not the case for sizeand sector differences). The regional differences in any given year’s data may therefore bemore reflective of the size and sector profile of the sample in that region than of any realpopulation differences.Where figures in charts do not add to 100%, or to an associated net score, this is due torounding of percentages or because the questions allow more than one response.How to interpret the qualitative dataThe qualitative survey findings offer more nuanced insights and case studies into how and whybusinesses and charities hold attitudes or adopt behaviours with regards to cyber security. Thefindings reported here represent common themes emerging across multiple interviews. Whereexamples or insights from one organisation, or a small number of organisations are pulled out,this is to illustrate findings that emerged more broadly across interviews. However, as with anyqualitative findings, these examples are not intended to be statistically representative.1.6 AcknowledgementsIpsos MORI and DCMS would like to thank all the organisations and individuals whoparticipated in the survey. We would also like to thank the organisations who endorsed thefieldwork and encouraged organisations to participate, including: the Association of British Insurers (ABI)the Charity Commission for England and Walesthe Charity Commission for Northern Irelandthe Confederation of British Industry (CBI)the Institute of Chartered Accountants in England and Wales (ICAEW)Jisc, a not-for-profit company that provides digital infrastructure, services and guidance forUK further and higher education institutions.
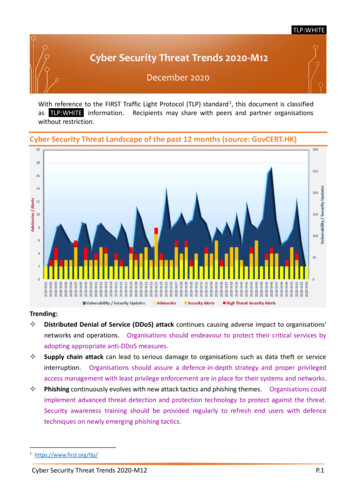
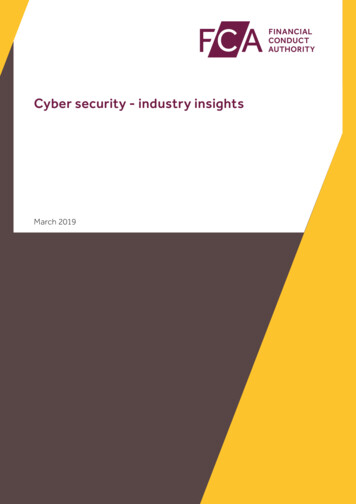
Department for Digital, Culture, Media and Sport7Cyber Security Breaches Survey 2021: Statistical ReleaseChapter 2: Profiling UK businesses and charitiesSome organisations may be more at risk of cyber security breaches given their reliance ondigital services or e-commerce, or employees’ use of personal devices in the workplace. Thisbrief chapter covers the types of organisations that tend to be more exposed to risks in this way.It helps to contextualise some of the sector differences evidenced in later chapters.2.1 The digital footprint of different organisationsAlmost all organisations have some form of digital exposure. Over nine in ten businesses (96%)and nine in ten charities (88%) have at least one of the items listed in Figure 2.1. These are inaddition to the number that will have their own websites and staff email accounts – somethingwe have recorded as being near-universal in previous years of the survey.Moreover, most organisations have multiple exposure points. Six in ten businesses (59%) andhalf of charities (50%) have at least three of the items mentioned.Only a minority of businesses and charities take payments or bookings online. However,medium (42%) and large (44%) businesses are more likely than average (30%) to have suchpayment capabilities, as high-income charities (42% of those with 500,000 or more, vs. 29%overall).Network-connected devices (sometimes called smart devices) were a new answer option for thefirst time this year. These can be devices such as TVs, building controls, alarms or speakers,among others. These are more commonplace in businesses than charities (46% vs. 30%).Larger organisations also report using these devices more often (68% of medium firms, 77% oflarge firms and 52% of high-income charities do so).Figure 2.1: Percentage that currently have or use the following digitalservices or processesBusinessesCharities82%Online bank account65%59%66%Social media pages oraccounts58%57%Personal information aboutcustomers held electronicallyNetwork-connected devices*Ability for customers to order,book or pay online46%30%30%29%Bases: 1,419 UK businesses; 487 charities*New codes added for 2021We also continue to ask charities separately about two types of online activity that might affectthem, over and above private sector businesses: Over four-in-ten charities (45%) allow people to donate to them online. Four-in-ten (39%) have beneficiaries that can access services online.
Department for Digital, Culture, Media and SportCyber Security Breaches Survey 2021: Statistical Release8It is more common for high-income charities to allow people to donate to them online (55% ofthose with 500,000 or more) and to have beneficiaries that can access services online (59%)when compared to charities overall.Sector differencesAmong private businesses, the sectors that are most likely to hold personal data aboutcustomers include: finance and insurance (82%, vs. 58% overall) health, social work and social care (80%) administration and real estate (67%).The sectors where it is most common for customers to book or pay online are, as might beexpected, the food and hospitality sector (57%, vs. 30% overall) and the retail and wholesalesector (40%).All these sectoral differences are broadly in line with what we have found in previous years.Food and hospitality firms are also more likely than others to use network-connected devices(59%, vs. 46% overall).Trends over timeThis year sees a significant increase in businesses dealing with finances online, both in terms ofhaving an online bank account (82%, vs. 75% in 2020) and accepting online payments (30%,vs. 23% in 2020). Both these indicators had previously remained consistent since 2016.There is a similar trend for charities. Compared to 2019, a greater proportion now have onlinebank accounts (65%, vs. 54% in 2019), provide an ability for people to donate online (45% vs.24%) and allow beneficiaries or service users to access services online (39% vs. 29%). Since2018, there has also been an increase in charities offering customers the ability to pay online(29%, vs. 20% in 2018).This could indicate an increase in organisations moving their business or services online duringthe COVID-19 pandemic, when face-to-face dealings have become more restricted.2.2 Use of industrial control systemsAn industrial control system (ICS) is a digital control system used to control industrial processessuch as manufacturing, raw materials and energy production, distribution andtelecommunications. Our survey asks the specific sectors that are likely to carry out theseprocesses whether they have an ICS. Our estimates suggest that even in these sectors, ICS isa relatively niche process. This includes: utilities and production (9% use ICS) information and communications (7%) construction (6%).There are too few transport and storage firms in the sample to report separately this year, butthe combined data across the past three years of the survey suggests around five per cent ofthe businesses in this sector also use ICS.These results are, broadly, consistent with previous years. The proportions are expected to beconsiderably higher in large businesses in these sectors, particularly the utilities sector, wheremost businesses are thought to have some sort of ICS. However, our sample sizes within thesesectors do not allow results to be split by size. It is also worth noting that our sector grouping forthis report includes manufacturing businesses alongside utilities.
Department for Digital, Culture, Media and Sport9Cyber Security Breaches Su
carrying out cyber security vulnerability audits (15% and 12%) reviewing cyber security risks posed by suppliers (12% and 8%). As the UK emerges from the COVID-19 pandemic, organisations might also consider what more they can do to manage cyber security risks in a "blended" working environment (i.e. where staff