Transcription
CLARENDON COLLEGEClarendon, TexasANNUAL FINANCIAL REPORTAugust 31, 2010 and 2009
TABLE OF CONTENTSPAGEORGANIZATIONAL DATA . .1INDEPENDENT AUDITOR'S REPORT .2MANAGEMENT'S DISCUSSION AND ANALYSIS .4FINANCIAL STATEMENTSExhibit123Statements of Net Assets . 15Statements of Revenues, Expenses, andChanges in Net Assets . 16Statements of Cash Flows. 17Notes to Financial Statements. 19OTHER SUPPLEMENTAL INFORMATIONSchedule A Schedule of Operating Revenues .B Schedule of Operating Expenses by Object .C Schedule of Nonoperating Revenues and Expenses .D Schedule of Net Assets by Source and Availability.E Schedule of Expenditures of Federal Awards .Notes to Schedule of Expenditures of Federal Awards .353738394041SINGLE AUDIT SECTIONIndependent Auditor's Report on Internal Control OverFinancial Reporting and on Compliance and Other MattersBased on an Audit of Financial Statements Performed inAccordance with Government Auditing Standards .Independent Auditor's Report on Compliance with RequirementsThat Could Have a Direct and Material Effect on Each MajorProgram and on Internal Control Over Compliance in Accordancewith OMB Circular A-133 .Schedule of Findings and Questioned Costs .Schedule of Corrective Action for Audit Findings and Questioned Costs .Summary Schedule of Prior Audit Findings .4345475051STATISTICAL SUPPLEMENT (Unaudited) . 52
CLARENDON COLLEGEORGANIZATIONAL DATAAugust 31, 2010Board of RegentsCharles E. Dehyle, Sr.John C. HowardDelbert W. RobertsonOfficersTerm ExpiresMayChairmanVice ChairmanSecretary201620142012MembersDouglas LoweJack A. MoremanMary Ellen ShieldsRuth RobinsonWilliam A. SansingJerry W. WoodardClarendon, TexasClarendon, TexasClarendon, TexasClarendon, TexasClarendon, TexasClarendon, Texas201220142016201620142012Principal Administrative OfficersDr. W. R. AvenshineDr. Debra D. KuhlRaymond JamarilloTexas BuckhaultsAnnette FergusonWendy AltmanPresidentDean of InstructionVice President Pampa Center andDean of Workforce Development and Continuing EducationDean of StudentsDean of Administrative ServicesDirector of the Clarendon College Childress Center1
Independent Auditor's ReportBoard of RegentsClarendon CollegeClarendon, TexasWe have audited the accompanying financial statements of Clarendon College (the College) asof and for the years ended August 31, 2010 and 2009, as listed in the table of contents. Thesefinancial statements are the responsibility of the College's management. Our responsibility is toexpress an opinion on these financial statements based on our audits.We conducted our audits in accordance with auditing standards generally accepted in theUnited States of America and the standards applicable to financial audits contained inGovernment Auditing Standards, issued by the Comptroller General of the United States.Those standards require that we plan and perform the audit to obtain reasonable assuranceabout whether the financial statements are free of material misstatement. An audit includesexamining, on a test basis, evidence supporting the amounts and disclosures in the financialstatements. An audit also includes assessing the accounting principles used and the significantestimates made by management, as well as evaluating the overall financial statementpresentation. We believe that our audits provide a reasonable basis for our opinion.In our opinion, the financial statements referred to above present fairly, in all material respects,the financial position of the College, as of August 31, 2010 and 2009, and the respectivechanges in financial position and cash flows thereof for the years then ended in conformity withaccounting principles generally accepted in the United States of America.In accordance with Government Auditing Standards, we have also issued our report datedDecember 16, 2010, on our consideration of the College's internal control over financialreporting and on our tests of its compliance with certain provisions of laws, regulations,contracts, and grant agreements and other matters. The purpose of that report is to describethe scope of our testing of internal control over financial reporting and compliance and theresults of that testing, and not to provide an opinion on the internal control over financialreporting or on compliance. That report is an integral part of an audit performed in accordancewith Government Auditing Standards and should be considered in assessing the results of ouraudit.The Management's Discussion and Analysis presented on pages 5 through 13, is not a requiredpart of the basic financial statements but is supplementary information required by accountingprinciples generally accepted in the United States of America. We have applied certain limitedprocedures, which consisted principally of inquiries of management regarding the methods ofmeasurement and presentation of the required supplementary information. However, we did notaudit the information and express no opinion on it.2801 South Fillmore, Suite 600, Amarillo, Texas 79101PO Box 15650, Amarillo, Texas 79105(806) 373.6661FAX (806) 372.1237www.cmmscpa.comI
Our audits were conducted for the purpose of forming an opinion on the basic financialstatements of the College. The accompanying Schedule of Expenditures of Federal Awards,Schedule E, is presented for purposes of additional analysis as required by U.S. Office ofManagement and Budget Circular A-133, Audits of States, Local Governments, and Non-ProfitOrganizations, and is not a required part of the basic financial statements of the College. Theremaining supplemental information listed in the table of contents, Schedules A, B, C and D,and the Statistical Supplement, are likewise presented for purposes of additional analysis andare not a required part of the basic financial statements. The Other Supplemental Informationlisted in the table of contents has been subjected to the auditing procedures applied in the auditof the basic financial statements and, in our opinion, is fairly stated, in all material respects, inrelation to the basic financial statements taken as a whole. The Statistical Supplement has notbeen subjected to the auditing procedures applied in the audit of the basic financial statementsand, accordingly, we express no opinion on it.Amarillo, TexasDecember 16, 20103
MANAGEMENT'S DISCUSSION AND ANALYSIS4
CLARENDON COLLEGEMANAGEMENT’S DISCUSSION AND ANALYSISFiscal Year Ending August 31, 2010This section of the Clarendon College (the College) annual financial report presentsmanagement's discussion and analysis of the financial performance of the College during thefiscal year ended August 31, 2010. This discussion and analysis is designed to focus on currentactivities, resulting changes and the currently known facts, and should be read in conjunctionwith the accompanying financial statements and footnotes. The financial analysis is presentedfor fiscal year 2010, with fiscal year 2009 data presented for comparative purposes. Thefinancial statements, footnotes and this discussion are the responsibility of the Collegemanagement.Using the Annual Financial Report:In June 1999, the Governmental Accounting Standards Board (GASB) released StatementNo. 34, Basic Financial Statements–and Management's Discussion and Analysis–for State andLocal Governments. Statement No. 34 requires a comprehensive look at the entity as a wholeand the depreciation of capital assets. In November 1999, GASB issued Statement No. 35,Basic Financial Statements and Management's Discussion and Analysis for Public Colleges andUniversities, which applies the provisions of Statement No. 34 to public colleges anduniversities.The financial report for the College includes the Statements of Net Assets, Statements ofRevenues, Expenses, and Changes in Net Assets and the Statements of Cash Flow. Thesestatements are prepared under the accrual basis of accounting and in accordance with GASBprinciples.Condensed Statements of Net Assets as of August 31, 2010 and 2009: (in millions)2010Current assetsCash and cash equivalentsAccounts receivableOther assets Total current assetsNoncurrent assetsRestricted cash and cash equivalentsCapital assets, netOther noncurrent assetsTotal noncurrent assetsTotal assets 520092.21.20.1 1.91.20.13.53.24.215.20.41.912.60.319.823.3 14.818.0
CLARENDON COLLEGEMANAGEMENT’S DISCUSSION AND ANALYSISFiscal Year Ending August 31, 20102010Current liabilitiesAccounts payable and accrued liabilitiesDeferred revenueOther current liabilities Total current liabilities20090.71.50.6 0.31.70.32.82.3Noncurrent liabilities5.62.2Total liabilities8.44.5Net assetsInvested in capital assetsNonexpendableRestricted for tal net assetsTotal liabilities & net assets14.923.313.518.0 There was an increase of 0.3 million in the total current assets for 2009-2010 when comparedto 2008-2009. Cash and cash equivalents increased 0.3 million while all other categoriesremained flat. Cash and cash equivalents went from 1.9 million in 2008-2009 to 2.2 million in2009-2010.Noncurrent assets increased 5.0 million in 2009-2010. It went from 14.8 million in 2008-2009to 19.8 million in 2009-2010. Restricted cash and cash equivalents increased 2.3 million in2009-2010, going from 1.9 million in 2008-2009 to 4.2 million in 2009-2010. In September2009 the College entered into a lease agreement with Gray County, Texas. The lease coveredthe purchase of land and the construction of two new vocational training buildings. The leasecontained an option to purchase, which qualified the agreement as a capital lease and resultedin a new lease payable. In addition, this lease agreement allowed the College to receive 4.1million in proceeds that were to be used to construct the two new vocational/technical classroomcenters. At August 31, 2010 there was 2.3 million remaining in restricted cash from theproceeds and 2.0 million in construction in progress. The other large increase in noncurrentassets was in capital assets. Capital assets went from 12.6 million in 2008-2009 to 15.2million in 2009-2010, for a net increase of 2.6 million. In addition to the 1.9 million relating tothe construction project, the College also purchased a new student management and financialreporting system during 2009-2010 at a cost of 0.5 million, wind equipment totaling 0.3 millionand received a gift of land valued at 0.2 million. These capital additions combined resulted inan increase in net capital assets of 2.6 million.Current liabilities increased 0.3 million, going from 2.3 million in 2008-2009 to 2.8 in 20092010. Accounts payable went from 0.3 million in 2008-2009 to 0.7 million in 2009-2010, for a 0.4 million increase. This increase is the progress billing for the construction of the two newvocational training buildings in Gray County. Other current liabilities went from 0.3 million in6
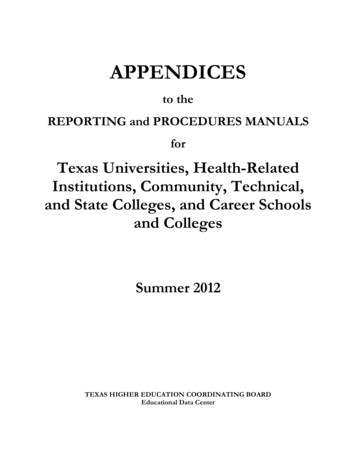
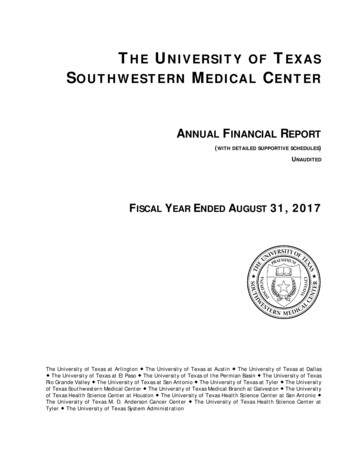
CLARENDON COLLEGEMANAGEMENT’S DISCUSSION AND ANALYSISFiscal Year Ending August 31, 20102008-2009 to 0.6 million in 2009-2010, for an increase of 0.3 million. This increase is thecurrent portion of the new lease payable resulting from the lease agreement with Gray County,Texas. Deferred revenue decreased 0.2 million, 1.5 million in 2009-2010 compared to 1.7million in 2008-2009.This fluctuation is a timing issue caused by the timing of studentenrollment for fall classes.Noncurrent liabilities increased by 3.4 million in 2009-2010 compared to 2008-2009, 5.6million compared to 2.2 million, respectively. The increase is again a result of the leaseagreement between the College and Gray County, Texas. The lease agreement resulted in thecreation of a lease payable of 3.9 million. Offsetting this increase were two payment transactions. Due to the further decline in investment income, the College made a decision to useunrestricted funds to pay off a bank note payable, which resulted in a decrease in notes payableof 0.3 million. There was also a scheduled principle payment during 2009-2010 for a reductionof 0.1 million for the bond payable.The net of this activity resulted in an increase in total net assets of 1.4 million, 13.5 million in2008-2009 compared to 14.9 million in 2009-2010.The following is a comparison of net assets and capital assets at August 31, 2010 and 2009:Analysis of Net ,000.00FY 09-106,000,000.00FY 08-094,000,000.002,000,000.00-Capital Unrestricted
CLARENDON COLLEGEMANAGEMENT’S DISCUSSION AND ANALYSISFiscal Year Ending August 31, 2010Condensed Statements of Revenues, Expenses and Changes in Net Assets as ofAugust 31, 2010 and 2009: (in millions)2010Operating revenue (net of discounts)Tuition & fees (net of discounts)Grants and contractsAuxiliary enterprises (net of discounts)Other operating revenues Total operating revenue20091.11.10.50.1 01.01.40.68.07.3Operating loss(5.2)(3.9)Nonoperating revenues (expenses)State appropriationsAd valorem taxesFederal revenue, nonoperatingGiftsInvestment incomeInterest on capital related debtOther .1)-6.45.00.22.21.43.313.510.2Operating expensesInstructionPublic serviceAcademic supportStudent servicesInstitutional supportOperation and maintenance of plantAuxiliary enterprisesDepreciationTotal operating expensesNet nonoperating revenues (expenses)Other revenue capital giftsIncrease in net assetsNet assets – beginning of yearNet assets – end of year 14.9 13.5Operating revenue includes tuition and fees net of scholarship discounts and allowances, grantsand contracts, sales and services, auxiliary enterprises and other. The College’s rate of tuitionand fees did not change between 2008-2009 and 2009-2010. Although the College did show anincrease in both contact hours and head count in 2009-2010 when compared to 2008-2009, the8
CLARENDON COLLEGEMANAGEMENT’S DISCUSSION AND ANALYSISFiscal Year Ending August 31, 2010operating revenue shows a decrease of 0.6 million in 2009-2010, 3.4 million in 2008-2009compared to 2.8 million in 2009-2010. Contact hours went from 644,400 in 2008-2009 to751,264 in 2009-2010 while the FTSE (full time student equivalent) went from 1,122 in 20082009 to 1,205 in 2009-2010. These increases are 16.6% and 7.4%, respectively. The reductionin operating revenue is due to an increase in discounts and allowances, which is used to reducetuition and fees and auxiliary enterprises. Discounts and allowances increased 1.2 million in2009-2010, 3.4 million in 2009-2010 compared to 2.2 million in 2008-2009. Even though thisincrease in discounts and allowances does show a reduction in operating revenue, it is offsetwith an increase in nonoperating revenue under federal revenue of 1.1 million. The Collegeestablished an extension center maintenance tax by election in 2009. The .05 tax is collectedin both Gray and Childress counties. Collections in both 2009-2010 and 2008-2009 totaled 0.9million. These funds are restricted and must be used to support the classroom center operatingin each respective county.Operating expenses increased 0.7 million, going from 7.3 million in 2008-2009 to 8.0 millionin 2009-2010. This increase was in instructional expenses. The College has added full-timepersonnel due to the increase in enrollment and the addition of new programs. The additionalpersonnel resulted in an increase of 0.4 in salaries and wages, 0.1 in local and state benefitsand 0.2 in small equipment and supplies for the new programs. All other 2009-2010 operatingexpense functional areas remained constant when compared to 2008-2009.Total nonoperating revenue for 2009-2010 increased 1.4 million, 5.0 million in 2008-2009compared to 6.4 million in 2009-2010. The College did have an increase of 0.4 million instate appropriation for 2009-2010. The College has worked hard to increase enrollment overthe past years through the addition of new academic, technical and athletic programs. Thiswork is reflected in the continue increase in both head count and contact hours. Contact hourshave increased 18.9 % in 2008-2009 and another 16.6% in 2009-2010. This increase in contacthours has earned the College additional funding through state appropriations. Federal financialaid received by the students was reclassified in 2008-2009 from operating to nonoperatingrevenue. All prior years were restated to reflect the same reclassification. The federal aidreceived by the students increased 1.1 million in 2009-2010 when compared to 2007-2008, 1.5 million in 2008-2009 compared to 2.6 million in 2009-2010. In addition to the increasedenrollment of approximately 7.4%, there was also an increase of approximately 13.1% in theannual amount of federal grant aid, Pell, awarded to eligible students, 5,350 in 2009-2010compared to 4,731 in 2008-2009. The College also had a 38.08% increase in the number offederal Pell grant eligible students in 2009-2010, 478 in 2008-2009 compared to 660 in 20092010. The College did receive two one-time gifts totaling 0.5 million in 2009-2010. Both ofthese gifts were restricted and were to be used in the construction of the new vocational trainingbuildings. The continued decline in interest rates resulted in a decrease in investment incomeof 0.1 million in 2009-2010. Interest revenue went from 0.2 million in 2008-2009 to 0.1million in 2009-2010.Net Assets, End of Year 2009-2010 increased 1.4 million.9
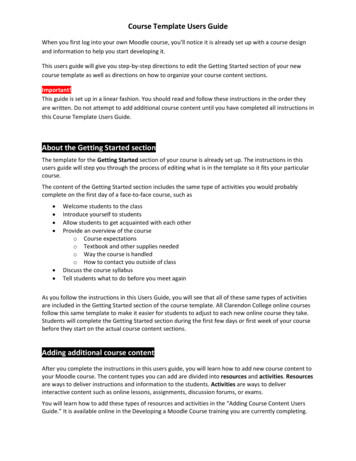
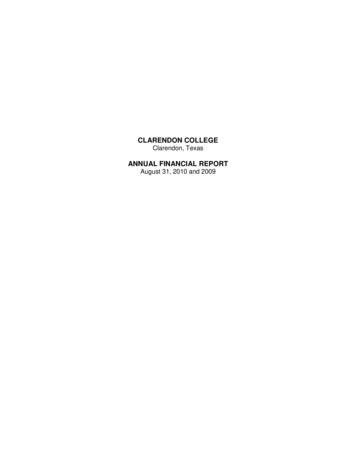
CLARENDON COLLEGEMANAGEMENT’S DISCUSSION AND ANALYSISFiscal Year Ending August 31, 2010The following charts are an Analysis of Revenue and Expenses as of August 31, 2010.10
CLARENDON COLLEGEMANAGEMENT’S DISCUSSION AND ANALYSISFiscal Year Ending August 31, 2010Revenue and 0004,000,0003,000,0002,000,0001,000,000-FY 09-10FY 08-09Operating Revenues Operating Expenses11NonoperatingRevenues/Expense
CLARENDON COLLEGEMANAGEMENT’S DISCUSSION AND ANALYSISFiscal Year Ending August 31, 2010Statement of Cash Flows as of August 31, 2010 and 2009: (in millions)Primary Institution20102009Cash provided by (used in):Operating activitiesNoncapital financing activitiesCapital and related financing activitiesInvesting activities Net increase in cashCash – beginning of the yearCash – end of year (4.2)6.00.60.1 (2.3)4.2(1.8)0.22.50.33.93.66.4 3.9This statement is used to determine the College’s ability to meet its obligations and to determineif external financing is needed. Federal financial aid received by the students was reclassified in2008-2009 from operating to nonoperating revenue. Prior year was restated to reflect the samereclassification.The net in cash provided by operating activities and noncapital financing activities for 2009-2010was a slight decrease, 0.1 million, when compared to 2008-2009, 1.8 compared to 1.9,respectively. The overall increase in net cash is due to the construction project in Gray Countyand the one-time gifts received by the College. The increase in cash resulting from capital andrelated financing activities is temporary, and as the college completes the construction of thetwo new vocational training buildings, this cash will be used.When interest rates started to decline in 2002-2003, the College started the practice of investingtheir money for periods of less than one year and has continued this practice through 20092010.Discussion of currently known facts, decisions, or conditions:In May 2008 the voters of both Gray and Childress counties passed a five cent ( 0.05) branchcampus maintenance tax. This vote of approval from the residents of these two counties didallow the College to expand course availabilities at both the Pampa and Childress centers.Clarendon College Pampa Center’s two new vocational buildings are now complete, andclasses in cosmetology, nail technology, vocational nursing, welding, heating and airconditioning and wind energy technology will be taught in these buildings beginning January2011.With our five-year plan, Unleash Your Potential, we will continue to expand our use of facilitiesand technology to respond to the needs of our students. The small average class size at theCollege provides students with more one-on-one interaction with the instructors and anenvironment conducive to learning. The majority of students attending the College do so inorder to transfer credits to other institutions. The College had 87.15% of our students completecourses and also awarded 221 degrees and/or certificates in May 2010.12
CLARENDON COLLEGEMANAGEMENT’S DISCUSSION AND ANALYSISFiscal Year Ending August 31, 2010The College is also continuing to focus on distance learning. The College currently provideshigh school dual credit courses to sixteen area high schools. In fall 2009, distance educationprovided 16.85% of all contact hours for the College. This is an increase of 2.2% over fall 2008.With the growth of technology we are committed to providing this option to our students.The College has seen a continued growth in enrollment over the past three years. ClarendonCollege’s contact hours rose from 290,672 in fall 2008 to 309,328 in fall 2010, which is a 6.4 %increase. During this same time frame, the College experienced a 27.76% increase in studenthead count going from 1,239 in Fall 2008 to 1,583 in Fall 2010. Clarendon College is committedto and does continue to be a low-cost provider of higher education to our service area.Clarendon CollegeUnleash Your Potential13
FINANCIAL STATEMENTS14
CLARENDON COLLEGESTATEMENTS OF NET ASSETSAUGUST 31, 2010 AND 2009Exhibit 1ASSETSCURRENT ASSETSCash and cash equivalentsAccounts receivable, netInventoriesPrepaid expensesTotal current assetsNONCURRENT ASSETSRestricted cash and cash equivalentsReal estate held as investments by endowmentsUnamortized bond & lease payable issuance costsDepositsCapital assets, netTotal noncurrent assetsTOTAL ASSETS20102009 2,188,0831,188,76391,69322,2833,490,822 1,12712,632,09519,817,786 23,308,60814,852,286 18,056,125 LIABILITIES AND NET ASSETSCURRENT LIABILITIESAccounts payableAccrued liabilitiesFunds held for othersDeferred revenuesRetainage payableLease payable - current portionNotes payable - current portionBonds payable - current portionTotal current liabilitiesNONCURRENT LIABILITIESAccrued liabilitiesDepositsLease payable - noncurrent portionNotes payable - noncurrent portionBonds payable - noncurrent portionTotal noncurrent liabilitiesTOTAL LIABILITIESNET ASSETSInvested in capital assets, net of related debtRestricted for:NonexpendableExpendable:Student aidDebt serviceOtherUnrestrictedTotal net assets (Schedule D)TOTAL LIABILITIES AND NET 64614,858,349 23,308,60813,473,345 18,056,125The accompanying notes are an integral part of the financial 15,0002,418,984
CLARENDON COLLEGESTATEMENTS OF REVENUES, EXPENSES, AND CHANGES IN NET ASSETSYears ended August 31, 2010 and 2009Exhibit 2OPERATING REVENUESTuition and fees, net of discounts of 2,357,881 and 1,538,844 in 2010 and 2009, respectivelyFederal grants and contractsState grants and contractsLocal grants and contractsAuxiliary enterprises, net of discounts of 1,014,450and 648,709 in 2010 and 2009, respectivelyOther operating revenuesTotal operating revenues (Schedule A)OPERATING EXPENSESInstructionPublic serviceAcademic supportStudent servicesInstitutional supportOperation and maintenance of plantAuxiliary enterprisesDepreciationTotal operating expenses (Schedule B)Operating lossNONOPERATING REVENUES (EXPENSES)State appropriationsAd valorem taxes for maintenance and operationsFederal revenue, nonoperatingGiftsInvestment incomeInterest on capital-related debtGain (loss) on disposal of fixed assetsOther nonoperating revenues (expenses)Net nonoperating revenues (Schedule C)OTHER REVENUESCapital giftsTotal other revenuesIncrease in net assetsNET ASSETS - BEGINNING OF YEARNET ASSETS - END OF YEAR20102009 1,116,560138,36377,507910,662 ,0043,239,34013,473,34510,234,005 14,858,349 13,473,345The accompanying notes are an integral part of the financial statements.16
CLARENDON COLLEGESTATEMENTS OF CASH FLOWSYears ended August 31, 2010 and 2009Exhibit 320102009CASH FLOWS FROM OPERATING ACTIVITIESReceipts from students and other customersReceipts from grants and contractsPayments to or on behalf of employeesPayments to suppliers for goods or services 1,408,8841,191,112(4,008,171)(2,777,125) 2,609,556942,810(3,537,990)(2,398,691)Net cash used by operating activities(4,185,300)(2,384,315)CASH FLOWS FROM NONCAPITAL FINANCING ACTIVITIESReceipts from state appropriationsReceipts from ad valorem tax revenuesReceipts from nonoperating federal revenueGifts and grantsStudent organizations and other agency ,091,792403,7671,484,372257,0552,527Net cash provided by noncapital financing (122,791)CASH FLOWS FROM CAPITAL AND RELATEDFINANCING ACTIVITIESPurchases of capital assetsProceeds on capital debtProceeds on disposition of assetsPrincipal payments on capital debtPrincipal payments on capital leaseInterest payments on capital debtNet cash provided (used) by capital andrelated financing activitiesCASH FLOWS FROM INVESTING ACTIVITIESInvestment ,672INCREASE IN CASH AND CASH EQUIVALENTS2,509,850230,076CASH AND CASH EQUIVALENTS - BEGINNING OF YEAR3,847,9163,617,840CASH AND CASH EQUIVALENTS - END OF YEAR 6,357,766 3,847,916Cash and cash equivalents are reported in theStatement of Net Assets as follows:Cash and cash equivalentsRestricted cash and cash equivalents 2,188,0834,169,683 1,931,4791,916,437 6,357,766 3,847,916Net cash provided by investing activitiesTotal cash and cash equivalents17
CLARENDON COLLEGESTATEMENTS OF CASH FLOWS, CONTINUEDYears ended August 31, 2010 and 2009Exhibit 3Reconciliation of operating loss to net cashused by operating activities:Operating lossAdjustments to reconcile operating loss to net cash usedby operating activities:Depreciation expenseState-funded benefitsChanges in operating assets and liabilities:Receivables, netInventoriesPrepaid expensesAccounts payableAccrued liabilitiesDeferred revenueDeposits20102009 (5,221,735) 39,1614,638(29,072)137,7243,773 (4,185,300) (2,384,315)Land contributed from donor 173,756 Building contributed from donor -Net cash used by operating activitiesNoncash investing, capital and financing activiites:The accompanying notes are an integral part of the financial statements.18118,400 2,497,050
CLARENDON COLLEGENOTES TO FINANCIAL STATEMENTSAugust 31, 2010 and 2009NOTE 1 - REPORTING ENTITYClarendon College (the College) was established in 1927 in accordance with the laws of theState of Texas, to serve the educational needs of Clarendon, Texas, and the surroundingcommunities. The College is considered to be a special-purpose, primary governmentaccording to the definition in Governmental Accounting Standards Board (GASB) Statement No.14, The Financial Reporting Entity. While the College receives funding from local, state, andfederal sources, and must comply with the spending, reporting, and record keepingrequirements of these entities, it is not a component unit of any other governmental entity.NOTE 2 - SUMMARY OF SIGNIFICANT ACCOUNTING POLICIESReporting GuidelinesThe significant accounting policies followed by the College in preparing these financialstatements are in accordance with the Texas Higher Education Coordinating Board's AnnualFinancial Reporting Requirements for Texas Public Community and Junior Colleges. TheCollege applies all applicable GASB pronouncements and all applicable Financial AccountingStandards Board (FASB) statements and interpretations issued on or before November 30,1989, unless they conflict or contradict GASB pronouncem
Clarendon College Clarendon, Texas We have audited the accompanying financial statements of Clarendon College (the College) as of and for the years ended August 31, 2010 and 2009, as listed in the table of contents. These financial statements are the responsibility of the College's management. Our responsibility is to