Transcription
Developing Heuristics for the Graph Coloring Problem Applied to Register Allocationin Embedded SystemsAdrian Florea, Arpad GellertComputer Science and Electrical Engineering Department“Lucian Blaga” University of SibiuSibiu, Romaniaadrian.florea@ulbsibiu.ro, arpad.gellert@ulbsibiu.roABSTRACT: The main aim of this paper consists in developing an effective e-learning tool, focused on evolutionary algorithms, in order to solve the graph coloring problem. Subsidiary, we apply graph coloring for register allocation in embedded systems. From didactic viewpoint, our tool has benefits in the learning process because it helps students to observe therelationship between the graph coloring problem and CPU registers allocation with the help of four developed modules: thetwo evolutionary algorithms (Genetic Algorithm and Particle Swarm Optimization), the graphical viewer, the interferencegraph for a C program and a web application which collects the simulation results. All these applications are combined bya graphical interface which allows the user to configure the parameters of the genetic algorithm and to analyze their effectover the convergence.Keywords: Graph Coloring, Register Allocation, Embedded Systems, Genetic Algorithm, Particle Swarm OptimizationReceived: 18 May 2017, Revised 29 June 2017, Accepted 5 July 2017 2017 DLINE. All Rights Reserved1. IntroductionThis paper extends the previous work that was presented at the Sixth International Conference on Innovative ComputingTechnology (INTECH 2016) [1], by presenting some features added to our developed software tool like new heuristics in solvinggraph coloring problem, results centralization in online database and remote visualization on server. It will facilitate furtheranalysis and finding optimal control parameters of evolutionary algorithms. We integrated the Particle Swarm Optimization(PSO) algorithm, showing the particularities and difficulties in applying to graph coloring problem (GCP), and illustrating an elearning solution that maps the discreet value problem (GCP) into a continuous values space (PSO).Graph coloring is one of the most important graph theory concepts. It is an NP-complete problem, thus the time necessary to findJournal of Multimedia Processing and Technologies Volume 8 Number 3 September 201775
the optimal solution is exponential. The problem implies vertex coloring and in some cases also edge coloring in an undirectedgraph. The adjacent vertices must have different colors and the total number of used colors must be as low as possible. Forgraphs with high number of vertices, finding the optimal solution is unfeasible, but heuristic algorithms can converge toacceptable solutions.Mathematically, each graph has associated a chromatic polynomial which shows in how many different ways the graph can becolored using a certain number of colors. The chromatic polynomial is a function P(G, t), where G is the graph and t is the numberof colors. The chromatic number c shows the minimum number of colors necessary to solve the problem and it is the lowestinteger which is not a solution of the chromatic polynomial:χ (G) min {k : P(G, k) 0}(1)There are known chromatic polynomial formulas for certain graph classes (forest graphs, chordal graphs, cyclic graphs).Several graph coloring methods have been already applied, such as greedy algorithms, genetic algorithms, local search algorithms,etc. Graph coloring has been used to solve problems in different domains: map coloring, frequency allocation in mobile phonenetworks, radio frequency allocation, register allocation in compilers, scheduling problems, etc.The graph coloring problem represents an important concept of graph theory and has numerous applications in the conflictsresolution in computer science problems ranging from games implementation, the design of mobile phone networks untilscheduling problems and compiler optimizations such as registers allocation in embedded systems. In this paper, we applygraph coloring for register allocation in embedded systems. Due to the specific technological requirements, the embeddedprocessors are limited in resources, memory and also have power consumption constraints. The number of registers is quite lowand usually some of the registers are dedicated for certain instructions and, therefore, the registers must be efficiently used.Such systems need compilers that generate optimal code. Thus, several optimization techniques have been developed that,based on architectural knowledge, can optimize the code.Register allocation is an important compiler stage. Its main function is to map variables into the memory or registers. Due to thehigh access latency difference between memory and registers, keeping the variables in registers is preferred. When a register isneeded, and all the registers are occupied, one of them must be spilled to the memory. This process implies additional costs and,thus, lower performance and higher energy consumption. Therefore, compilers must minimize the number of used registers andthe number of memory accesses.Register allocation can be optimized using graph coloring algorithms. The lifetime of the variables is analyzed and an interferencegraph is generated with vertices representing the variables. There are edges between the vertices corresponding to variableswhich are in use simultaneously. The colors are associated to the available registers. If the graph coloring is not possible, thealgorithm identifies the variables to be spilled to the memory, resulting thus a new graph which must be colored. Our applicationcan be used as an e-Learning tool due to its graphical interface which is visualizing the colored graph. The user can change theparameters of the algorithm and can analyze their effect over the convergence. For evaluations we used the benchmarks of theCenter for Discrete Mathematics & Theoretical Computer Science (DIMACS).The remainder of this paper is organized as follows. Section 2 reviews the state of the art in register allocation and graph coloringtechniques. Section 3 presents the software design of the application, describing in details the four developed modules: theapplied heuristics, the graphical viewer, the interference graph and the web application which collects the simulation results.Section 4 discusses the experimental results. Finally, Section 5 emphasizes the conclusions and presents some further workdirections.2. Related WorkTopcuoglu et al. applied a hybrid evolutionary algorithm for register allocation in embedded systems [2]. Their solution combinesgenetic algorithms with a local search technique. They introduced a novel, highly specialized crossover operator that is usingdomain-specific information. The experimental results, performed on synthetic benchmarks and routines extracted from benchmarksuites, show good performance in allocating the registers to variables.76Journal of Multimedia Processing and Technologies Volume 8 Number 3 September 2017
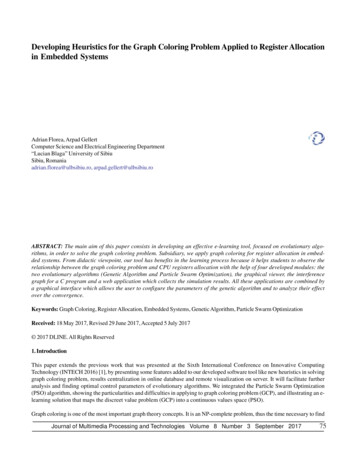
Liu et al. analyzed register allocation techniques in embedded systems with the goal of simultaneously reducing energyconsumption and heat buildup on register accesses [3]. Contrary with their intuition, the experiments have shown that reducingenergy consumption and decreasing heat dissipation on register accesses are two conflicting objectives. Therefore, theyintroduced a rotator hardware into the instruction decoder in order to facilitate a balanced solution for both objectives. Theauthors proposed register allocation and refinement based on the access patterns and the effects of the rotator. The results haveshown energy and peak temperature improvements for embedded applications.Homayoun et al. proposed an architectural solution to reduce the peak temperature of the register file which redistributes theaccess pattern to physical registers through a novel register allocation mechanism [4]. They introduced the idea of local activitymigration to manage register file temperature in embedded out-of-order processors. The register file is partitioned into multipleregions and, thus, the accesses can be distributed in a non-uniform pattern over these regions. The accessed regions arespatially and temporally apart, allowing for other regions to cool-down. Thus, some regions can be kept unused and coolingdown while other regions are active. Since only a subset of physical registers is used at any given time, the migration is solvedwithin the register file itself, avoiding a replicated unit. For this, a new register renamer was necessary, which attempts toconcentrate register allocations in a given region. Periodically, the redistribution mechanism switches to another partition. Theexperiments have shown that a 64-entry physical register file with 4 partitions performs best, the temperature being reducedwithout impact on the performance.Huang et al. used a register allocation technique to minimize the number of store instructions, reducing thus the write activitieson the non-volatile memory [5]. The experiments demonstrated that the proposed technique reduces the number of storeinstructions by 33%, which improves the system performance, but also extends the lifetime of non-volatile memory.Mahajan presents a hybrid evolutionary algorithm for graph coloring based register allocation [6]. They used a new crossoverby conflict-free sets and a new local search function.Lee et al. presents a register allocation technique that translates memory accesses to register accesses in order to improve theperformance of embedded software [7]. The source code is profiled to generate a memory trace. The proposed register allocationtechnique is applied only on functions with high number of calls, selected from the profiling results, saving thus the compilationtime. In the memory trace of the selected functions, the memory accesses that result in latency reduction when replaced byregister accesses are identified and translated to register accesses by modifying the intermediate code and allocating promotionregisters.Several solutions for the graph coloring problem have been proposed in recent works. Hindi presents a hybrid technique thatapplies a genetic algorithm followed by the wisdom of artificial crowds algorithm to solve the graph coloring problem [8].Chowdhury et al. used binary encoded chromosomes [9]. The proposed algorithm starts with the maximum chromatic numberand some of the colors are dynamically eliminated, the solution being thus reached in a single run. Djelloul et al. used a discretebinary version of cuckoo search algorithm [10]. A nature inspired flower pollination algorithm is proposed by Bensouyad [11],the artificial bee colony algorithm was applied by Dorrigiv [12], as well as ant-based algorithms have been used by Hertz [13] andBui [14]. A fuzzy clustering based evolutionary approach has been used by Lee [15]. Zhao et al. used simulated annealing [16],whereas Titiloye and Crispin applied quantum annealing which extends simulated annealing by introducing artificial quantumfluctuations [17].3. Application Software DesignThe software application was implemented in C#, under Visual Studio 2013 Express edition. The sever side web application wasdeveloped in ASP.NET MVC. The client side was developed using HTML, CSS, JavaScript and Razor (an ASP.NET syntax).For the graphical interface we used the ‘Windows Forms’ library provided by Microsoft. In order to take advantage by parallelevaluation of the chromosomes when the genetic algorithm is applied, hardware systems with larger number of cores arerecommended. As Figure 1 shows, the application consists in four distinct components: the two evolutionary algorithms(Genetic Algorithm and Particle Swarm Optimization), the graphical viewer, an application which creates the interference graphfor a C program and a web application which collects the simulation results. All these applications are combined by a graphicalinterface which allows the user to configure the parameters of the genetic algorithm and to analyze their effect over theconvergence.Journal of Multimedia Processing and Technologies Volume 8 Number 3 September 201777
Figure 1. The software architecture of the application3.1 The Genetic AlgorithmFigure 2. The Genetic AlgorithmWe used the genetic algorithm presented in [8]. The algorithm starts with a randomly generated population. Each solution isevaluated with the fitness function. In the population of the next generation will survive a certain percentage of individuals,composed by those with the lowest fitness (elitist approach). We set the limit value of fitness that will cause changing theapplied genetic operators. The new individuals are generated through crossover or mutation in parallel. The fitness function willbe determined by the correctness of the colored graph (no adjacent nodes of the same color meaning a desired fitness of 0) andthe aim will be to minimize the number of colors used. Thus, if the fitness function is approaching to 0, parents’ selection forcrossover will be random, otherwise it will apply the tournament method: two pairs of individuals are chosen, and the best oneswill become parents. The 1-point crossover operator is used. It chooses a random point on the two parents, splits the parents atthis crossover point and creates children by exchanging tails. On the individual which resulted from the crossover process amutation is applied depending on the mutation rate. The mutation type is decided based on the fitness of the best solutions inthe current population. Scrolling along the genes of the chromosome, each vertex that has the same color with a neighboringvertex will be recolored (with a color which is not used by the neighbors or with a color which is randomly chosen from all thecolors), removing thus the conflicts. The algorithm stops when it achieves a certain fitness level or when the number of78Journal of Multimedia Processing and Technologies Volume 8 Number 3 September 2017
iterations reaches a certain threshold. At the end of the execution, the coloring solution is exported into a text file together withthe adjacency matrix of the graph.3.2 Mapping the Particle Swarm Optimization algorithm for the Graph Coloring ProblemThe PSO technique was introduced in 1995 by Eberhart and Kennedy [18] as a stochastic search and optimization techniqueapplied successfully for solving real-world problems. It belongs to swarm-based heuristics methods that mimic social behaviorof bird flocking and fish schooling. There are some similarities between genetic algorithms and PSO. First, both algorithms usea population of potential solutions which is randomly initialized. Second, both have fitness values to evaluate the population.PSO relies on a combination of both cognitive personal knowledge (for diversity, similar with mutation in GA) and socialknowledge (for convergence and exploration like crossover in GA) of the given search space. However, PSO has dissimilaritiesto GA. In PSO, the units of selection (individuals) are referred as “particles”, which are “birds” in the flock. The individuals areinteracting together and share information for problem solving, and are flying through the problems’ space by following thecurrent optimum particle. Each particle has memory (its best previous position), which is important to the algorithm but, there isno evolution operators. In general the PSO is easier to implement although, as in the Graph Coloring Problem case, it ismandatory to make some additional data representations and computing tricks. Figure 3 presents the generic flowchart of thePSO algorithm. Two features are very important for a particle: Position and Velocity. Every particle knows its current location, theneighbors’ positions, the global best location, its best previous position and the objective function value and uses all theseinformation in order to move to next location.The movement equations are the following:(2)In equation 2 we made the notations: Vk (t) – is the velocity of the k-th particle at time (generation) t, where k represents a natural number between 1 and the size ofswarm (P size). Pk (t) – is the personal best position of the particle k from the previous t generations (best local). Pg (t) – is the best global position from all neighbors. Xk (t) – means the current position of particle k at time t. R1, R2 – are random functions with values in the range [0,1]. w – represents inertia weight that forces the particle to move in the same direction as it did in the previous generation andillustrates how much the particle trusts itself. Larger w means big steps in the search space that may lead to skip some goodindividuals. c1 - is positive acceleration constant which controls the influence of best local on the search process. It supervises the impactof the cognitive component maintaining the diversity in population and illustrates how much the particle trusts in its experience. c2 - is positive acceleration constant which controls the influence of best global on the search process. It manages the impactof the social component ensuring reaching the convergence of the algorithm and exhibits how much the particle is based on itsneighbors.As equation 2 shows, the velocity represents a vector which has 3 components: inertia, movement towards the best globalparticle, movement towards personal best (local). If the cognitive coefficient is much lower than social coefficients (c1 c2c1 c2), that is leading to premature convergence, particles being attracted (dominated by) to the global best. Conversely, if (c2 c1), the particles are attracted to the personal best, meaning a slow or even no convergence. Using big values for social andcognitive coefficients determines the velocity to rise too much and the algorithm will diverge.However the PSO has been applied successfully on continuous optimization problems sometimes outperforming even GA [19],Journal of Multimedia Processing and Technologies Volume 8 Number 3 September 201779
the real challenges appear when it needs to map a discreet value problem into a continuous values space such as is the GraphColoring Problem case. The difficulty lies in the representation of the Position and Velocity vectors. For the GCP the positionvector represents a sequence of colors corresponding to each node. This means that valid position vectors are only vectorscontaining integers between one and the number of available colors. Thus, the position vector has discreet values (in a verylimited value space) whilst the particle moves in a continuous value space (position is updated based on the velocity, which isa real number). Therefore, directly mapping the GCP on the PSO algorithm would not offer satisfactory results as the validsolution space is too restricted compared to the solution space the PSO is searching in.Further, for students who want to better understand the advantages of PSO and, to see comparatively how GA and PSO behaveon GCP problem, we apply the discrete particle swarm optimization approach, presented in [20] for grid job scheduling, to GCP.The main novelty consists in replacing Position and Velocity vectors with 2D matrix.For this we use an indirect representation of the PSO solution (particle), called position matrix (Cx N matrix, where C is numberof available colors, and N is the number of vertices from the graph) containing only values of 0 and 1. Each column can have onlyone element that is 1 (meaning that a vertex will receive one and only one color, not more). Assuming that Xk shows the positionof the k-th particle, then Xk[i, j] 1 means that the jth vertex is colored with the ith color (see equation 3).Figure 3. The generic flowchart of the PSO algorithm80Journal of Multimedia Processing and Technologies Volume 8 Number 3 September 2017
Xk [i, j] {0, 1} i [1, C], j [1, N], k [1, P Size](3)For example, let us considering a graph colored by 3 colors and having 5 nodes, where nodes 2 and 4 are colored with color 1,the nodes 3 and 5 are colored with color 2, and the first node is colored with color 3. The indirect representation of particle isshown in figure 4.Figure 4. Example of position matrixThe personal best position and the global best position must use the same representation as the position matrix. The rule ofupdating the position matrix is expressed in equation 4, where Vk(t) [i, j] is the element in the i-th row and the j-th column of thek-th velocity matrix in the t-th time step of the algorithm.Xk(t 1)[i, j] {1, if (Vk(t 1) [i, j] max{Vk(t 1) [i, j]}), i [1, C], j [1, Ν](4)0, otherwiseEquation (4) means that on each column in the position matrix, a 1 will be written to the element whose corresponding elementin the velocity matrix has the maximum value in its corresponding column (meaning that is the closest to the global best). The restof the elements on that column will be filled in with 0. If in a column of the velocity matrix there is more than one element withmaximum value, then one of these elements is selected randomly and 1 assigned to its corresponding element in the positionmatrix.The velocity is also a C x N matrix containing values between a defined minimum and maximum value.Vk [i, j] [ Vmax, Vmax], i [1, C], j [1, N](5)The classical update equation of the velocity would be:Vk(t 1)[i, j] Vkt[i, j] c1 . R1 . (Pkt[i, j] - Xkt[i, j]) c2 . R2 . (Pgt[i, j] - Xkt[i, j])(6)In equation (6) Pkt[i, j] is the element in the i-th row and the j-th column of the k-th personal best matrix in the t-th time step ofthe algorithm, whilst Pgt[i, j] is the element in the i-th row and the j-th column of the global best matrix in the t-th time step ofthe algorithm.Taking into consideration that the global best matrix and the personal best matrix and the position matrix X of each particlecontain only values of 0 and 1, the following possibilities arise: cognitive personal knowledge added from generation t to t 1 for the k-th particle might be 0, c1 . R1, c1. R1 depending on thedifference of each corresponding element from the personal best matrix and the position matrix X. social knowledge added from generation t to t 1 for the k-th particle might be 0, c2 . R2, c2 . R2 depending on the differenceof each corresponding element from the global best matrix and the position matrix X.In this moment there are known the all operations and data structures required to implement the PSO algorithm from Figure 3. Themain drawback is that in some cases of complex benchmarks with high number of vertices and edges, the algorithm does notconverge to a solution in a reasonable time. Our tests have shown that not all the benchmarks passed (providing a coloringsolution) like in the genetic algorithm case. At the end of the execution, if PSO converges, the existing coloring solution isexported into a text file together with the adjacency matrix of the graph. A solution developed to solve the premature convergenceproblem of the standard PSO was proposed in [21] but the implementation of this accelerated PSO algorithm in our applicationis beyond the scope of this paper.Journal of Multimedia Processing and Technologies Volume 8 Number 3 September 201781
3.3 The ViewerThe graphical visualization application will use as input file the solution generated by the genetic algorithm. The structure ofsuch a file is illustrated in Figure 5. The first line shows the coloring solution: the color index for each vertex. The rest of the linesare containing the adjacency matrix of the colored graph, where A [i, j] 1 if there is an edge between i and j andA [i, j] 0 if thevertices i and j are not connected.Figure 6 illustrates how a certain coloring solution is graphically visualized. The colors are randomly selected from the Colorstructure of System. Drawing. The positions of the vertices are computed depending on their number. For large graphs, thepositions of the vertices are randomly generated. For relatively small graphs, the vertices are positioned on a circle whose centeris in the center of the visualization form and its radius is the half of the height of the visualization form.Figure 5. Coloring Solution ExampleFigure 6. A visualized coloring solutionWe used the parametrical equation of the circle:x a r . cos ty b r . sin t(7)where x and y are the obtained coordinates on the circle with radius r and center in the point (a, b) and t is the angle between thex-axis and the radius connecting (x, y) wdith (a, b). For drawing we used the methods from the Graphics class.3.4 Interference Graph GenerationThis application prepares the input data for the genetic algorithm. The interference graph is a graph associated to the C code.Each variable has a corresponding vertex in the interference graph. Two vertices are linked by an edge if the correspondingvariables are simultaneously alive. The adjacency matrix is exported to a file which will be used by the genetic algorithm.82Journal of Multimedia Processing and Technologies Volume 8 Number 3 September 2017
3.5 The Graphical InterfaceThe highly parameterized graphical interface (see Figure 7) combines all the previously described components. It allows toconfigure the parameters of the GA and PSO and to define the problem which must be solved. The user can view in real time theprogress of the algorithm and its convergence through a graphic presenting the best fitness value which is updated in eachiteration.Figure 7. User interface for configuring the GA and PSO solving the Graph Coloring Problem3.6 The DatabaseWe have also introduced an online database in order to keep the simulation results on the server for further analysis. Thus,searching the optimal parameters for the genetic algorithm is a simple process. This functionality is available only for the resultsobtained on the DIMACS benchmarks. At the end of the simulation the Save Results to Database button becomes usable. Thisbutton opens a dialog where the user can introduce data about the workstation and a name for the possibility to filter andanalyze only the own results. The details about the workstation (memory size, number of cores and processor frequency) areimportant for the relevance of the results.For this functionality we have created two classes: DbConnection and DbRepo. The DbConnection class is responsible with theconnection to the database and also with the maintenance of the database. For a connection to the database, we need aConnection String containing the address of the database server, the name of the database and the user authentication details(name and password) defined in SQL Server. The DbRepo class contains the methods which are inserting the data through acommand created with given parameters. The command is executed on SQL server, adding thus the data into the correspondingtables. The procedures which insert data about the benchmark, workstation and the parameters of the genetic algorithm are notallowing duplicate entries.The experimental results can be visualized through a web application developed in ASP.NET MVC, hosted on the same serverwhere the database is. Its client side, visible from browsers, is represented by the View developed using HTML, CSS, JavaScriptand Razor. For the design (CSS) and client-side script (JavaScript) we used the Bootstrap framework and the Bootstrap-Tablelibrary which provides searching, sorting, filtering and exporting functionalities. For the database we have used Entity Frameworkwhich is a relational object mapper, allowing the .Net developers to use C# specific objects in relational databases. A usefulproperty is the possibility to retrieve together objects linked through foreign key. The server side contains a controller whichtakes the requests of the client, gets the data from the database using Entity Framework and sends them to the View componentto be shown in the browser. In order to load the application on the server, the following steps are necessary: IIS (InternetInformation Services) must be installed; a new site must be added using IIS Manager for which a port and the file paths must bespecified; the site must be created in Application Pool, a group of applications running on the web server. The application ishosted on a server and is accessible at http://193.226.29.23:4040. Figure 8 presents the graphical interface of the applicationwhich collects and shows the simulation results. It allows sorting, searching, refreshing, filtering, exporting and differentvisualization possibilities.Journal of Multimedia Processing and Technologies Volume 8 Number 3 September 201783
Figure 8. The Database3.7 ParallelizationSince evolutionary algorithms exhibit the feature to be embarrassingly parallel problems, requiring little or no effort to separatethe problem into a number of parallel tasks, we parallelized the process of generating new individuals for next generation, withthe help of the genetic operators such as crossover and mutation. This is possible using the Parallel class from .NET framework(System.Threading.Tasks namespace) that contains specific implementations of for and foreach loops using multiple threads. A“Task” object is asynchronously running on a thread of the thread pool. This thread pool allows more efficient use of threadsand, hence, of the resources, because they are managed by the system. Actually, the Task scheduler partitions the task basedon system resources and workload. When possible, the scheduler redistributes work among multiple threads and processors ifthe workload becomes unbalanced.Figure 9 illustrates how parallelization works. The NewSolution function, which has as argument the population of solutions,applies the parents’ selection operator, and then creates a new solution combining the two parents according to the crossoverand mutation operators. After completing all the running tasks, the solutions will be added to the new population.Figure 9. Implementing the Parallelization84Journal of Multim
Technology (INTECH 2016) [1], by presenting some features added to our developed software tool like new heuristics in solving graph coloring problem, results centralization in online database and remote visualization on server. It will facilitate further analysis and finding optimal control parameters of evolutionary algorithms.