Transcription
INTERPRETING CGM DATARichard M. Bergenstal, MDExecutive DirectorInternational Diabetes CenterPark Nicollet and HealthPartners InstituteMinneapolis, MNDISCLOSURES I have participated in clinical research, been a member of ascientific advisory board, or served as a consultant for AbbottDiabetes Care, Dexcom, Eli Lilly and Company, Hygieia, Johnson &Johnson, Medtronic, Novo Nordisk, Onduo, Roche, Sanofi, andUnited HealthCare. I have been a stock shareholder in Merck. I am a volunteer for the American Diabetes Association and JDRF. My institution receives National Institutes of Health funding forclosed-loop studies. My employer, the nonprofit HealthPartners Institute, contracts formy services, and I receive no personal income from these activities.June 22, 20182INTERPRETING CGM DATAUsing CGM data to guide: Starting and adjusting diabetes medications Establishing a therapeutic action plan A plan to:TIR and Use CGM to:TIHypoA1C andJune 22, 2018TIHypo3
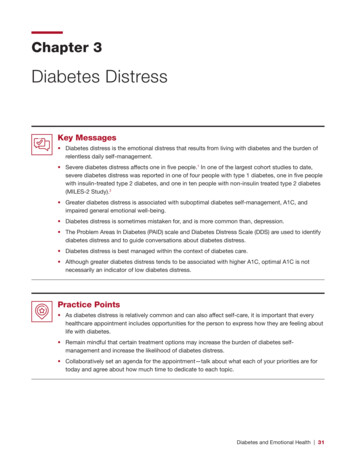
Daily Glucose ViewsCGM MetricsAGP:Patterns12 Pages
24Pages12Pages
June 22, 201811June 22, 201812
CONTINUOUS GLUCOSE MONITORING—AMBULATORY GLUCOSE PROFILECGM—AGPONE CASE Metrics: definitions and targets AGP patterns: 9 steps to agree on amanagement plan– Daily views: refining the management planJune 22, 201813June 22, 201814June 22, 201870-180 7015 180
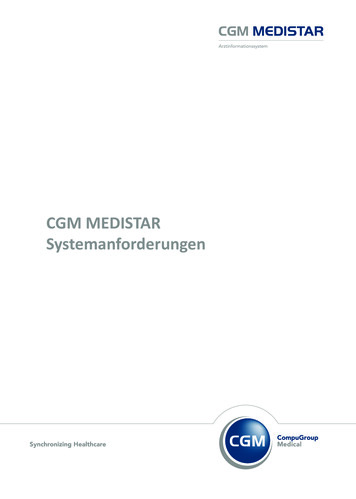
June 22, 201816June 22, 201817CGM MetricsOptimal Sampling Duration for Continuous Glucose Monitoringto Determine Long-Term Glycemic ControlRiddlesworth TD, Beck RW, Gal RL, et al. Diabetes Technol Ther. 2018;20:314–316.R20.84 - 0.8614June 22, 201818
CGM MetricsJune 22, 20181933 Individuals without diabetes (CGM Normal Study )most studiesAG is99–100 mg/dLin normalsMazze RS, Strock E, Wesley D, et al. Diabetes Technol Ther. 2008;10:149–159.June 22, 201820Insert Date21CGM Metrics?
June 22, 201822June 22, 201823June 22, 201824Estimated A1C(eA1C)7.7%(61 mmol/mol)GlucoseManagementIndicator(GMI) *7.7%(61 mmol/mol)*GMI proposed to FDA and diabetescommunity to replace eA1C
Level 2 hyperglycemiaLevel 1 hyperglycemia(Hypoglycemia Alert)Level 1 hypoglycemia4%6%Level 2 hypoglycemia(Immediate Action)25June 22, 2018Advanced Technology670G HCL Data5%20%25%72%2%1%4%6%HCL, hybrid closed-loop.June 22, 2018Bergenstal RM, Garg S, Weinzimer SA, et al. JAMA. 2016;316:1407–1408.72%3%26TIME IN RANGE AND A1C CORRELATIONMeasuredTIR40%A1C95% CI8.1%7.1-9.1%Δ 0.4%50%7.7%Δ 0.4%60%7.3%Δ 0.4%70%6.9%Δ 0.4%80%6.5%6.7-8.7%6.3-8.3%5.9-7.9%5.5-7.5%R. Beck, personal communication; secondary analysis of data from Beck RW, Connor CG, Mullen DM, Wesley DM,Bergenstal RM. Diabetes Care. 2017;40:994–999.June 22, 201827
Does Time-in-Range Matter? Perspectives From People WithDiabetes in the Success of Current Therapies and theDrivers of Improved OutcomesRunge AS, Kennedy L, Brown AS, et al. Clin Diabetes. 2018;36:112–119.June 22, 201828June 22, 201829GlucoseManagementIndicator(GMI) *7.7%(61 mmol/mol)**GMIGMIproposedproposedtotoFDAFDAand& DiabetesdiabetesCommunitycommunity to replacereplace eA1ceA1CMEASURES OF GLUCOSE VARIABILITYStableStableGlucose ProfileGlucose Profile 36%SD AG/3Monnier L, Colette C, Wojtusciszyn A, et al.Diabetes Care. 2017;40:832–838.June 22, 2018Hirsch IB, Amiel SA, Blumer IR, et al.Diabetes Technol Ther. 2012;14:973–983.30
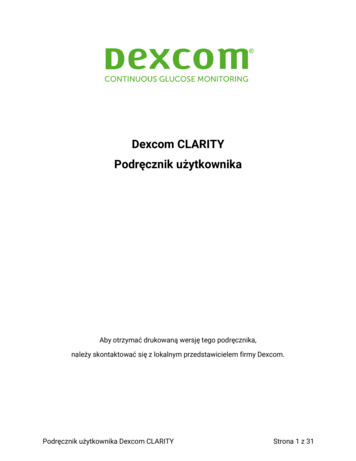
NINE STEPS TO INTERPRETING AN AGPDaily Glucose SummaryGlucoseManagementIndicator(GMI) *7.7%June 22, 2018Carlson AL, Mullen DM, Bergenstal RM. Clinical use ofcontinuous glucose monitoring in adults with type 2 diabetes.Diabetes Technol Ther. 2017;19(Suppl. 2):S4–S11. 31Interpretingan AGP:Nine Steps GlucoseManagementIndicator(GMI) *Step 1: Check foradequate data.7.7%June 22, 2018 32Step 2: Mark up the AGP, noting factors that mayaffect the management plan. MetforminDegludecLisproW Bx xlxDxsnack711581,000 mg20 U10 UBT1,000 mg8U12 U201862 yo. ;T2D for 15 yrs.; No hx. Juneof 22,knownCVD; 90 kg; eGFR 6033
Step 3: Ask the patient “What do you see?” Listen.5%20% 72%MetforminDegludecLisproW Bx xlxDx71151,000 mgBT2%snack81%1,000 mg20 U10 U4%6%8UCorr.Factor12 U62 yo. ;T2D for 15 yrs.; No hx. ofknown CVD; 90 kg; eGFR 60June 22, 201834Step 4: Look for patterns of low glucose levels. 1MetforminDegludecLisproW Bx xlxDxsnack711581,000 mgBT1,000 mg20 U10 U8U12 U62 yo. ;T2D for 15 yrs.; No hx. of known CVD; 90 kg; eGFR 60June 22, 201835Step 4: Look for patterns of low glucose levels.Treat the CLOUD! 1MetforminDegludecLisproW Bx xlx2 Dxsnack71,000 mg16 20 U1151,000 mg88U12 UCorr.Factor10 UBTJune 22, 201862 yo. ;T2D for 15 yrs.; No hx. ofknown CVD; 90 kg; eGFR 60CF36
Step 4: Look for patterns of low glucose levels.Treat the CLOUD! W Bx x1lxMetforminDegludecLispro2 Dx51171,000 mg16 20 UBTsnack81,000 mg8U10 Upremeal12 UCFCorr.FactorCFJune known22, 201862 yo. ;T2D for 15 yrs.; No hx. ofCVD; 90 kg; eGFR 60 38Step 5: Look for patterns of high glucose levels.21 MetforminDegludecLisproW Bx xlxDx71,000 mg16 20 U1151,000 mg88U12 UCorr.Factor10 UpremealCF?13BTsnackJune 22, 201862 yo. ;T2D for 15 yrs.; No hx. ofknown CVD; 90 kg; eGFR 60CF39
Step 6: Look for areas of wide glucose variability.GV is about timing or amount Timing: insulin and meals, weekday and weekend, snacks, exercise, stress Amount: insulin (daily dose or carb counting), insulin:carb ratio, exercise intensityGV MetforminDegludecLisproW Bx xlx71,000 mg16 20 U1151,000 mg88U12 UCorr.Factor10 UpremealCFDx?13BTsnackCFJune 22, 201862 yo. ;T2D for 15 yrs.; No hx. ofknown CVD; 90 kg; eGFR 60 40Step 7: Compare to past AGP and reinforce successful strategies. 4%6%MetforminDegludecW Bx xlxDxsnack711581,000 mg16 20 ULispro10 UBT1,000 mg8UpremealCF12 U?13Corr.FactorCFJune 22, 201862 yo. ;T2D for 15 yrs.; No hx. ofknown CVD; 90 kg; eGFR 60 41Step 8: Agree on an action plan with patient.15%Action Plan:31%1. Get rid lows overnight:long-acting insulin correction factor2. Reduce variability: insulin timing, amount of food, consider carb counting 3. As you treat the cloud, remember to look forward 12–18 hours forsecondary effects on glucose4. As you treat lows first, small or no in TIR initially so schedule repeatlook at 2-week profile soon to address highs (series of 3–4 adjustments)50%5. Continue using CGM (real-time or retrospective intermittently)3%1% If real-time CGM: also teach how to use trend arrowsW BlDBTx xxxsnack4%6%MetforminDegludecLispro71,000 mg11581,000 mg16 20 U10 Upremeal8UCF12 U?13Corr.FactorJune 22, 201862 yo. ;T2D for 15 yrs.; No hx. ofknown CVD; 90 kg; eGFR 60CF42
MetforminDegludecLisproStep 9: Copy the AGP for the patient and the EMR.W Bx xlxDxsnack711581,000 mg16 20 U10 UpremealBT1,000 mg8UCF12 UCorr.FactorJune 22, 201862 yo. ;T2D for 15 yrs.; No hx. ofknown CVD; 90 kg; eGFR 60CF43Thank YouJune 22, 201844
INTERPRETING CGM DATA Richard M. Bergenstal, MD Executive Director International Diabetes Center Park Nicollet and HealthPartners Institute Minneapolis, MN June 22, 2018 2 I have participated in clinical research, been a member of a scientific advisory board, or served as a consultant for Abbott