Transcription
Airglow and Aurorae at Dome A, AntarcticaAuthor(s): Geoff Sims, Michael C. B. Ashley, Xiangqun Cui, Jon R. Everett, LongLong Feng,Xuefei Gong, Shane Hengst, Zhongwen Hu, Jon S. Lawrence, Daniel M. Luong-Van, Anna M.Moore, Reed Riddle, Zhaohui Shang, John W. V. Storey, Nick Tothill, Tony Travouillon, LifanWang, Huigen Yang, Ji Yang, Xu Zhou and Zhenxi ZhuReviewed work(s):Source: Publications of the Astronomical Society of the Pacific, Vol. 124, No. 916 (June 2012),pp. 637-649Published by: The University of Chicago Press on behalf of the Astronomical Society of the PacificStable URL: http://www.jstor.org/stable/10.1086/666861 .Accessed: 09/08/2012 00:08Your use of the JSTOR archive indicates your acceptance of the Terms & Conditions of Use, available at ms.jsp.JSTOR is a not-for-profit service that helps scholars, researchers, and students discover, use, and build upon a wide range ofcontent in a trusted digital archive. We use information technology and tools to increase productivity and facilitate new formsof scholarship. For more information about JSTOR, please contact support@jstor.org.The University of Chicago Press and Astronomical Society of the Pacific are collaborating with JSTOR todigitize, preserve and extend access to Publications of the Astronomical Society of the Pacific.http://www.jstor.org
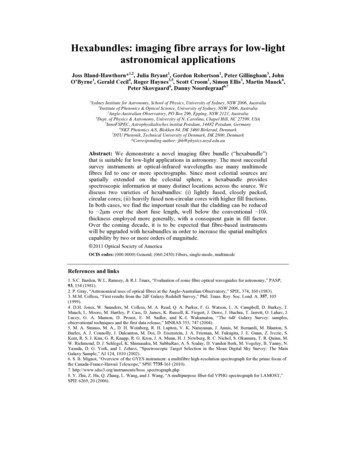
PUBLICATIONS OF THE ASTRONOMICAL SOCIETY OF THE PACIFIC, 124:637–649, 2012 June 2012. The Astronomical Society of the Pacific. All rights reserved. Printed in U.S.A.Airglow and Aurorae at Dome A, AntarcticaGEOFF SIMS,1 MICHAEL C. B. ASHLEY,1 XIANGQUN CUI,2 JON R. EVERETT,1 LONGLONG FENG,3,4 XUEFEI GONG,2,4SHANE HENGST,1 ZHONGWEN HU,2,4 JON S. LAWRENCE,5,6 DANIEL M. LUONG-VAN,1 ANNA M. MOORE,7REED RIDDLE,7 ZHAOHUI SHANG,4,8 JOHN W. V. STOREY,1 NICK TOTHILL,9 TONY TRAVOUILLON,7LIFAN WANG,3,4,10 HUIGEN YANG,4,11 JI YANG,3 XU ZHOU,4,12 AND ZHENXI ZHU3,4Received 2012 April 26; accepted 2012 May 22; published 2012 June 15ABSTRACT. Despite the absence of artificial light pollution at Antarctic plateau sites such as Dome A, otherfactors such as airglow, aurorae, and extended periods of twilight have the potential to adversely affect opticalobservations. We present a statistical analysis of the airglow and aurorae at Dome A using spectroscopic data fromNigel, an optical/near-IR spectrometer operating in the 300–850 nm range. These data complement photometricimages from Gattini, a wide-field (90 ) CCD camera with B, V , and R filters, allowing the background sky brightness to be disentangled from the various airglow and auroral emission lines. The median auroral contribution to theB, V , and R photometric bands is found to be 22.9, 23.4, and 23:0 mag arcsec 2 , respectively. Auroral emissionsmost frequently occur between 10–23 hr local time, when up to 50% of observations are above airglow-level intensities. While infrequent, the strongest emissions detected occurred in the hours just prior to magnetic midnight.We are also able to quantify the amount of annual dark time available as a function of wavelength, as well as in thestandard BV R photometric bands. On average, twilight ends when the Sun reaches a zenith distance of 102.6 .Online material: color figures2010), minimal cloud cover and a dark sky background in the iband (Zou et al. 2010), and an exceedingly low atmosphericwater vapor content (Sims et al. 2012). Among the site properties yet to be quantified at Dome A are the optical sky brightnesscontributions from airglow and aurorae; the latter have thepotential to severely affect optical and near-IR astronomicalobservations. Numerous studies have speculated on their contributions (e.g., Dempsey et al. 2005; Kenyon & Storey 2006;Saunders et al. 2009), but until now, no ground-based measurements from the Antarctic plateau have been reported in anastronomical context.At any location, and in the absence of aurorae, airglow is thedominant component of optical and near-IR night sky brightness (Benn & Ellison 1998). Airglow is caused by a chain ofevents beginning with the dissociation of molecules by daytimesolar UV radiation, followed by chemical reactions that produceexcited states that decay with the emission of photons. Spectrally, airglow consists of a weak continuum in the blue (the O2Herzberg bands) and in the green (from NO2 emissions), as wellas stronger emissions predominantly from neutral atomic oxygen, [O I] (557.7, 630.0, and 636.4 nm), and hydroxyl radicals(the OH Meinel band; from 600–4500 nm).Occurring at similar heights and also being similarly emittedby excited atoms and molecules, the aurora is driven by a completely different mechanism: collisions with energetic particles(mainly electrons) originating from the solar wind, which havebeen directed along the Earth’s magnetic field lines. As with the1. INTRODUCTIONLocated at the highest point on the Antarctic plateau, Dome Ais considered one of the best sites for optical, infrared (IR), andsubmillimeter astronomy on Earth. Following the installation ofthe robotic Plateau Observatory (PLATO; Yang et al. 2009;Lawrence et al. 2009) in 2008 by the 25th Chinese NationalAntarctic Research Expedition, a number of predictions aboutthe site quality have been confirmed: site testing results havedemonstrated an atmospheric boundary layer confined veryclose to the ground (Bonner et al. 2010), exceptional stabilityand transparency in the terahertz-frequency regime (Yang et al.1School of Physics, University of New South Wales, Sydney NSW 2052,Australia; g.sims@unsw.edu.au.2Nanjing Institude of Astronomical Optics & Technology, Nanjing 210042,China.3Purple Mountain Observatory, Nanjing 210008, China.4Chinese Center for Antarctic Astronomy, China.5Department of Physics and Astronomy, Macquarie University, Sydney NSW2109, Australia.6Australian Astronomical Observatory, Sydney NSW 1710, Australia.7Caltech Optical Observatories, Pasadena, CA 91125.8Tianjin Normal University, Tianjin 300074, China.9University of Western Sydney, Sydney NSW, Australia.10Department of Physics and Astronomy, Texas A&M University, CollegeStation 77843.11Polar Research Institute of China, Shanghai 200136, China.12National Astronomical Observatories, Chinese Academy of Science,Beijing 100012, China.637
638SIMS ET AL.airglow, these collisions give rise to a host of emission lines. Theblue region (U and B bands) is dominated by the N2 secondpositive (2P) and Nþ2 first negative (1N) bands, while in thegreen region (V band), the strongest emission is that of atomicoxygen (557.7 nm). Redward of 650 nm, the R and I bandscontain a quasi-continuum contribution predominantly fromthe N2 first positive (1P), Nþ2 Meinel (M), and O2 atmospheric(ATM) bands (Gattinger & Jones 1974; Jones & Gattinger1975).A comparison of a typical airglow and auroral spectrum ispresented in Figure 1. Of particular interest is the [O I] 557.7 nmemission, which dominates the V band in both phenomena.Indeed, the constant presence of this line prompted the useof terminology such as the permanent (Yntema 1909) ornonpolar (Rayleigh 1924) aurora for what is now commonlyknown as airglow. Accordingly, an auroral event cannot be confirmed based on the existence of this line alone. While the forbidden transition that emits the 557.7 nm photon is the same inboth cases (see eq. [4]), the production of excited atomicoxygen, Oð1 SÞ, that precedes the emission is different. Duringthe aurora, excitation to Oð1 SÞ occurs directly via fast collisionswith energetic particles (Chamberlain 1961).In contrast, and as explained, e.g., in Shepherd et al. (1997),the [O I] 557.7 nm airglow emission begins with the initial dissociation of O2 molecules by solar UV radiation. With long lifetimes in the upper atmosphere (hours to days), the dissociatedFIG. 1.—Synthetic airglow (middle) and auroral (bottom) spectrum, displayed at 1.5 nm resolution, showing typical intensities (in kilorayleighs) of dominant emissions in the 300–850 nm range. Wavelength identifications are in nanometers. Airglow emissions and intensities are from Meinel (1950a, 1950b) and Kvifte (1959).Auroral emissions and intensities are from Gattinger & Jones (1974) and Jones & Gattinger (1975) and represent an IBC III auroral event (normalized to an [O I]557.7 nm intensity of 100 kR). Note the different scales used on the y-axes; the [O I] 557.7 nm emission is 400 times greater in an IBC III aurora than it is in the typicalairglow. Curves on the upper plot show the normalized UBV RI photometric passbands. See the electronic edition of the PASP for a color version of this figure.2012 PASP, 124:637–649
AIRGLOW AND AURORAE AT DOME A, ANTARCTICA639FIG. 2.—Raw Nigel image showing a bright aurora, taken on 2009 June 25 at 22:50 UT. The brightest emission lines are labeled (units are in nanometers). The sixspectra represent blue and red optimized pairs from three directions on the sky.oxygen atoms can be transported globally before recombination, explaining why the airglow is present at high latitudeseven during the long polar winters. A two-step energy transferprocess ensues, first involving a third molecule designated asM (usually N2 ), to produce an excited oxygen molecule,O 2 . This excited molecule subsequently transfers its energyto O, leading to the excited state, Oð1 SÞ, and the forbidden557.7 emission. The entire process is presented below:O2 þ hνðsolar UVÞ O þ O;(1)O þ O þ M O 2 þ M;(2)O 2 þ O O2 þ Oð1 SÞ;(3)Oð1 SÞ Oð1 DÞ þ hνð557:7 nmÞ:(4)Airglow emissions usually have a relatively small range ofintensities, compared with auroral emissions that can range overfactors of 1000 or more. Typical intensities, in rayleighs,13 weredescribed by Chamberlain (1961): 250 R for airglow; 1 kR foran aurora comparable with the brightness of the Milky Way;10 kR for an aurora equivalent to the brightness of thin moonlitcirrus cloud; 100 kR if equivalent to the brightness of moonlitcumulus clouds; and 1000 kR if providing total illumination (atthe ground) equivalent to full moonlight. These four somewhatbroad “classes” of aurorae are designated by internationalbrightness coefficients (IBCs) of I, II, III, and IV, respectively.In this article, we briefly review the variability of airglow andaurorae, and we use spectroscopic observations to examine theircontribution to sky brightness at Dome A in the BV R photometric bands, as well as the characteristics of their nocturnalfluctuations. We are also able to investigate the amount ofannual dark time as a function of wavelength—an importantconsideration given the extended periods of twilight that occurat polar latitudes.2. REVIEW OF AIRGLOW AND AURORAEVARIABILITYAlthough the purpose of this article is not to account for observed variations in airglow and aurorae, it is useful to reviewthe spatiotemporal fluctuations of both phenomena to providesome context for the observations.Airglow varies on both short and long timescales: atmospheric gravity waves are responsible for fluctuations on timescales of minutes (e.g., Li et al. 2011); solar tides producediurnal (e.g., Brenton & Silverman 1970; Fukuyama 1976) andsemiannual (e.g., Deutsch & Hernandez 2003) oscillations; andthe solar cycle causes decade-scale variations, with sky brightness typically being 0.4 mag brighter during solar maximum(Krisciunas 1997; Patat 2008), with the 10.7 cm solar radio fluxcommonly used to measure the level of solar activity (e.g.,Walker 1988). Temporal fluctuations also display a complexdependence on geographic latitude (e.g., Forsyth & Wraight1987). Nightly variations of the overall sky brightness areusually low ( 0:1 mag; Benn & Ellison 1998) but canoccasionally be much higher (up to 0.7 mag; Patat 2008).Unlike airglow, which occurs globally, aurorae are generallyconfined to a region known as the auroral oval, an oval-shapedannulus centered on the geomagnetic poles. It has long beenrecognized that this region varies in size and shape with bothgeomagnetic activity (Feldstein & Starkov 1967) and southwardcomponent of the interplanetary magnetic field (IMF;Holzworth & Meng 1975). Simmons (1998) has reviewed thevarious types of aurora and their dependence on geomagneticlatitude, magnetic local time (MLT),14 and the mechanism ofproduction. In the vicinity of the auroral oval, magnetic substorms occur frequently with a maximum just prior to magneticmidnight (Simmons 1998; Akasofu 2010). While auroral activity at locations between the equator and the auroral oval iscorrelated with solar cycle, the situation inside the auroral oval(or polar cap) is more complicated. Here, even in the strongestmagnetic storms, visual aurorae are often not observed(Sandford 1961). Two broad classes of aurorae occur in these14131 R 106 4π phot s 1 cm 2 sr 1 1:24 107 λðmÞ μJ arcsec 2 .2012 PASP, 124:637–649MLT is defined as the hour angle between the geomagnetic meridianthrough the site and the direction away from the Sun (see review by von Biel1990).
640SIMS ET AL.regions: discrete (having structure) and diffuse (widespread;filling most of the sky).Discrete polar cap aurorae display two intensity maxima: oneat 22–24 hr MLT with an occurrence frequency proportional tomagnetic activity and another at 09–10 hr MLT, which is anticorrelated with magnetic activity (Hartz & Brice 1967; Sandford1968). Two subsets of discrete polar aurora include polar caparcs and polar cap patches. Polar cap arcs occur during quietmagnetic activity and northward IMF (Zhu et al. 1997) andare 4 times more common in magnetic dawn than dusk(Hosokawa et al. 2011), while polar cap patches exhibit a maximum at 23 hr MLT with intensities several times that of airglow(typically 1 kR; McEwen & Harrington 1991; Moen et al. 2007).Diffuse aurora are usually subvisual and include the followingsubclasses: polar glow and polar rain. The polar glow is caused bybombardment by high-energy protons and alpha particlesfollowing large solar flares, and it may last for up to 3–4 days(Sandford 1962), which causes major enhancements to theN2 1N, 1P, and 2P bands (Simmons & Henriksen 1995). The intensity maxima of polar glow occurs at 18–24 hr MLT (Simmons1998). Polar rain, caused by the constant bombardment of lowerenergy particles from the solar wind (Winningham & Heikkila1974), is dependent on solar cycle (Gussenhoven & Madden1990) and IMF (Newell et al. 2009). The energy flux of thelower-energy particles is generally weak, with stronger eventsoccurring a few times annually (Newell et al. 2009).As a general remark, Sandford (1964) reports that 75–85% ofemissions at high magnetic latitudes are attributable to nonvisual aurorae and that even during quiet magnetic conditions,the Nþ2 391.4 nm line shows measurable ( 100 R) intensities.As an example of subvisual auroral intensities (and excludingthe airglow component), Vorobjev et al. (2008) have reportedisolated observations of 100–300 R and 200–500 R in the[O I] 557.7 and 630.0 nm lines, respectively.3. OBSERVATIONS AND DATA REDUCTIONThe data sets used in this article were acquired during 2009using two instruments at Dome A. The first and primary instrument is a spectrometer named Nigel operating in the optical tonear-IR (300–850 nm) spectral regime (Sims et al. 2010). Nigelcontinuously records spectra of the daytime, twilight, and nightsky using optical fibers with no additional optics. The field ofview (FOV) is therefore determined solely by the numericalaperture (NA) of the fibers; in our case the NA is 0.22, whichgives rise to a 25 diameter FOV. At 500 nm the achieved resolution is approximately 3 nm FWHM with 0:6 nm pixel 1 .Although Nigel collects spectra from three fixed directions onthe sky, for this analysis we consider only data obtained fromthe zenith direction. Exposure times are set automaticallydepending on the flux and vary from 1 s when the Sun is abovethe horizon to 512 s during the dark winter nights.The second instrument, used in this context primarily as acalibrator for Nigel, is a CCD camera (Apogee Alta U4000)FIG. 3.—Raw Gattini image (100 s exposure in V , taken on 2009 July 20 at01:55 UT) showing the approximate area of Nigel’s zenith field of view. Thecross marks the position of the south celestial pole. The streak through the imageis a satellite trail. Other distinguishing features include the Large and SmallMagellanic Clouds (right-hand edge of the Nigel field); the Southern Crossand pointers (left-hand side above center); and the bright star Canopus (upperright).coupled to a 90 fisheye lens, named Gattini (Moore et al.2010). The camera has a 2048 2048 array of 7:4 μm2 pixels.Included with the camera is a set of Bessell B, V , and R photometric filters, as well as a long-pass red filter to detect OHemissions. Gattini also contains a “dark” filter, which enablesbias and dark frames to be taken despite the use of a shutterlessinterline CCD. The image scale of Gattini in the zenith direction averages 148″ per pixel over the equivalent Nigel FOV.Exposure times on Gattini are set in a similar fashion to Nigel,but are fixed during winter when consecutive exposures of 30 sand 100 s are taken for each filter.The Nigel reduction pipeline is as follows (note that becauseof shutterless operation of the CCD camera, no bias or darkframes are taken). First, the images are bias-subtracted using themedian value from a four-column overscan region to estimateTABLE 1PHOTOMETRIC ZERO POINTSFORVARIOUS PASSBANDSFilterNo. starsm0B .V .R .1513911.0 0.111.3 0.110.9 0.1NOTE.—The error listed is 1σ.2012 PASP, 124:637–649
AIRGLOW AND AURORAE AT DOME A, ANTARCTICA641FIG. 4.—Nigel-Gattini relationship for the B, V , and R passbands. The data shown span both twilight and night time observations (solar zenith distance ranges of95.5–115.0 ). See the electronic edition of the PASP for a color version of this figure.the bias contribution. Following bias subtraction, an empiricalrelationship between dark current and CCD temperature iscreated by examining nonspectra pixels from images at varioustemperatures; this dark current is subsequently subtracted fromeach pixel. Next, a cosmic-ray removal algorithm (Pych 2004) isemployed to remove hot pixels. The parameters of the Pychalgorithm were carefully chosen to make sure no emission lineswere erroneously detected as hot pixels or cosmic rays. Thespectra were then extracted using optimal spectral extraction(a Gaussian mask in the cross-spectral direction) and normalized to the exposure time. A sample raw image, prior to spectralextraction, is shown in Figure 2. The emission lines have lowsignal-to-noise ratios (S/N), limited by quantization noise. Asecond, more aggressive, cosmic-ray removal algorithm (vanDokkum 2001) was then employed to remove cosmic rays.Finally, the spectra were corrected for the expected instrumentalresponse of the system (Sims et al. 2010). A small fraction(0.5%) of images were excluded as a result of glitches in thealgorithm that selected exposure times. The total number ofimages available for analysis is 54,936, of which 20% weretaken during times when the Sun was more than 15 belowthe horizon.A more basic reduction process is used with the Gattiniimages, consisting solely of bias subtraction and exposure timenormaliziation. As with Nigel, a single bias value is determinedfor each image using the overscan region. A small exposuretime offset (þ0:0025 s) is added prior to exposure time normalization, as a suspected electronic delay causes the exposure timeto be slightly longer than what is recorded in the FITS header. Anumber of images taken early in the year, known to be affectedFIG. 5.—Overview of Nigel and Gattini images during 2009, showing the total number of images (top) and cumulative exposure time (bottom). The Gattini numbersinclude ice-affected exposures and calibration frames. Gaps in the data represent times when either the instruments or computers were temporarily offline.2012 PASP, 124:637–649
642SIMS ET AL.FIG. 6.—Sample Nigel data showing an airglow spectrum (top) and a bright auroral event (bottom). The airglow spectrum is a median combine of over 7000observations to increase the S/N.by ice accumulation on the lens, were excluded from furtheranalysis. The total number of Gattini images available foranalysis is 74,471. Figure 3 shows a raw Gattini image withthe expected Nigel FOV overlaid.4. PHOTOMETRIC CALIBRATION AND ERRORSTo achieve photometric calibration on the Gattini images,aperture photometry was performed on a number of stars usingIRAF. With stars brighter than magnitude 2 showing signs ofsaturation, the magnitude, m, of stars selected for photometrywas confined to 2 m 5. In this preliminary analysis, whichis done purely to provide a calibration for Nigel, no air-mass orflat-field corrections were applied (this will be followed up by amore thorough analysis in a subsequent article; Yang et al. 2012,in preparation). Instrumental magnitudes, mi , were calculatedfor each star on each image, according to f star f skymi ¼ 25–2:5 log10;(5)texpwhere f star and f sky are the star and sky fluxes, respectively, andtexp is the exposure time. With typically 2000 observations inwhich each star was accurately measured, the stars’ overallinstrumental magnitudes were calculated by choosing thebrightest 10th percentile value—intentionally biased towardbright observations to give a better estimate for the star’s brightness in the absence of cloud, aurora, etc. The photometric zeropoint, m0 , was determined by comparing each star with itscatalog magnitude, with the final estimate being the mean ofall results. Table 1 gives the values of and errors in m0 for eachpassband.FIG. 7.—Probability histograms showing the sky brightness contributionsfrom the brightest emission lines in each photometric band. The B band includesNþ2 391.4 and 427.8 nm; the V band consists of [O I] 557.7 nm; and the R bandincludes [O I] 630.0 and 636.4 nm. See the electronic edition of the PASP for acolor version of this figure.2012 PASP, 124:637–649
AIRGLOW AND AURORAE AT DOME A, ANTARCTICATABLE 2QUARTILE VALUES OF DOMINANT EMISSION-LINECONTRIBUTIONS TO SKY BRIGHTNESS IN BV RPHOTOMETRIC BANDSFilterBVR.Best 25%MedianBest ts are mag arcsec 2 .With the photometric zero point determined, the surfacebrightness, b, in the B, V , and R bands can be determinedfor any arbitrary part of a Gattini image usingb ¼ m0 2:5 log10 f ðN f bias Þ;Np2 texp(6)where f is the total flux in the region under consideration, N isthe area of the region in pixels, f bias is the bias per pixel, and p isthe image scale in arcsec pixel 1 .In order to apply the photometric calibration to the Nigelspectra, each Nigel spectrum was multiplied with B, V , andR filter profiles and integrated to simulate the variouspassbands. These were compared with the flux obtained fromcontemporaneous Gattini images over the expected NigelFOV. The Nigel fluxes for each filter had been interpolated tomatch the epoch of the Gattini images. Figure 4 shows the results for each filter. The correlation coefficients were all greaterthan 0.99. A comparison of the temporal distribution and totalintegration times of Nigel and Gattini is given in Figure 5.5. AIRGLOW AND AURORAL CONTRIBUTIONSTO SKY BRIGHTNESSTo investigate the intensities of the airglow and auroraeduring “night” time, a subset of the Nigel data in which the643Sun was below 13 was selected for use. Each of these12,786 spectra were multiplied with B, V , and R filter profiles,and the intensities of some dominant emissions were then measured: Nþ2 (391.4 and 427.8 nm) and [O I] (557.7, 630.0, and636.4 nm). The uncalibrated intensities were converted into magarcsec 2 (see § 4). A small number of lines (0.5% of 391.4 and427.8 nm; 4% of 557.7 nm; and 3.5% of 630.0 and 636.4 nm)were unable to be measured, most likely as a result of beingtoo weak.Two sample spectra, representing a typical airglow spectrumand strong auroral display, are shown in Figure 6. Difficulties insplicing together the calibrated BV R portions of the spectraprevent an absolute scale being used over the entire wavelengthinterval. The arbitrary scale is normalized to the [O I] 557.7 nmline in the airglow spectrum in both cases; hence, the relativeintensity between the plots is correct. Most of the featuresidentified in the synthetic spectra (Fig. 1) are visible and are ingood agreement with typical predicted intensity ratios, althoughthe pseudocontinuum redward of 600 nm in the auroral spectrum appears significantly weaker than expected. The intensityof the [O I] 557.7 nm line in the auroral spectrum is approximately 21 kR.The airglow spectrum, which was produced by finding themedian value of each pixel from more than 7000 dark skyobservations, contains some surprising features: the apparentpresence of N2 2P (353.6 and 357.6 nm) and Nþ2 1N (391.4,423.7, 427.8 nm) emissions. These features are generallyreported as only appearing in the airglow at extremely lowintensities (e.g., less than 1 R; Broadfoot & Kendall 1968;Meriwether & Walker 1980), if at all. The 1N emissions can,however, reach 50 R during lightning strokes (Moore 1963;Patat 2008). The median value of the Nþ2 391.4 nm emissionin our observations is 200 R.To quantify the contribution of the major emission lines tosky brightness in the BV R bands, probability histograms wereproduced and are shown in Figure 7. The correspondingFIG. 8.—Incremental contributions to sky brightness from the dominant emission lines in the BV R photometric bands, expressed as percentiles. The vertical dashedlines represent the average and maximum expected variation in sky brightness on a nightly basis. See the electronic edition of the PASP for a color version of this figure.2012 PASP, 124:637–649
644SIMS ET AL.FIG. 9.—Variation of low-intensity emissions as a function of local time. Each point is the average of every recorded emission under 750 R in intensity, binned into 1 hrintervals. A broad minimum is visible after local midnight. See the electronic edition of the PASP for a color version of this figure.tabulated quartile values are shown in Table 2. The mediancontribution intensities are in good agreement with the modeling performed in Saunders et al. (2009), where an average of23:0 mag arcsec 2 is quoted for the B and V bands. As a comparison, the zenith zodiacal light contribution at a midlatitudesite such as Mauna Kea ranges from 23:1–22:1 mag arcsec 2 ,whereas at Dome A it is always darker than 23:1 mag arcsec 2(Kenyon & Storey 2006). In this respect, the zenith sky bright-ness contribution from auroral emissions at Dome A is significantly less than the zodiacal light at midlatitude sites.Using preliminary estimates for the sky brightness background obtained with Gattini, the incremental contributions tosky brightness were calculated, with the percentiles, shown inFigure 8, providing a useful metric for determining the impactof such emissions. In the V and R bands, the contribution is lessthan 0.2 mag more than 50% of the time and less than 0.5 magFIG. 10.—Same as Fig. 9 but for high intensities. The dashed vertical line represents magnetic midnight. A strong maximum exists for all lines (except 630.0 nm)around 4 hr LT, shortly before magnetic midnight. A number of bins for particular lines did not contain any emissions above the specified threshold. See the electronicedition of the PASP for a color version of this figure.2012 PASP, 124:637–649
AIRGLOW AND AURORAE AT DOME A, ANTARCTICA645FIG. 11.—Top: Number of observations (line) and percentage with high intensities (shaded). Middle and Bottom: Variability of the high and low [O I] 557.7 nmemissions, respectively, from Figs. 9 and 10, but with error bars showing 1σ. See the electronic edition of the PASP for a color version of this figure.more than 85% of the time. The contributions in the B band aresomewhat higher.To examine the variability of the emissions, their contributions, in mag arcsec 2 , were converted into rayleighs (see, e.g.,Bessell 1979; Benn & Ellison 1998; Dempsey et al. 2005), themost commonly used unit when studying the airglow andaurorae. Our photometric accuracy of 0:1 mag correspondsto 9% in linear units such as rayleighs. The intensities werebinned into 1 hr bins of Local Time (LT).In order to explore the temporal fluctuations of the airglowand auroral emissions, we need some way to characterize eachobservation as being predominantly resulting from eitherairglow or an aurora. Using the relative line intensities is difficult, because of the near-constant presence of low-intensity Nþ2FIG. 12.—Comparison of Nigel [O I] 557.7 nm emission intensity (top; units are rayleighs) and TED total energy flux (bottom; units are ergs cm 2 s 1 ). Verticaldashed lines show a number of events common to both data sets, classified visually. See the electronic edition of the PASP for a color version of this figure.2012 PASP, 124:637–649
646SIMS ET AL.FIG. 13.—Correlation between Nigel [O I] 557.7 nm emission intensity and satellite total energy flux, using maximum values from 133 individual days. The identifiedauroral events from Fig. 12 have been marked with open circles, and the linear best-fit line (R2 ¼ 0:64) is also shown. See the electronic edition of the PASP for a colorversion of this figure.emissions. So we use a cutoff intensity of 750 R for the [O I]557.7 nm line, and we define observations below this intensityas low and those above it as high. The 750 R limit is a reasonable estimate for the maximum expected value of the [O I]557.7 nm emission in airglow (Patat 2008). It is likely that thelow category consists largely of airglow, with some weak auroral contribution, and the high category is dominated by aurora.Figures 9 and 10 show the variability of the low and highemissions, respectively. The time of magnetic midnight on thehigh-intensity plot was determined usi
1 School of Physics, University of New South Wales, Sydney NSW 2052, Australia; g.sims@unsw.edu.au. . 9 University of Western Sydney, Sydney NSW, Australia. 10 Department of Physics and Astronomy, Texas A&M University, College Station 77843. 11 Polar Research Institute of China, Shanghai 200136, China.