Transcription
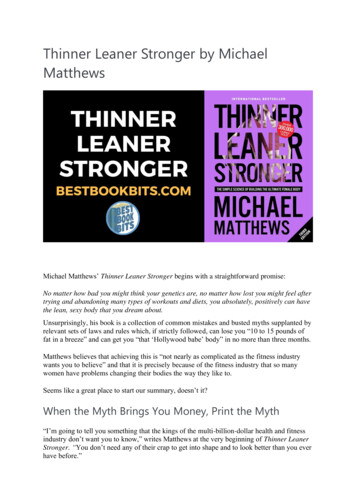
A STRONGER NATIONLearning beyond high school builds American talent53.0%Utah's Report 2019
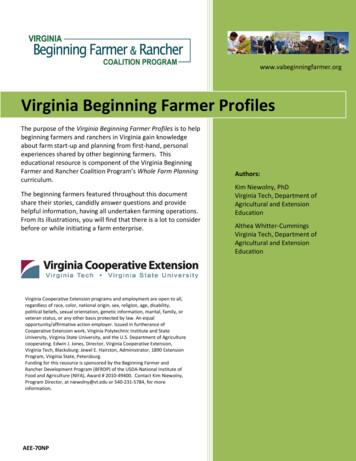
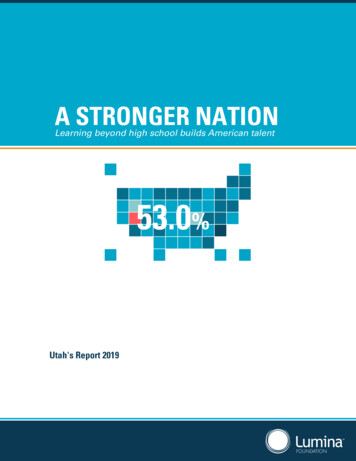
Utah's progress toward the goalBy 2025, 60 percent of Americans will need some type of high-quality credential beyond highschool. To count toward this important goal, any credential must have clear and transparentlearning outcomes that lead to further education and employment. Utah's attainment rate is53 percent, and the state is working toward its attainment goal of 66 percent by 2020.HowEducational attainment in Utah exceeds the national average, but work remains before itreaches 60 ssociatedegree andhigher43.1%Utah48.4%NationUtah's progressTo reach state goals, the state will not only have to maintaincurrent rates of attainment but also significantly increase thenumber of people who enroll in programs and earn all types ofcredentials beyond high school. With the inclusion of workforcecertificates (beginning in 2014), Utah's overall rate of educationalattainment has increased by 12.8 percentage points since 201840.2*Since 2014,workforce-relevantcertificates have beenincluded in the total ofpostsecondarycredentials.2008UTAH'S rgpage 1 of 7
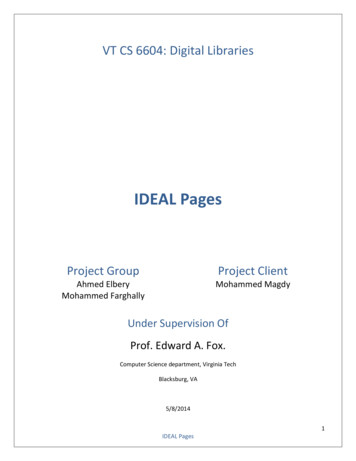
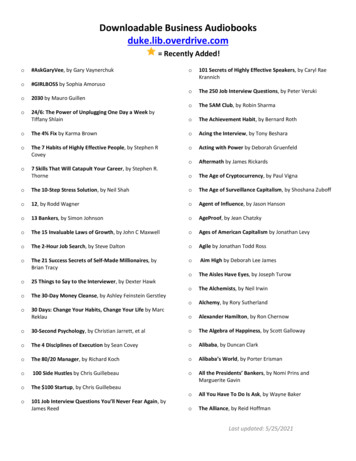
Highest Education Level Across UtahUTAH AGES 25-6453.0% attainment2 5.122.2%high school graduate(including GED)17.3%7.010.8%some collegeno credential9th-12th gradeno diploma23.7%bachelor'sdegree11.5%graduate orprofessionaldegreeassociatedegreeless than9th gradecertificateBecause of rounding, thesum of these percentagesmay exceed 100.Utah's racial and ethnic disparitiesThere are significant gaps in educational attainment that must be closed – specifically, gapslinked to race and ethnicity. These gaps persist in every state. Because educationalattainment beyond high school has become the key determinant of economic opportunityand social mobility, closing these gaps is crucial.strongernation.luminafoundation.orgUTAH'S OVERVIEWpage 2 of 7
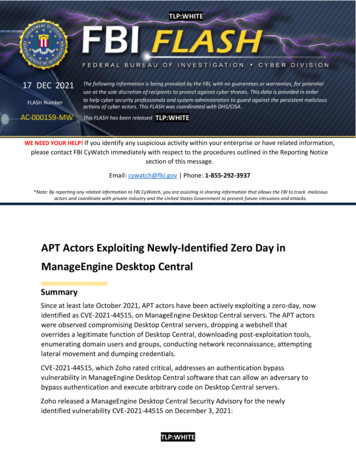
Comparing Utah CountiesExploring educational attainment at the local level can be especially helpful to local leadersas they work on talent development. For example, by pinpointing counties or regions whereattainment lags, resources can be targeted where they’re needed most. Conversely, in areasof high attainment, other regions may find practices or processes they can emulate.Compare degree attainment rates across Utah's 29 counties. Attainment is shown here asthe percentage of people ages 25-64 with at least an associate degree.*sorted byAttainmentCounty25.6 %Beaver35.1 %Box Elder46.7 op.Rank6,3862419.7 %Piute1,4202854,079833.9 %Rich2,39127Cache124,438644.3 %Salt Lake1,135,649133.6 %Carbon20,2951530.4 %San Juan15,3561718.9 %Daggett1,0292929.8 %Sanpete30,0351349.5 %Davis347,637329.4 %Sevier21,3161424.2 %Duchesne20,0261661.3 %Summit41,1061031.7 %Emery10,0772134.1 %Tooele67,456736.0 %Garfield5,0782521.6 %Uintah35,1501136.4 %Grand9,6742251.9 %Utah606,425237.1 %Iron51,001950.2 %Wasatch32,1061230.3 %Juab11,2502041.0 %Washington165,662538.4 %Kane7,5672339.0 %Wayne2,7192634.5 %Millard12,8631833.5 %Weber251,769454.5 %Morgan11,87319UTAH'S OVERVIEWstrongernation.luminafoundation.orgpage 3 of 7
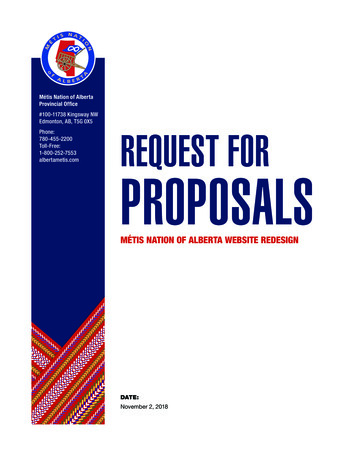
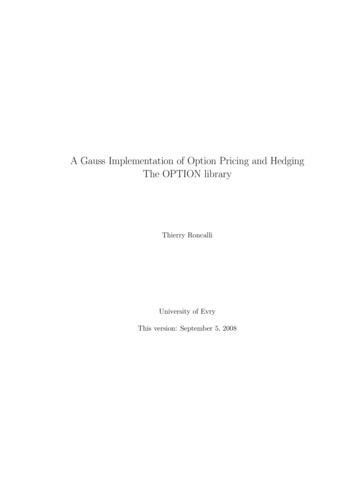
Results by race and ethnicity in UtahA growing proportion of today’s learners are African-American, Hispanic, and AmericanIndian; and data show persistent and troubling gaps between their attainment levels andthose of their white peers. Addressing these gaps – and expanding post-high-school learningopportunities for all – is essential to reducing the inequality that influences much ofAmerican life.Explore Utah's attainment rates across five racial and ethnic groups, and see how itperforms relative to other states. Attainment is shown here as the percentage of residents,ages 25-64 with at least an associate degree.*filtered bysorted byRACE AND ETHNICITYAfrican-AmericanAmerican IndianAsian and Pacific IslanderHispanicWhiteNational/State attainment averageSTATE NAME0255075100%NATIONAL AVGArizonaColoradoIdahoNevadaNew MexicoUtahWyomingUTAH'S OVERVIEWstrongernation.luminafoundation.orgpage 4 of 7
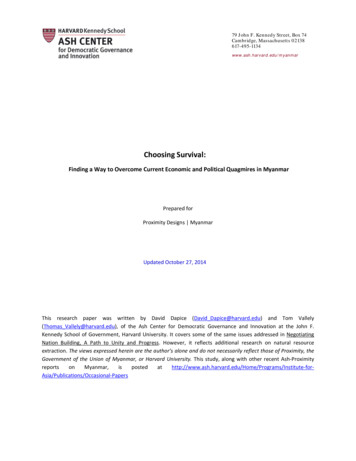
Utah's metro areasMetropolitan areas are important talent hubs, because the majority of the nation'spopulation lives within these areas.30405060%remOoProvSaltOgden-ClearfiLa eldkeCityUT20AVGExplore attainment rates in Utah's Metropolitan Statistical Areas (MSAs). Attainment isshown here as the percentage of residents, ages 25-64, with at least an associate degree.POPULATION500K1M5M10MUTAH'S OVERVIEWstrongernation.luminafoundation.orgpage 5 of 7
Data sourcesData sources for A Stronger Nation are listed below, along with links and additionalinformation.Attainment and enrollment ratesU.S. Census Bureau American Community Survey (ACS): One-year Public Use MicrodataSample (PUMS). County-level and metro-regional data are from ACS five-year estimates(2013-2017). College enrollment percentages reflect the enrollment of non-degree-holdingstudents, ages 18-57, at public and private two- and four-year institutions. U.S. Census Bureau: nce and completion ratesStudent retention rates (persistence) and degree-completion rates were collected by theNational Student Clearinghouse. Graduate degrees awarded were analyzed by the NationalCenter for Education Statistics and IPEDS. National Student Clearinghouse, 2016: http://www.studentclearinghouse.org/National Center for Education Statistics: https://nces.ed.gov/Integrated Postsecondary Education Data System Completion Survey 2014-2015: Data that track public opinion about the importance of earning credentials come from aGallup-Lumina Foundation survey conducted in 2016.PopulationU.S. Census Bureau Population Division: Annual Estimates of the Resident Population April1, 2010, to July 1, 2017. U.S. Census Bureau Annual Population Estimates: jsf/pages/productview.xhtml?pid PEP 2017 PEPANNRES&prodType tableUTAH'S OVERVIEWstrongernation.luminafoundation.orgpage 6 of 7
Inclusion of certificatesAttainment rates for 2014, 2015, 2016, and 2017 include the estimated percentage of workingage Americans who have earned high-value postsecondary certificates – not just associatedegrees and above, as A Stronger Nation reported in previous years. This estimatedpercentage was derived by polling a nationally representative sample of Americans ages25-64. The surveys were conducted by NORC at the University of Chicago, an independentresearch institution. See the methodology for certificate estimates.At the state level, the estimated percentage of state residents who have earned high-valuecertificates was derived by labor market experts at Georgetown University’s Center onEducation and the Workforce. The National Education and Attainment Survey (NEAS)from NORC at the University of ChicagoIntegrated Postsecondary Education Data SystemGeorgetown University’s Center on Education and the WorkforceDefining metro areasMetro-area data in A Stronger Nation are those that apply to the nation’s MetropolitanStatistical Areas (MSAs). The term MSA refers to “a large population nucleus, together withadjacent communities having a high degree of social and economic integration with thatcore.” MSAs comprise one or more entire counties, except in New England, where cities andtowns are the basic geographic units. The federal Office of Management and Budget definesMSAs by applying published standards to Census Bureau data.UTAH'S OVERVIEWstrongernation.luminafoundation.orgpage 7 of 7
Lumina Foundation is an independent, privatefoundation in Indianapolis that is committed tomaking opportunities for learning beyond highschool available to all. We envision a systemthat is easy to navigate, delivers fair results,and meets the nation’s need for talent througha broad range of credentials. Our goal is toprepare people for informed citizenship and forsuccess in a global economy.P.O. Box 1806Indianapolis, IN 46206-1806www.luminafoundation.org 2020 Lumina Foundation@LuminaFoundAll rights reserved.February 2020
25-64. The surveys were conducted by NORC at the University of Chicago, an independent research institution. See the methodology for certificate estimates. At the state level, the estimated percentage of state residents who have earned high-value certificates was derived by labor market experts at Georgetown University's Center on