Transcription
Using GIS to Analyze Immigrant Populations Service Needs in the Twin CitiesMetropolitan Counties, Minnesota USAAbdi M AhmedDepartment of Resource Analysis, Saint Mary’s University of Minnesota, Minneapolis,MN 55404Keywords: GIS, Twin Cities, Minneapolis, Saint Paul, Metropolitan Council, Counties,Minnesota, Immigrants, Refugees, Foreign Born, Language, Populations, Estimates,Services, Providers, US Census, American Community Survey (ACS)AbstractMinnesota has always been welcoming for immigrants and it has hosted manyimmigrants over the years. However, in the last three decades, new waves of immigrantsfrom Asia and Africa have made Minnesota their homes and most are refugees who fledfrom their native countries for reasons such as civil unrest and fear of persecution if theyremain or go back. These new immigrants came to Minnesota for the same reason asimmigrants came in the 20th century or before, looking for freedom, affordable housing,jobs, social services, and other resources. Almost all immigrants need some types ofservices and resources to help them adapt to their new country. With the surge ofimmigrants and their need for social services and assistance, service providers facechallenges to deliver these services. To predict future waves of immigrants, to estimatecurrent immigrant populations, and to identify where immigrants reside can help plan andprepare services from both governmental and non-governmental organizations. GIS toolsalong with tabular and spatial analyses were used to produce maps and tables. These werecreated to better understand where immigrants are living in the Seven County Metro area.IntroductionHistoryThe State of Minnesota has recently seenmore immigrants than it has in manyprevious decades. Many of the immigrantsarrived in the last two decades. Accordingto Ronningen (2004), “There is a greatdeal of interest in how many people arehere from other countries, where they live,and what sort of services they need.”Though it is difficult to easily findinformation about immigrants, serviceproviders from law enforcement agenciesto health care providers need to knowinformation about immigrants includingwhere they live as well as informationabout the language they speak.Ronningen (2000) explainsMinnesota had immigrants from morecountries in 2000 than ever before. Thenumber of new immigrants coming toMinnesota is still increasing as many morecome searching for jobs, housing andsafety and joining others from their nativecountry (Ronningen, 2000).Immigrants have many reasons toimmigrate. Most immigrants indicate thatthey escaped from dangerous situationsand others left to change their livingconditions and to have better lives (Bazile,2003). Regardless of the reason thatpeople migrate to the US, researchAhmed, Abdi. 2013. Using GIS to Analyze Immigrant Populations Service Needs in the Twin CitiesMetropolitan Counties, Minnesota USA. Volume 15, Papers in Resource Analysis. 7 pp. Saint Mary’sUniversity of Minnesota University Central Services Press. Winona, MN. Retrieved (date) fromhttp://www.gis.smumn.edu
indicates, “The United States offersrefugees new beginnings to those whoclaim it as their new home” (Bazile, 2003)and the US has become the destination formany.Coming to a new country andmaking it home is tough and everynewcomer faces many challenges. Someof the greatest are the cultural andlinguistic barriers to finding and to gettingtheir basic needs met such as housing,jobs, and safety. These new challenges canbe difficult and overwhelming for manywhen they are trying to adjust a newcountry, adapt to a new life and culture,learn a new language, and understandvalues that sometimes clash with their own(Anonymous, 2004).New immigrants come toMinnesota for the same reasons asimmigrants came in the 20th century orbefore. They are looking for affordablehousings, jobs, social services, and otherresources. To have services and resourcesare extremely helpful as they often needsubstantial assistance to adjust to Americalife and reach self-sufficiency. “Ourphilosophy is we meet people where theyare and help them on their path towardself-sufficiency says Rachele King,director of refugee services for theMinnesota Council of Churches” (Dillon,2008).With the surge of immigrantspouring into the state and their needs forsocial services and assistance, socialservice providers face challenges todeliver these services. As an agencysupervisor described with frustration, “Mystaff was getting frustrated, too. We wouldhave Spanish speaking and other limitedEnglish speaking immigrants come to theoffice, and it was real struggle tounderstand them and for them tounderstand us” (Anonymous, 2004).Because of misunderstandings, serviceprovider waste time and money, andservices are not being efficientlydelivered. According to Anonymous(2004), “We started to wonder where thenext waves of refugees and immigrantswould come from and how we would allcope.”Overview of ImmigrationInternational migration imbalance betweendeveloping nations and industrial countriesresults in a “push-pull” migrationphenomenon. People are pushed from theirnative countries by poor economies orcivil unrest and they are pulled to othersby economic opportunities, safety, andfreedom (Darboe, 2003). In the last twocenturies, many people migrated to theUnited States for different reasons butmostly to have better lives and freedom(Anonymous, 2004).As described in the Immigrationand Assimilation article (Darboe, 2003),there are four main types of aliens or noncitizens in the United States. The first areimmigrants from other countries who areadmitted either by re-uniting with familymembers who are already US residents orcitizens or they have professionalqualifications for certain jobs.The second categories ofimmigrants are called refugees and theyare people who left their country becauseof fear of persecution for political,religious or other reasons. Third, nonimmigrants are persons granted atemporary entry for a specific purposesuch as studying, working or visiting.Lastly, unauthorized migrants areforeigners with neither immigrant nor nonimmigrant visas.US Immigration Laws2
Even though many immigration laws wereenacted over the years at the state andfederal levels, there were three major lawspassed by the Congress of the United Satesin the past few decades. One of them isknown as the Refugee Act of 1980, and itwas enacted to create a systematicprocedure for the admission and effectiveresettlement of refugees, especially thoseaffected by humanitarian crisis.The second law was passed duringthe Reagan administration and it is knownas the Immigration Reform and ControlAct. It was passed in 1986. Its purposewas to reduce illegal immigrants to theUnited States. The third law was passed in1990’s and was intended to increase thenumber of immigrants and their familiesunder the employment-preference category(Darboe, 2003).sources of data were the US Census andAmerican Community Survey (ACS) data.Data from these sources were used tocreate maps and perform analysis of theimmigrant populations.The first step was to prepare data.ArcGIS’s geo-processing tools were usedto generate and manipulate data necessaryfor analysis in the study. Many of the toolsutilized data manipulation included:clipping, merging, and joins data sets.Some of the data were obtained in theform of database files (.dbf) and werejoined across variables with other databasefiles. Once layers were manipulated andsuccessfully joined, the layers wereimported into a geo-database for analysis.One of the difficulties encounteredwhen performing data manipulation andgeo-processing was that all data were notin the same format with similar keys tojoin or merge tables and features together.For example, race, ethnicity, and otherdemographic characteristics from the UScensus database files required tablemanipulation and spatial featureprocessing (clipping) to align with themetro counties from the Census Tract file.The tables required some editing to permitthe correct information to be joined withthe Census Tract layer. Carefulmanipulation was required as ethnicity andrace alone do not separate immigrantsfrom citizens of the same race or ethnicity.MethodologyData ImportanceThe goal of this research was to analyzeimmigrant populations in Metro Countieswithin the areas of Minneapolis and St.Paul, Minnesota USA. The results of theanalysis are intended to help serviceproviders, local government and non-profitorganizations better estimate immigrantpopulations and therefore to help thembetter prepare and plan the servicesimmigrants need. The end results may alsobe helpful for governmental budgeting andresource distribution. To complete thisresearch, data gathering was undertaken.Further, major processes for this workincluded data collection, conversion,joining, calculating, layer creation,analyzing, and graphing data.Counties Base DataBasemaps of the counties were obtainedfrom the Minnesota Metropolitan Council.From the mid 1970s to mid 1990s, anestimated 60, 000 Hmong refugees wereresettled into the US – many in the TwinCities (Dillon, 2008). It is also estimatedthat more than 55,800 people moved to theUnited States from Somalia between 1991and 2004, and more than half of themGathering DataMultiple data sets were required. The main3
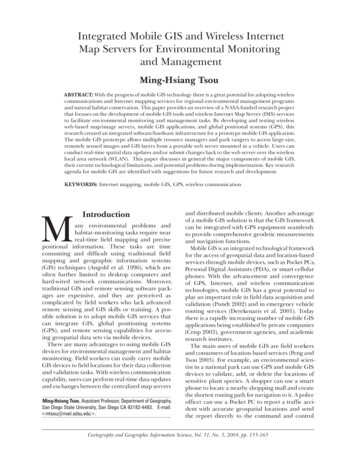
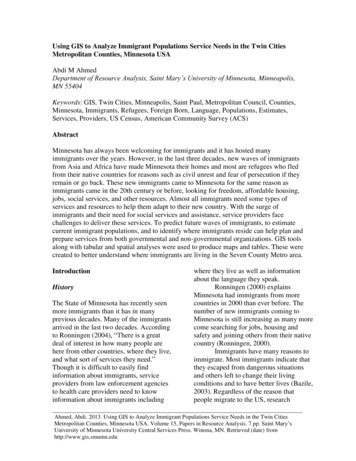
settled in Minnesota (Lenz and Warner,2011). Minnesota’s immigrants are now125,000 Chicanos/Latinos, 108,000 Asiansand Pacific Islanders, 140,000 Africansand growing population from Russia andEast Europe (Anonymous, 2004).language spoken at home. In this study,these latter variables facilitated separatingthose of the same race and ethnicity asthey afforded distinction as to whetherpeople were born in or immigrated to theUS. The Minnesota Department ofEducation, the Department of HomelandSecurity’s Immigration Statistics and theMinnesota Department of Health collectednationality origins and language indicatorsto track immigrants they serve(Ronningen, 2000) but these data were notused in this research because the data werecollected only from immigrants they serve.US Census DataCensus data are population data collectedevery ten years by the US government andit is the most accurate count of thepopulation in the US. It is used for manypurposes from political representation toallocating resources. However, indicatorsneeded to differentiate immigrants’ socialand economic characteristics are verydifficult to extract from the Census data.Census Block Tract data wereacquired to locate the immigrants andidentify their demographic characteristicsin the Twin Cities Metropolitan Counties.These data helped to identify which areaswithin the Metropolitan have moreimmigrants than others.Census Block Group and TractData were obtained from MetropolitanCouncil and US Census Bureau website.The Census Bureau provides data onpopulation count, demographics, andeconomics. For this study, CensusTract and Block Group data were utilized.Data PreparationThe GIS data obtained from the CensusBureau and other agencies such asAmerican Community Survey weremanipulated to make attributes consistent.Maps and data were obtained from theMinnesota’s Metropolitan Council websiteto acquire estimates of Metro’s immigrantpopulations.GIS data sets of important featureswere also obtained. These were comprisedof shapefiles and database files. Theseshapefiles contained data representing (a)study areas (basemaps), (b) Census Blocktracts, and (c) Population Census countdata. The polygon layers were used toestimate, locate, and analyze whereimmigrants reside in the seven countymetro area (Figure 1).ArcGIS’s Geoprocessing andSpatial Analyst tools were used to convert,import, merge, and clip these data.Database files were joined across sectionIDs. When done, all data layers wereexamined to make sure they wereconsistent and contained:American Community Survey (ACS)Because of the inability of the US Censusdata to separate the races by immigrantsand non-immigrants, other supplementaldata were obtained from the AmericanCommunity Survey (ACS) which conductsyearly, biennial, triennial, andquinquennial surveys across communitiesin the United States.ACS collects different informationon many different variables includingoriginal nationality, country of birth, and1. Across Section ID field to facilitatejoining different features and tables2. Area of study – basemaps4
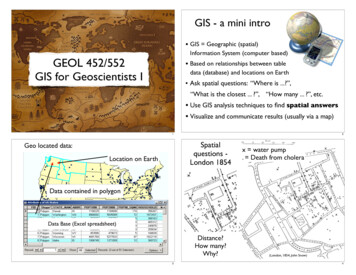
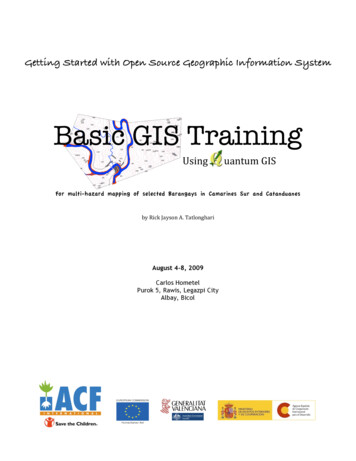
3. Demographic data attributesor approximately 12 percent are foreignborn. Roughly 500,000 of the Seven Metrocounties residents were born outside of theUnited States and close to half of these arenaturalized citizens. The other half arenon-citizens. Nearly 45 percent of theforeign-born residents live in Minneapolisand St. Paul (Figures 2 and 3).Figure 1. Seven County Twin Cities Metropolitan areaconsisting of 2,975 square miles.ResultsFigure 2. Language spoken in Seven County Metro Area,2006.Analysis of the immigrant populationcharacteristics in the Seven MetroCounties provided general understandingof the people of foreign birth. The totalnumbers of immigrants in all Seven MetroCounties were combined here though theycould be further analyzed by individualcounty or city.Immigrants were identified twoways: by Language Spoken at Home otherthan English and by Country of Birth. Thelanguage spoken at home information gavea good estimate of immigrant populationsbut was likely an overestimate due to thelarge number of natives who speak otherlanguages. The Country of Birth data weremore accurate and produced a betterestimate of the immigrant populations.Both methods were used to identify andcompare immigrants in this study.According to the American CommunitySurvey (n.d.), from data collected in 2006and 2008, one in ten Twin Cities residentsFigure 3. Seven County Metro area by NationalityPopulation, 2006.From ACS data on the LanguageSpoken at Home, there is a large group ofpeople speaking a language other than thatof the country of their birth. This suggeststhere is a large number of US born peoplewho speak language other than English.5
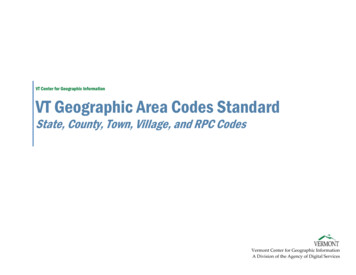
Nearly 300,000 to 500,000 of theMetropolitan’s population are immigrantsborn outside the US. These peoplemigrated to the state and most have livedin the Seven Metro Counties for the pasttwo decades (Figures 4 and 5). Figures 4and 5 depict results of 2008 ACS withboth language and foreign-borncharactristics similar to those noted for2006 but with increased numbers.St. Paul. Immigrants are not equallydivided amongst the Seven MetroCounties (Figures 6 and 7).Figure 6. Seven Metro Counties Nationality Population,2006.Figure 4. Seven County Metro area by NationalityPopulation, 2008.Figure 7. Seven Metro Counties Nationality Population,2008.Figure 5. Language spoken in Seven County Metro Area,2008.Populations are concentrated inMinneapolis and St. Paul and the citiesbordering these two cities. The borderingcities in northern Hennepin County areThe distribution of immigrant populationwas similar in 2008 as it was in 2006 withmore than half living in Minneapolis and6
Brooklyn Park and Brooklyn Center,respectively.Historically, the cities ofMinneapolis and St. Paul had the highestdensity of immigrants with thesurrounding suburban areas having lowerdensities. Today immigrants are moredispersed.experiences that helped in many coursesand projects. Lastly, thanks to my familyfor their support and patience throughoutthe years I was busy with studies.ReferencesAmerican Community Survey. n.d.Retrieved November 2012 fromhttp://www.census.gov/ acs/www/.Anonymous. 2004. A Place to Call"Home" (Cover story). Policy & Practice(19426828), 62(1), 12-15.Bazile, A. M. 2003. Needs AssessmentSurvey for a Resource Center forAfrican Immigrants and Refugees in St.Paul, Minnesota. University ofMinnesota-Twin Cities. ReceivedJanuary, 2003.Darboe, K. 2003. New Immigration inMinnesota: The Somali Immigration andAssimilation. Journal of DevelopingSocieties, 19(4), 458-472.Dillon, N. 2008. Things Can Change.American School Board Journal, 195(9),44-47.Lenz, B. K., and Warner, S. 2011.GLOBAL Learning Experiences Duringa Domestic Community Health Clinical.Nursing Education Perspectives, 32(1),26-29.Ronningen, B. J. 2000. Immigrants inMinnesota: An Increasingly DiversePopulation. Population Notes.Minnesota: Minnesota StateDemographic Center.Ronningen, B. J. 2004. Estimates ofSelected Immigrant Populations inMinnesota: Population Notes.Minnesota: Minnesota StateDemographic Center.ConclusionThis study created basic maps to helpunderstand the Seven County Metro areaimmigrant populations. Though it isdifficult to obtain accurate data onimmigrants because of barriers such aslanguage, immigration laws, andresidency, the estimated number ofimmigrants appears to be growing.Limitations and IssuesIdentifying immigrants and nativepopulations were one major issue in thisproject. Many immigrants have the samerace or ethnicity as native populations.Secondly, some of the data were collectedin the form of database file (.dbf or .xls)formats and it was difficult to convert andcreate features and shapefiles from thatdata as well as to join or relate them.AcknowledgementsI would like to acknowledge and extendmy gratitude to all those who helped me tocomplete this program and particularlymany thanks to GIS professors: Dr.McConville, John Ebert, and GretaBernatz who helped me to learn, grow, andthrive in the GIS world over the years. Theunique courses with emphasis on academicperformances and educational experiencesat Saint Mary University have helped mewith what I wanted. Thanks also to myclassmates for sharing ideas and7
created to better understand where immigrants are living in the Seven County Metro area. Introduction History The State of Minnesota has recently seen more immigrants than it has in many previous decades. Many of the immigrants arrived in the last two decades. According to Ronningen (2004), "There is a great deal of interest in how many .