Transcription
Malaysian Journal of Learning and Instruction: Vol. 15 (No. 2) Dec 2018: 1-311A STUDENT’S SCIENTIFIC MIND:A CONFIRMATORY FACTOR ANALYSISOranit Chokchai & 2Phadungchai PupatFaculty of Industrial Education and TechnologyKing Mongkut’s Institute of Technology LadkrabangBangkok, Thailand11Corresponding author: oranit chokchai@hotmail.comReceived: 3 June 2018Revised: 21 July 2018Accepted: 10 September 2018ABSTRACTPurpose – The research aimed to examine the construct validity of ascientific-mind measurement model for secondary school students inBangkok and the factor loading values of scientific-mind indicators.Methodology – Stratified random sampling was used to selecta sample of 500 Grade 8 students studying in a Bangkok schooldistrict during the 2016 academic year. Testing of scientificmind measurement was used as the research instrument andconstruct validity testing of the scientific-mind measurementmodel utilized second-order confirmatory factor analysis(CFA) was carried out with SPSS AMOS software Version 23.Findings - The testing of the scientific-mind measurement modelfor secondary school students in Bangkok was consistent with theempirical data. The scientific-mind factors consisted of two indicators,including scientific attitudes and attitudes towards science. Scientificattitudes were comprised of nine indicators. The indicator with thehighest factor loading value was creatively working with other people.Attitudes towards science contained four indicators. The indicatorwith the highest factor loading value was science value awareness.Significance – The results revealed that teachers and educationaladministrators have the potential to use the study’s scientificmind factors in their approaches to course development, as well
2Malaysian Journal of Learning and Instruction: Vol. 15 (No. 2) Dec 2018: 1-31as in designing a manual for learning management. The study’smodel can also help in measurement and evaluation of secondaryschool students’ progress in developing a better scientific mind.Keywords: Confirmatory factor analysis (CFA), scientific attitudes,scientific mind, secondary students, science attitudes.INTRODUCTIONIt seems that citizens of most modern industrial countries live ina scientific and technological ‘culture,’ in which daily living issignificantly impacted upon by science (Miller, 1996). Some authorsalso argue that scientific literacy is essential for participation indemocracy, political activities (Süerdem & Çağlıyor, 2016) and asa key to good citizenship (Lee & Roth, 2003). However, what is ascientific mind?According to Feist (2006), scientific thinking is a hallmark intellectualachievement of the human species, with the flexibility of humans tolearn virtually whatever our environment throws at us, the signaturetrait of the human species. Furthermore, formal science—science aswe know it—is but one specific expression of scientific thinking.A scientific mind, therefore, is a mind which questions everythingaround it and within it. A scientific mind also seeks answers, reasons,and explanations. Furthermore, a scientific mind is an essential toolfor learning, which includes attitudes and skills that come fromhabits of the mind. It must be expressed by knowledge, learning,thinking, and practice (American Association for the Advancementof Science, 1993; Brearton, 1996).Furthermore, Chin (2005) discussed scientific literacy domains,which were indicated to include science content, the interactionbetween science, technology, the nature of science, society, andattitudes toward science. Furthermore, mathematics and sciencelearning is crucial during the early childhood years (Clements,2002; Connor, Morrison, & Petrella, 2004; Hamre & Pianta, 2005),which also affects long-term associations with school readiness andcontinued academic achievement (Arnold, Fisher, Doctoroff, &Dobbs, 2002).
Malaysian Journal of Learning and Instruction: Vol. 15 (No. 2) Dec 2018: 1-313Feist (2006) has also expressed his surprise at the lack of researchinto topics concerning the psychology of science and stated thatit was not until the late 1970s that investigations began. Thisacknowledgement in the lack of research is also consistent withMahoney (1979), which stated that regarding behavior patterns,affect, and even some intellectual matters, researchers know moreabout alcoholics, Christians, and criminals than they know abouta scientist’s psychology. Furthermore, researchers, educators, andemployers are increasingly concerned about youth’s declininginterest in pursuing scientific careers and critical thinking skills(Reeve, 2016; Thailand Science Technology and Innovation Profile,2014). Also, these concerns have reinforced the notion of scientificignorance in the general public (Osborne, Simon, & Collins, 2003;van Aalderen-Smeets, Walma van der Molen, & Asma, 2012).In Thailand where educational debate rages, educational fundingtakes 20% of the budget which represents 6% of the GDP.Furthermore, 80% of the educational budget gets allocated to supportadministrative costs, while only 5% spent in 2013 went to boostingthe quality of education (Concern over ‘inefficient’ educationspending, 2015). Results from this process are evident as test scorescontinue to decline, with the 2015 Programme for InternationalStudent Assessment (PISA) results recording Thai students asbeing among the lowest in the world (PISA, 2015; Rujivanarom,2016; Sothayapetch, Lavonen, & Juuti, 2013; Yuenyong, 2013).Also, the Thailand Research Fund (TRF) in 2016 revealed test resultsfrom 2,901 Grade 6 students, 2,305 Grade 10 students and 1,029vocational students from 10 provinces tested for logical thinkingand analytical skills. From this diverse group of 6,235 students,only 2.09% passed the exam. Furthermore, the average score wasonly 36.5% (Rujivanarom, 2016). Thus, educators in Thailandhave called for significant reform and blamed students’ low scoresin the PISA on the system’s failure to encourage logical thinking.Thailand’s ASEAN neighbor Malaysia, however, is finding waysto improve scientific thinking skills. According to that country’s2015 PISA results, there was a significant improvement for allthree domains tested, with science rising 23 points to 443 (Abas &Shahar, 2016). Also, science, technology, and innovation (STI) arekey drivers of sustainable economic growth and social development
4Malaysian Journal of Learning and Instruction: Vol. 15 (No. 2) Dec 2018: 1-31(Thailand Science Technology and Innovation Profile, 2014), with21st-century digital skills driving organizations’ competitivenessand innovation capacity (Van Laar, Van Deursen, Van Dijk, & deHaan, 2017).Many developing nations are beginning to face more problemswith students who are not interested in and do not value science.However, in the current climate of rapid technological change, it isbecoming imperative - for knowledge workers to acquire 21st-centuryskills (Reeve, 2016), but in Thailand, the production of sufficient,well-trained, and qualified technicians for a quickly changingeconomy has become a severe problem (UNESCO Bangkok, 2011).The problems with a skilled labor shortage are consistent withChalamwong et al. (2012), which determined that companies arelooking for semi-skilled workers, yet Thai vocational institutionsand universities have not been very successful in producing highlyqualified graduates (Kraisuth & Panjakajornsak, 2017).Also, according to van Aalderen-Smeets et al. (2012) in primaryscience education, teachers have not been allowed to develop andconceptualize their ideas and attitudes towards science accurately.This poor theoretical background has led to the use of a multitude ofdifferent concepts and measurement instruments. Therefore, research- on factors affecting attitudes concerning science continues to be acrucial element in the discussion of essential motivators contributingto a classroom’s atmosphere and activities that increase students’interest in science education. Osborne et al. (2003), even stated thatscience attitudes’ concepts are still quite ambiguous.Numerous educational projects have attempted to improve orassess attitudes which compose identifiable attributes of scientificthought (van Aalderen-Smeets et al., 2012). One such attempt wasresearch from Çalik, Turan, and Coll (2014), which investigated1,600 Turkish elementary student teachers’ scientific habits of mind.They concluded that it seems accepted school science departmentsneed to equip their students with knowledge of science content andscientific thinking if Turkey is to produce scientifically literatecitizens capable of engaging in debate about contemporary sciencebased issues.According to Simpson and Oliver (1985), researchers havedocumented that elementary school students receive minimal
Malaysian Journal of Learning and Instruction: Vol. 15 (No. 2) Dec 2018: 1-315instruction in science, which contributes to the conclusion thatmany young students enter their first science classes with mixedemotions and ill-prepared about the nature of science. During thiscrucial period, most students develop their most lasting impressionsof science, with many students turning away from science and laterbecoming a member of a vast number of illiterate adults aboutscience (Miller & Prewitt, 1979). It is therefore crucial that scienceeducators have accurate research regarding changes in attitudestowards science and their motivation for learning in a student’smiddle and secondary school years.Furthermore, there are also a variety of variables that affect students’attitudes. These include students’ class grades, gender (ŞAN, İsmail& İhsan Boran, Ali, 2013; Smith, Pasero, & McKenna, 2014;Weinburgh, 1995, 2000; Yamtinah, Masykuri, Ashadi, & Shidiq,2017), classroom learning activities, classroom size (Gaudet, Ramer,Nakonechny, Cragg, & Ramer, 2010), cooperative learning (Kose,Sahin, Ergun, & Gezer, 2010), attitudes and beliefs (Putti, 2011) andclassroom management (Ford, 2016). Houseal, Abd-El-Khalick,and Destefano (2014) also investigated Student–Teacher-ScientistPartnerships (STSPs), while ŞAN, İsmail and İhsan Boran, Ali(2013) determined that gifted students aged 12-16 years old did notdiffer in scientific attitudes when categorized by gender. Scientificattitudes are also crucial to scientific-literacy development (ŞAN,İsmail & İhsan Boran, Ali, 2013).The framework for the study’s scientific-knowledge assessment,therefore, consisted of correlated factors including, scientificcontexts, scientific skills, scientific knowledge, and students’attitudes, such as interest in science, support for science, andresponsibility for natural resources and the environment. Due to theimportance of a scientific mind, the researchers were interested instudying the factors affecting a student’s scientific mind. The study’ssample came from secondary school students in Bangkok, Thailand.Understanding the direction and intensity of students’ scientific mindallows instructors to predict students’ possible behaviors, which helpsin proper planning and effective teaching (Miller & Prewitt, 1979).According to Bartholomew, Steele, Moustaki, and Galbraith (2008);Hair, Black, Babin, & Anderson, 2014; Tabachnick and Fidell (2013),a study’s measurement model is accessed by use of a confirmatoryfactor analysis (CFA), followed by structural equation modeling
6Malaysian Journal of Learning and Instruction: Vol. 15 (No. 2) Dec 2018: 1-31(SEM) to determine the overall fit of the proposed model with dataand also to identify the relationships among the various constructs.Therefore, CFA was used to investigate the factors of scientificmind as identified from the research literature and theory. Statisticalanalysis was used to prove the validity of the measurement model, toeither accept or reject the studied theory of attributes (Bartholomewet al., 2008; Gagne & Hancock, 2006; Hair et al., 2014; Mulaik,2009)RESEARCH OBJECTIVESThe study goal was to investigate the construct validity of the scientificmind measurement model among secondary students in Bangkok,Thailand, and the factor loading values of the scientific-mind indicators.CONCEPTUAL FRAMEWORKThe measurement model for the paper’s scientific mind researchcame from the synthesis of documents, theory, and related academicand research writings. The results can be summarized as follows:A scientific mind is the feelings, expressive behaviors, andcharacteristics of an individual’s relationship with science andits terms. These have resulted from emotions developed fromexperience and learning. It covers interests, attitudes, values,ethics, and expressive behaviors derived from visibly expressingfeelings. Attributes that can be used to evaluate scientific mindindicators comprise scientific attitudes and attitudes towards science(Bondebjerg, 2017; Feist, 2006; Fuller, 2016; Hjørland, 2004;Martocchio & Hertenstein, 2003; Varela, Thompson, and Rosch (1993).Scientific attitudes are scientific-thinking patterns or beliefs in science(Gauld, 1982), which are associated with a complex combination of aneed to know and to understand. Furthermore, scientific attitudes forman attachment with scientific methods and expressions of a scientificmind, called cognitive orientation (Bondebjerg, 2017). Cognitiveorientation is concerned with learning intellect, understanding, andthinking. Varela et al. (1993), also argued that cognitive science isan interaction between cognition, society, and culture. Attributesof scientific attitudes include: 1) curiosity, 2) determination, 3)
Malaysian Journal of Learning and Instruction: Vol. 15 (No. 2) Dec 2018: 1-317accountability, 4) prudence, 5) honesty, 6) frugality, 7) being broadminded, 8) rationale, and 9) creatively working with other people(Arseculeratne, 2014; Blalock et al., 2008; Feist, 2006; Gauld, 1982;Hjørland, 2004; Martocchio & Hertenstein, 2003; Moore & Foy,1997; Price & Lee, 2013).Attitudes towards science are feelings, beliefs, and commitments tothe values of scientific works for society or scientists themselvescalled affective orientation. Attributes of attitudes towards scienceare covered by 1) interest in science, 2) science value awareness, 3)belief and value about science, and 4) virtue and ethics in science(Barco-Southall, 2012; Chin, 2005; Ornstein, 2006; Osborne et al.,2003; Smith et al., 2014; Sofiani, Maulida, Fadhillah, & Sihite, 2017;van Aalderen-Smeets et al., 2012).METHODOLOGYPopulation and SampleThe population consisted of 19,569 students who were in Grade 8during the 2016 academic year, from 67 Bangkok schools under theSecondary Educational Service Area Office 1. The sample consistedof 500 students who were in Grade 8 during the 2016 academic year,from Bangkok schools under the Secondary Educational ServiceArea Office 1. The sample size was determined in accordance withthe criteria set forth by Hair et al. (2014) that the sample size shouldbe 100 or higher, the minimum is to have at least five times as thenumber of variables to be analysis, and the more acceptable samplesize would have a 10: 1 ratio. In this scientific-mind measurementmodel, there were 31 parameters for calculation. The researcherassigned ten samples to each parameter, hence the sample size of31 10 (or 310 persons). The larger sample sizes seemed to providemore confidence in CFA results (Bartholomew et al., 2008; Gagne& Hancock, 2006; Mulaik, 2009; Tabachnick & Fidell, 2013). So, toreduce the error of power of the tests, the researcher collected datafrom 500 samples by using a stratified random sampling method.From an initial population of 67 schools, the schools were divided intosub-groups as follows: A Small school had less than 500 students per school. In thiscategory, there were five schools.
8Malaysian Journal of Learning and Instruction: Vol. 15 (No. 2) Dec 2018: 1-31 A Medium school had between 500-1,499 students. In thiscategory, there were 26 schools. A large school had between 1,500-2,499 students. In this category,there were 18 schools. Extra-large schools had over 2,500 students. In this category,there were 18 schools.After identification of the sub-groups, simple random sampling wasused to select 20% from each sub-group. From this process, the sampleconsisted of students from 14 schools which included one smallschool, five medium schools, four large schools and four extra-largeschools. After this, simple random sampling was used to identify 3536 students, which contributed to the total sample size of 500 students.InstrumentThe instrument used in this research contained a five-level, Likert typeagreement scale to measure the attributes of scientific attitudes andattitudes towards science. Research validity verification used variousmethods including the use of the Index of Item Objective Congruence(IOC) (Hambleton & Rovinelli, 1986; Turner & Carlson, 2003).Additionally, five experts were tasked to evaluate the content of thesurvey’s items, from which the IOC was used to calculate the results.Items with an IOC of less than 0.50 was rejected. The researchersthen conducted a pilot survey in which 57 students who were notparticipants in the final survey were selected. From this ‘try-out,’40 complete questionnaires were obtained. From this group, 30were used to test discrimination validity. In the discrimination,respondents’ scores were divided into two groups: high and low, forthe calculation of t-test values. The level of statistical significancewas determined at .05 ( .05), with items having a t-value of 1.76 orabove is selected (Agresti & Finlay, 2014; Carlin, 2001; Eisenhauer,2008; Kim, 2015; Rasch, Kubinger & Moder, 2011; Tabachnick& Fidell, 2013). The attributes of scientific attitudes and attitudestowards science were measured for 15 and 11 items, respectively.Reliability through Cronbach’s alpha (Hair et al., 2014), indicatedthat values for the measurements on attributes of scientific attitudesand attitudes towards science were 0.82 and 0.73, respectively.
9Malaysian Journal of Learning and Instruction: Vol. 15 (No. 2) Dec 2018: 1-31VariablesTable 1 shows both the observed and latent variables used in the study.The external latent variable for the study was a student’s scientificmind (SCIMIND), which contained the two internal variables ofscientific attitudes (SCIAT) and attitudes towards science (ATSCI).Furthermore, for the 1st order CFA analysis, there were a total of13 variables. This included nine items associated with SCIAT andfour items associated with attitudes towards science (ATSCI).Table 1External and Internal Variables and their associated blesObserved variables/indicators1) estyfrugalitybeing broad-mindedrationalecreatively working withother peopleinterest in sciencescience value awarenessbelief and value aboutsciencevirtue and ethic VSVESData CollectionResearchers collected data from the sample of 500 students who werein Grade 8 for the 2016 academic year, from Bangkok schools underthe Secondary Educational Service Area Office 1, via measurement
10Malaysian Journal of Learning and Instruction: Vol. 15 (No. 2) Dec 2018: 1-31on attributes of scientific attitudes (SCIAT) and attitudes towardsscience (ATSCI).Between November 2016 to January 2017, 14 school administratorsand teachers were contacted to gain permission for access to theschool and students. The researchers then conducted the surveyin which 1-2 days in each institution was allocated to review andcollect the student questionnaires.Data Analysis1.2.3.4.The data were analyzed using descriptive statisticsincluding mean ( X ) and standard deviation (S.D.).Pearson’s product moment correlation coefficient(PPMC) was analyzed among the observed variablesto determine the size and direction of the observedvariables in the model, and the relationship between them.Appropriateness of data and the relationship betweenvariables in factor analysis were examined usingthe Bartlett test of sphericity (Hair et al., 2014). TheKaiser-Meyer-Olkin (KMO) test was also used to showhow well the data is suited (Cerny & Kaiser, 1977).Construct validity of the scientific-attitudes measurementmodel and construct validity of attitudes towards the sciencemeasurement model were investigated by analyzing thefirst-order confirmatory factor analysis (CFA). Furthermore,construct validity of the scientific-mind measurementmodel was investigated by use of an additional secondorder confirmatory factor analysis (2nd order CFA). Softwareanalysis was undertaken with the use of SPSS AMOS Version23 software. Standardized loading estimates were required tobe higher than .5 (Hair et al., 2014), with parameter estimationaccomplished by the use of the Maximum Likelihood (ML)method and the variance-covariance matrix (Bartholomewet al., 2008; Tabachnick & Fidell, 2013). The model’sgoodness of fit used indices including Chi-square ( 2), thegoodness-of-fit index (GFI), the root mean square error ofapproximation (RMSEA) and the root mean square residual(RMR) (Bartholomew et al., 2008; Hair et al., 2014; Hooper,Coughlan, & Mullen, 2008; Tabachnick & Fidell, 2013).
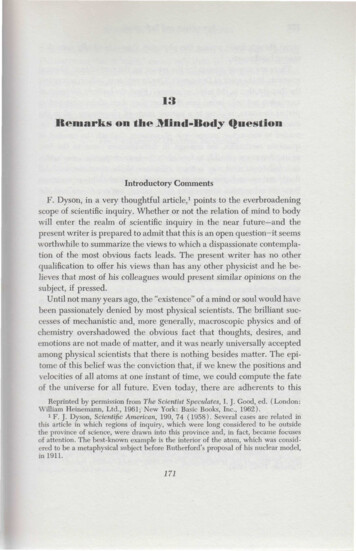
11Malaysian Journal of Learning and Instruction: Vol. 15 (No. 2) Dec 2018: 1-31RESULTSResults on Construct Validity Testing of the ScientificAttitudes Measurement Model from the First-Order CFAScientific attitudes (SCIAT) consisted of nine indicators, as shownin Figure 1. The means were 3.600-3.858, and standard deviationswere 0.751-1.007, which indicated that students possessed allattributes of scientific attitudes at a high level (Mean 3.51-4.50).Figure 1. Means of indicators as factors of scientific attitudes.Table 2Means, Standard Deviations, and Correlation Coefficients ofObserved Variables or Indicators in the Scientific-AttitudesMeasurement Model for Students (n 500)ObservedvariablesCURDETCorrelation 000.9280.7920.8163.6883.858Note. **p .01, KMO: Kaiser-Meyer-Olkin measure of sampling adequacy 0.904 Bartlett’s test of sphericity: Chi-Square 1,749.589, df 36, p .000
12Malaysian Journal of Learning and Instruction: Vol. 15 (No. 2) Dec 2018: 1-31Table 2 shows the results from the PPMC analysis. The PPMC isused to calculate the strength and direction between the model’svariables. From the analysis, all nine indicators yielded the resultthat the correlation for all 36 pairs of indicators significantly differedfrom zero, at a statistical significance level of .01. Additionally, allpairs had positive correlation values, with correlation coefficientsbetween 0.26-0.63. Bartlett’s test of sphericity returned a Chi-squarevalue 1,749.589, df 36, and p .000, which was significantlydifferent from zero at a statistical significance level of .01. Theresults were also consistent with the Kaiser-Meyer-Olkin (KMO)index analysis, which equaled 0.904, which was high enough to usefor analyzing construct validity factors (Tabachnick & Fidell, 2013).Table 3Statistical Analysis of Construct Validity Testing of theScientific-Attitudes Measurement Model for Students (n 500)Indicators as factors of Scientific **0.497**0.627**0.638** -- reweights(FS)Squaredmultiplecorrelations(R2) - 4220.3900.5400.4430.4510.2470.3940.407Note. **p .01, bsc Factor Loading Values, -- Fixed parameters do notreport S.E. and t. Chi-square 29.779, df 20, p 0.074, 2/df 1.489,RMSEA 0.031, RMR 0.017, GFI 0.987, AGFI 0.971Table 3 shows the results of the construct validity testing ofthe scientific-attitudes (SCIAT) measurement model, whoseresults indicated the model’s consistency with the empirical data.Confirmation of this was from a Chi-square value 29.779, df 20,and p 0.074. According to Hooper et al. (2008), reporting the Chisquare test with its degree of freedom and the associated p-value is
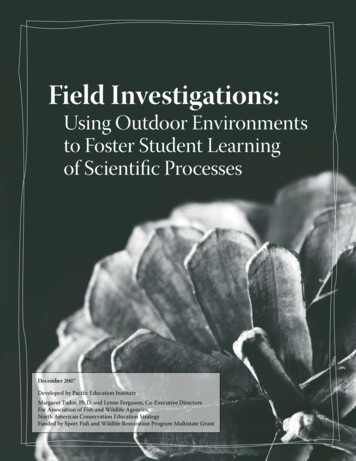
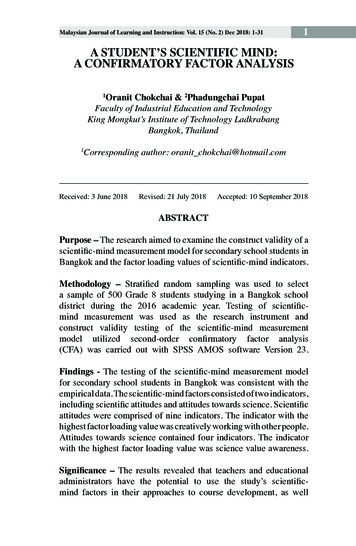
weights (FS)correlations (R0.719** -- - 0.1260.5180.650**0.06716.0500.0670.422Malaysianand Instruction:Vol. 15 (No. 2) Dec0.0972018: 1-310.625**Journal of Learning0.08512.41813 0.3900.735**0.06614.7920.1710.540mandatory,2.0 stated as acceptable0.666** with a value0.066as low as13.3150.151 (Tabachnick 0.4432&Fidell, 2013). Additionally,differed from zerowith no statistical 0.4510.672**0.06213.6110.134significance.Moreover, 0.031 and RMR0.497**0.077 RMSEA10.0190.016 0.017, which 0.247wereclose to 0; GFI 0.987 12.711and the AGFI 0.0890.971, which were 0.3940.627**0.0662closeto1.The/df 1.489,whichwaslessthan2; and the factor catorsdifferedsignificantlyfrom dozeroaote. **p .01, bsc Factor Loading Values, -- Fixed parametersnotat reportS.E. an2 of .01. The squared multiple correlationsstatisticalsignificancelevelhi-square 29.779,2 df 20, p 0.074, ! /df 1.489, RMSEA 0.031, RMR 0.017,(R )0.971of all indicators ranged from 0.247-0.540 (Table 3). Finally,FI 0.987, AGFIthe scientific-attitudes measurement model is shown in Figure 2.CURDETACCPRUHONFRUBEIRANCREgure 2. Scientific-attitudesmodelFigure2measurement2. Scientific-attitudesmeasurement model Note.2 20, p-value 0.074, GFI 0.987, CFI 0.994,/df 1.489,df te. Chi-square 29.779,!Chi-square 29.779, /df 1.489, df 20, p-value 0.074,MR 0.017, RMSEAGFI 0.031 0.987, CFI 0.994, RMR 0.017, RMSEA 0.031.Results on Construct Validity Testing of Attitudes towards theScience Measurement Model from the 1st -Order CFAAttitudes towards science (ATSCI) consisted of four indicators, asshown in Figure 3. The means were from 3.857-4.024, and standarddeviations were from 0.580-0.814, which indicated that studentspossessed all attributes of attitudes towards science at a high level(Mean 3.51-4.50).
CFAdes towards science (ATSCI) consisted of four indicators, as shown in Figure 3. The means wJournal of Learning and Instruction: Vol. 15 (No. 2) Dec 2018: 1-3114 standardMalaysian3.857-4.024, anddeviationswere from 0.580-0.814, which indicated that students possesributes of attitudes towards science at a high level (Mean 3.51-4.50).e 3. Means of indicators as factors of attitudes towards scienceFigure 3. Means of indicators as factors of attitudes towardsscience.4 shows the results from the PPMC analysis. From the PPMC analysis of the four indicators, aassociated six pairs of correlations, the indicators were shown to significantly differ from zero, aical significance level of .01. All pairs also had positive correlation values, with correlatTable 4cients from 0.23-0.47, as shown in Table 4. Bartlett's test of sphericity returned a Chi-square va.955, df 6, and p .000, which was significantly different from zero at a statistical significanMeans, Standard Deviations, and Correlation Coefficients ofof .01. This was also consistent with the result of the Kaiser-Meyer-Olkin (KMO) index analyObserved Variables or Indicators in the Attitudes towards Scienceequaled 0.717. The value near 1 indicated that the correlation matrix of the observed variable or(ATSCI) Measurement Model for Students (n 500)dicator was not a unit matrix, and the correlation between variables was high enough to usezing construct validity factors.Correlation coefficientObserved4variablesINS CoefficientsSVA of ObservedBVS VariablesVESor Indicators in thes, Standard Deviations,and Correlationdes towards Science (ATSCI) Measurement Model for Students (n 500)INSSVABVS INSVES1.000Mean0.46**Std. 000Correlation coefficientObserved0.45**1.000 857SVA1.0000.5800.814BVS0.45**1.000 3.857Note. **p .01, KMO: Kaiser-Meyer-Olkin Measure of Samplingd. Deviation adequacy 0.7520.5800.814 379.955,0.710 0.717, Bartlett’s testof sphericity: Chi-Square. **p .01, KMO:Measure of Sampling adequacy 0.717,df Kaiser-Meyer-Olkin6, p .000ett’s test of sphericity: Chi-Square 379.955, df 6, p .000Table 4 shows the results from the PPMC analysis. From the PPMCof theindicators,and theirassociatedsix pairsof correlations,5 shows theanalysisresultson fourconstructvaliditytestingof theattitudestowards science omzero,atastatisticalrement model. From it, the model was shown to be consistent with the empirical data, as C2significancelevelp of.01. AllAlso,pairs !alsohad positivevalues,differedfrom correlationzero with nostatistical significane value 0.413,df 1, and howninTableover, RMSEA 0.000 and RMR 0.003, which were close to 0. The values 4.for GFI 1.000 a2Bartlett’stest oftosphericityreturnedvalue 379.955,df than6, 2, with the fac/df 0.413,whichwas less 0.996, whichwere close1. The valuefora!Chi-squareandindicatorsp .000, whichwas significantlysignificantly differentfromat a statisticalg values of alldifferingfrom zeroat zeroa statisticalsignificance level of theresultof the from 0.313-0.65 also shows the squared multiple correlations (R ) of all indicators rangede 4 presents the attitudes towards science (ATSCI) measurement model.
Malaysian Journal of Learning and Instruction: Vol. 15 (No
(CFA) was carried out with SPSS AMOS software Version 23. Findings - The testing of the scientific-mind measurement model for secondary school students in Bangkok was consistent with the empirical data. The scientific-mind factors consisted of two indicators, including scientific attitudes and attitudes towards science. Scientific