Transcription
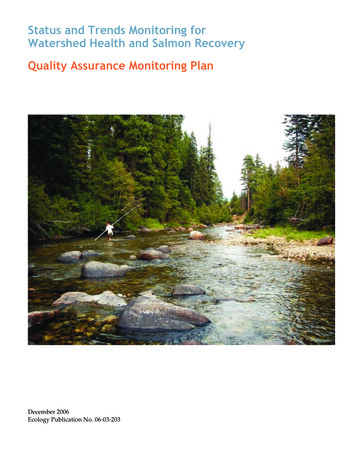
Status and Trends Monitoring forWatershed Health and Salmon RecoveryQuality Assurance Monitoring PlanDecember 2006Ecology Publication No. 06-03-203
Publication InformationThis Quality Assurance MonitoringPlan is available on the Department ofEcology’s website athttp://www.ecy.wa.gov/biblio/0603203.htmlMore information is availableon the Status and Trends StatewideMonitoring Framework website athttp://www.ecy.wa.gov/programs/eap/stsmf/The Study ID is WHM WAM0 as of April 27, 2017.For more information contact:Publications CoordinatorEnvironmental Assessment ProgramWashington StateDepartment of EcologyP.O. Box 47600Olympia, WA 98504-7600E-mail: jlet461@ecy.wa.govPhone: (360) 407-6764If you need this publication in analternate format, call Joan LeTourneauat (360) 407-6764. Persons with hearingloss can call 711 for Washington RelayService. Persons with a speech disabilitycan call 877-833-6341.Front cover photo:Brian Engeness taking thalwegmeasurements on Nason Creek,Chelan County, 2006.Photo by Dylan Monahan
Status and Trends Monitoring forWatershed Health and Salmon RecoveryQuality Assurance Monitoring PlanbyWashington StateDepartment of Ecology:Robert Cusimano, Project ManagerGlenn Merritt, Technical LeadRobert PlotnikoffChad WisemanWashington State ConservationCommission:Carol SmithWashington Departmentof Fish and Wildlife
List of AcronymsThis list contains acronyms used frequently in this document. Other acronyms areused infrequently and defined only in the text.EMAPEnvironmental Monitoring and Assessment Program (EPA)EPAU.S. Environmental Protection AgencyESAEndangered Species ActESUEvolutionarily significant unitsISEMPIntegrated Status and Effectiveness Monitoring ProgramLWDLarge woody debrisMQOMeasurement quality objectivesNOAANational Oceanic and Atmospheric AdministrationPSRRPuget Sound Salmon Recovery RegionQAQuality assuranceQCQuality controlRSDRelative standard deviationRIVPACS River InVertebrate Prediction and Classification SystemPage iiSRRSalmon Recovery RegionSSHIAPSalmon and Steelhead Habitat Inventory and Assessment Program (WDFW)WDFWWashington Department of Fish and WildlifeWRIAWater Resource Inventory Area
Table of ContentsPublication Information . . . . . . . . . . . . . . . . . . . . . . . . . . . inside front coverList of Acronyms . . . . . . . . . . . . . . . . . . . . . . . . . . . . . . . . . . . . . page iiTable of Contents . . . . . . . . . . . . . . . . . . . . . . . . . . . . . . . . . . . . page iiiList of Tables and Figures. . . . . . . . . . . . . . . . . . . . . . . . . . . . . . . . page vAbstract . . . . . . . . . . . . . . . . . . . . . . . . . . . . . . . . . . . . . . . . . . page viIntroduction and Needs Statement . . . . . . . . . . . . . . . . . . . . . . . . . . page 1Summary . . . . . . . . . . . . . . . . . . . . . . . . . . . . . . . . . . . . . . . . . . page 2PART 1: Project Planning and ManagementBackground . . . . . . . . . . . . . . . . . . .Salmon Habitat Limiting Factors . . . . .Information Needs and Approach . . . .Participation in the Program . . . . . . .page 4page 4page 4page 4page 6Program Description · · · · · · · · · · · · · · · · · · · · · · · · · · · · · · · · · · page 7Program Goals. . . . . . . . . . . . . . . . . . . . . . . . . . . . . . . . . . . . . page 7Program Objectives. . . . . . . . . . . . . . . . . . . . . . . . . . . . . . . . . . page 7Benefits. . . . . . . . . . . . . . . . . . . . . . . . . . . . . . . . . . . . . . . . . page 7Scales, Indicators, and Protocols . . . . . . . . . . . . . . . . . . . . . . . . . . page 8Program Constraints . . . . . . . . . . . . . . . . . . . . . . . . . . . . . . . . . page 9Organization and Schedule · · · · · · · · · · · · · · · · · · · · · · · · · · · · · page 10Organization . . . . . . . . . . . . . . . . . . . . . . . . . . . . . . . . . . . . . page 10Schedule . . . . . . . . . . . . . . . . . . . . . . . . . . . . . . . . . . . . . . . page 10Sampling Design Objectives · · · · · · · · · · · · · · · · · · · · · · · · · · · · · page 11Questions from the Comprehensive Monitoring Strategy (CMS) . . . . . . page 11Questions from the Northwest Forest Plan (Gallo et al., 2005) . . . . . . . . page 11Sampling Design · · · · · · · · · · · · · · · · · · · · · · · · · · · · · · · · · · · · page 12Probability-Based Sampling Design and Site Selection . . . . . . . . . . . . page 12Completeness . . . . . . . . . . . . . . . . . . . . . . . . . . . . . . . . . . . . page 18Comparability . . . . . . . . . . . . . . . . . . . . . . . . . . . . . . . . . . . . page 18Representativeness . . . . . . . . . . . . . . . . . . . . . . . . . . . . . . . . . page 19Fecal Coliform Monitoring. . . . . . . . . . . . . . . . . . . . . . . . . . . . . page 19Sampling Procedures · · · · · · · · · · · · · · · · · · · · · · · · · · · · · · · · · page 20Field Sampling. . . . . . . . . . . . . . . . . . . . . . . . . . . . . . . . . . . . page 20Sample Containers, Identification, Transportation, Chain of Custody . . . page 22Measurement Procedures · · · · · · · · · · · · · · · · · · · · · · · · · · · · · · · page 23Quality Control Procedures · · · · · · · · · · · · · · · · · · · · · · · · · · · · · page 24Field . . . . . . . . . . . . . . . . . . . . . . . . . . . . . . . . . . . . . . . . . . page 24Laboratory . . . . . . . . . . . . . . . . . . . . . . . . . . . . . . . . . . . . . . page 24Data Management Procedures · · · · · · · · · · · · · · · · · · · · · · · · · · · · page 25Database Design . . . . . . . . . . . . . . . . . . . . . . . . . . . . . . . . . . . page 25Data Compilation . . . . . . . . . . . . . . . . . . . . . . . . . . . . . . . . . . page 26Audits and Reports· · · · · · · · · · · · · · · · · · · · · · · · · · · · · · · · · · · page 27Audits . . . . . . . . . . . . . . . . . . . . . . . . . . . . . . . . . . . . . . . . . page 27Reports . . . . . . . . . . . . . . . . . . . . . . . . . . . . . . . . . . . . . . . . page 27Table of ContentsPage iii
Table of Contents (cont.)Data Verification and Validation · · ·Data Verification . . . . . . . . . . .Data Validation . . . . . . . . . . . .Missing Data . . . . . . . . . . . . . .Data Quality (Usability) Assessment ·.·.·.·.·.·.·.page 29page 29page 29page 29· · · · · · · · · · · · · · · · · · · · · · · page 30PART 2: Indicators. . . . . . . . . . . . . . . . . .Water Quality Indicator . . . . . . . . . . . . . .Sampling Procedures . . . . . . . . . . . . . .Measurement Procedures. . . . . . . . . . . .Measurement Quality Objectives . . . . . . .Quality Control . . . . . . . . . . . . . . . . .Data Management, Review, and Validation .page 31page 31page 32page 32page 33page 33page 36Physical Habitat Indicator · · · · · · · · · · · ·Sampling Procedures . . . . . . . . . . . . . .Measurement Procedures. . . . . . . . . . . .Measurement Quality Objectives . . . . . . .Quality Control . . . . . . . . . . . . . . . . .Data Management, Review, and Validation .Biological Indicators · · · · · · · · · · · · · · · ·Sampling Procedures . . . . . . . . . . . . . .Measurement Procedures. . . . . . . . . . . .Measurement Quality Objectives . . . . . . .Quality Control . . . . . . . . . . . . . . . . .Data Management, Review, and Validation .Riparian and Upland Landscape Indicators· ·.·.page 37page 39page 39page 40page 40page ·.·.page 41page 41page 42page 43page 44page 45· · · · · · · · · · · · · · · · · · page 46References . . . . . . . . . . . . . . . . . . . . . . . . . . . . . . . . . . . . . . . . page 47Appendices . . . . . . . . . . . . . . . . . . . . . . . . . . . . . . . . . . . . . . . . page 53Appendix A: A Rotating Panel Design . . . . . . . . . . . . . . . . . . . . . . page 53Appendix B: Method Development: Aerial PhotographicSampling of Non-wadeable Rivers and Streams . . . . . . . . . . . . . . . . page 53Page ivTable of Contents (cont.)
List of Tables and FiguresTABLES:Table 1: Limiting factors identified by the state and federal government for Pacific salmonid species listed under ESA . . . . . . . page 4Table 2: Some of the historical and ongoing probability surveys in Washington State. . . . . . . . . . . . . . . . . . . . . . page 6Table 3: Organizations involved, contacts, and duties. . . . . . . . . . . . . . . . . . . . . . . . . . . . . . . . . . . . . . page 10Table 4: Logistics schedule for the status and trends program . . . . . . . . . . . . . . . . . . . . . . . . . . . . . . . . . page 10Table 5: The site sampling rotation in Salmon Recovery Regions (SRRs). . . . . . . . . . . . . . . . . . . . . . . . . . . . page 13Table 6: Allocation of randomized sample sites within any given Salmon Recovery Region (SRR) . . . . . . . . . . . . . . page 13Table 7: Metric descriptions for habitat and water quality monitoring. . . . . . . . . . . . . . . . . . . . . . . . . . . . . page 15Table 8: Environmental monitoring programs from which the status and trends program will draw results for periodic reporting. . page 16Table 9: Typical timing of on-site field activities for wadeable streams. . . . . . . . . . . . . . . . . . . . . . . . . . . . . page 20Table 10: Range of times for non-wadeable rivers/streams field activities (modified from Lazorchak et al., 2000). . . . . . . page 20Table 11: Methods, containers, and treatments for water quality parameters. . . . . . . . . . . . . . . . . . . . . . . . . . page 22Table 12: Preservation requirements: Water quality indicator. . . . . . . . . . . . . . . . . . . . . . . . . . . . . . . . . . page 32Table 13: Methods: Water quality indicator . . . . . . . . . . . . . . . . . . . . . . . . . . . . . . . . . . . . . . . . . . page 32Table 14: Measurement quality objectives: Water quality indicator . . . . . . . . . . . . . . . . . . . . . . . . . . . . . . page 33Table 15: Field quality control measurements: Water quality indicator. (Modified from Paulsen 1997). . . . . . . . . . . . . page 34Table 16: Range and 90th percentile of historical ambient water quality samples in Washington State . . . . . . . . . . . . page 35Table 17: Data validation: Water quality indicator. . . . . . . . . . . . . . . . . . . . . . . . . . . . . . . . . . . . . . . . page 36Table 18: Data reporting criteria: Water quality indicator. . . . . . . . . . . . . . . . . . . . . . . . . . . . . . . . . . . . page 36Table 19: Relevance of measured attributes to salmon and trout habitat requirements: physical habitat indicator. . . . . . . page 37Table 20: Precision of physical habitat metrics (Kaufmann 1999, Oregon data). . . . . . . . . . . . . . . . . . . . . . . . . page 38Table 21: Methods: Physical habitat indicator. . . . . . . . . . . . . . . . . . . . . . . . . . . . . . . . . . . . . . . . . . page 39Table 22: Measurement quality objectives: Physical habitat. . . . . . . . . . . . . . . . . . . . . . . . . . . . . . . . . . . page 40Table 23: Field quality control measures: Physical habitat. . . . . . . . . . . . . . . . . . . . . . . . . . . . . . . . . . . . page 40Table 24: Data review and validation checks. . . . . . . . . . . . . . . . . . . . . . . . . . . . . . . . . . . . . . . . . . page 40Table 25: Methods: Benthic macroinvertebrates. . . . . . . . . . . . . . . . . . . . . . . . . . . . . . . . . . . . . . . . . page 42Table 26: Methods: Aquatic vertebrates. . . . . . . . . . . . . . . . . . . . . . . . . . . . . . . . . . . . . . . . . . . . . page 42Table 27: Measurement quality objectives: Biological communities. . . . . . . . . . . . . . . . . . . . . . . . . . . . . . . page 43Table 28: Field quality control: Biological communities. . . . . . . . . . . . . . . . . . . . . . . . . . . . . . . . . . . . . page 44Table 29: Laboratory and analytical quality control: Biological communities. . . . . . . . . . . . . . . . . . . . . . . . . . page 44Table 30: Data validation quality control: Biological communities. . . . . . . . . . . . . . . . . . . . . . . . . . . . . . . page 45Table 31: Important landscape metrics and source data. . . . . . . . . . . . . . . . . . . . . . . . . . . . . . . . . . . . . page 46Table A-1: Number of sites sampled in each landscape area (by year). . . . . . . . . . . . . . . . . . . . . . . . . . . . . page 53Table B-1: Attributes and associated statistics proposed for testing by aerial photography in non-wadeable rivers and streams. . page 54FIGURESFigure 1: Eight large monitoring regions based on Salmon Recovery Regions (SRRs); and 62 smaller monitoring regions . . . page 5Figure 2: Non-federal lands of Washington State (in gray). . . . . . . . . . . . . . . . . . . . . . . . . . . . . . . . . . . . page 9Figure 3: The relationship of field-sampled metrics to limiting factors. . . . . . . . . . . . . . . . . . . . . . . . . . . . . page 14Figure 4: Example upslope and riparian landscape metrics from Comeleo (2005), Wade and Ebert (2005), and NLDC (2006). . . page 17Figure 5: Wadeable stream sampling reach features (modified from AREMP, 2006; Moberg, 2006; and Peck et al., 2003). . . page 21Figure 6: Non-wadeable river/stream sampling reach features (modified from Lazorchak et al., 2000). . . . . . . . . . . . page 21Figure 7: Water sampling (modified from Paulsen, 1997). . . . . . . . . . . . . . . . . . . . . . . . . . . . . . . . . . . . page 23Figure 8: Macroinvertebrate sampling with a 500-µm mesh kick net . . . . . . . . . . . . . . . . . . . . . . . . . . . . . . page 23Figure 9: Field quality control (from Paulsen, 1997). . . . . . . . . . . . . . . . . . . . . . . . . . . . . . . . . . . . . . . page 34Figure 10: Possible sampling locations within each riffle . . . . . . . . . . . . . . . . . . . . . . . . . . . . . . . . . . . . page 41List of Tables and FiguresPage v
AbstractTJill Lemmon andBrian Engeness collectinghabitat data on Nason Creek,Chelan County, 2006.Photo by Dylan MonahanPage vihis document describes a qualityassurance monitoring plan forconducting a statewide, probabilitybased sampling program. The goalof the monitoring is to providequantitative, statistically valid, andconsistent estimates of the status andtrends in the physical, chemical, andbiological conditions of Washington’srivers and streams. The data collectedunder this plan can be used to reporton the health of salmonid habitat.Abstract
Introduction and Needs StatementRecent and historical degradationof Washington’s rivers and streamshas contributed to the decline ofsalmon, steelhead, and trout populations, resulting in Endangered SpeciesAct (ESA) listings throughout most ofthe state. In response to ESA listings,the state, the federal government,private industry, and the tribes haveinvested substantial resources to restoreand protect the ecological function ofthese rivers and streams.The fate of salmon in the Northwestis dependent on coordinated, long-termmonitoring at the regional scale(Spence et al., 1996). In 2005 theGovernor’s Forum on Monitoringsponsored a workshop to determinewhether high-level indicators ofsalmon recovery and watershed healthreported biennially in the WashingtonState of Salmon in Watersheds reportcould be improved. One of the majorconclusions from the workshopwas that the indicators could not beimproved using existing monitoringinformation.At this time, there are a numberof independent habitat and waterquality monitoring efforts occurringthroughout Washington (MonitoringOversight Committee, 2002c). Many ofthese efforts have documented statusand trends relevant to their specificproject objectives and geographic areas.However, these monitoring effortscannot be combined and evaluatedcollectively because they are basedon different objectives, designs, andinconsistent methods for measurement;and the monitoring focuses on differentgeographic scales.Introduction and Needs StatementIn addition, the statewide limitingfactors report estimated that 43%of the Water Resource Inventory Area(WRIA)-scale habitat ratings wereeither data gaps or unknown conditions(Smith, 2005).Without a program to monitorhabitat conditions across the state, mostof the existing and current monitoringinformation cannot be updated, andmany of the identified data gaps willcontinue to be unfilled, decreasing thecertainty of success of salmonid habitatrestoration actions. At this time, thereis no new quantitative monitoringinformation to assemble future State ofSalmon in Watersheds reports.In response to recommendationsfrom the Governor’s Forum onMonitoring, the Washington SalmonRecovery Funding Board funded thedevelopment of this quality assurancemonitoring plan (Status and TrendsMonitoring Plan). This plan describes amonitoring program that will providea consistent, objective picture of thehealth of stream and river corridorhabitat and will detect trends. It willalso help policy makers in each regionprioritize the environmental featuresand limiting factors that are in mostneed of being addressed for protectionof watershed health and salmonrecovery.This plan was prepared by theWashington State Department ofEcology, Washington StateConservation Commission, andWashington Department of Fishand Wildlife in collaboration withrepresentatives of federal, state, andlocal governments; and tribes andprivate groups.The fate of salmonin the Northwestis dependent oncoordinated,long-termmonitoring atthe regional scalePage 1
SummaryRequired Elements:ü A common set ofprotocolsü Aquatic assessmentsü A sustainablemonitoring programü Funding for localpartnersü Quality assurance andtrainingü Common datamanagement systemBrian Engeness collectingthalweg readings(and avoiding mosquitoes)on the upper Chiwawa River,Chelan County, 2006.Photo by Jim GarnerPage 2The Status and Trends MonitoringPlan describes a probabilistic sampling design (or framework,) as well asstandardized monitoring protocols forassessing the water quality and habitatof the rivers, streams, and watershedsin Washington State.The indicators under this plan willaddress the salmonid habitat “limitingfactors” identified by the U.S. Department of Commerce National MarineFisheries Service for each of the Endangered Species Act evolutionarily significant units (ESUs) for salmon andsteelhead. These indicators can also address factors affecting distinct population segments (DPSs) of bull trout.Without implementing this plan, thereis little prospect of collecting theneeded information for reporting onthe water quality and habitat status ofour river and stream resources.The organizations that participatedin developing the plan identified thefollowing as required elements:u A common set of protocols that canbe used by those interested in assessingwater quality and habitat conditions.u Aquatic assessments that answer keyquestions needed to make resource andregulatory decisions for salmon population recovery.u A sustainable monitoring programthat can be maintained for a reasonableperiod of time.u Funding for local partners to main-tain their participation.u Paid scientists who can provide over-all quality assurance for the program aswell as train volunteer groups who cancontribute meaningful information tothis monitoring effort.Summary
u A common data managementsystem, maintained by a designatedagency or consortium, that can be usedfor data analysis and preparing reportsdetailing watershed health.The framework is based on the targetpopulation of streams and riverspresent on a 1:24,000 scale hydrographycoverage. The overall monitoringprotocol is based on samplingtechniques that have been broadly applied across the Northwest:u Pacific Northwest AquaticMonitoring Partnership (PNAMP)u Environmental Monitoring andAssessment Program (EMAP)u Aquatic and Riparian EffectivenessMonitoring Program (AREMP)u Integrated Status and EffectivenessMonitoring Program (ISEMP)The sampling methods are taken fromeach of these closely-related efforts.Specific protocols are those that webelieve to be the simplest, leastexpensive, reliable, and therefore thebest for training persons at any levelof experience, including volunteers.We limited the basic reporting metricsto a small but powerful set. These basic(minimum required) metrics include:(1) Metrics that have “poor” valuesextensively, due to human effects, and(2) metrics that indicate risk to instreambiology.In addition to this basic set, metrics foreach WRIA (or smaller region) can beadded to determine local needs.SummaryThe framework will allow estimatesto be made about the water qualityand habitat conditions of the targetpopulation with /-10% precision and80% confidence in the estimates. Datarequired to make these estimates willbe collected over a four-year period.Sampling sites are selected froma master sample of site locationsdeveloped for this framework. The plancovers sampling on non-federal lands,but it also allows for anyone, includingfederal land managers, to use thesame master list and protocols forcomparable monitoring that wouldstrengthen the assessment. Wepropose selecting sampling sites thatwill represent three significant scales:u The Salmon Recovery RegionsSpecific protocolsare those thatwe believe to bethe simplest,least expensive,reliable, andtherefore thebest for trainingpersons at any levelof experience,includingvolunteers.(SRRs)u Water Resource Inventory Areas(WRIAs)u StatewideInformation collected at these scalescan be used to determine the overalleffectiveness of efforts to improvewatershed health and recover salmonpopulations. By adding results fromfederal monitoring with the conditionsto be reported from this plan, we canprovide an assessment that covers thestate.As part of this plan, a pilot projectis proposed (Appendix B) to detecthabitat characteristics by testingaerial photographic sampling.Page 3
PART 1: Project Planningand ManagementBackgroundSalmon HabitatLimiting FactorsInformation Needsand ApproachThe Salmon Habitat Limiting Factors inWashington State report estimated that38% of the WRIA-scale habitat ratingswere poor, followed by 7% fair and13% good conditions. Perhaps evenmore notable is that the remaining43% of the ratings were either data gapsor unknown conditions (Smith, 2005).The Governor’s Salmon RecoveryOffice (GSRO) and the National MarineFisheries Service (NOAA-Fisheries)reported criteria necessary for officialcoast-wide recovery of salmonid species listed under the ESA. The detailsfor riparian and instream habitat factorsthat limit survival of salmon populations were further discussed at theGovernor’s Forum on Monitoring(2005). The limiting factors (Table 1)are addressed in the State’s LimitingFactors Analysis (GSRO, 2004) and inthe Pacific Coastal Salmon RecoveryFund 2005 Report to Congress (PCSRF,2005).A major gap in monitoring watershedhealth and salmon recovery ismeasuring the status and trends ofstreams, rivers, and nearshoreestuaries, including landscape-formingprocesses at spatially contiguous scalesthat are useful to policy makers.Salmon recovery plans are requiredby the ESA. NOAA-Fisheries hasdetermined that the plans should bedeveloped based on evolutionarysignificant units (ESUs), or on a regional basis. Regional recovery organizations or Salmon Recovery Regions(SRRs) have been formed as part of theGovernor’s salmon recovery strategy.In addition, water issues are managedin the state using Water ResourceInventory Areas (WRIAs) that aredefined in Chapter 173-500 WAC asit existed on January 1, 1997. Figure 1shows SRR and WRIA geographicboundaries.Table 1: Limiting factors identified by the state and federal government for Pacificsalmonid species that are listed under the Endangered Species Act (ESA).Organization(reference)Limiting Factors IdentifiedGSRO (2004)Access (e.g., dams, hanging culverts), floodplain, sediment,in-stream processes, riparian conditions, water quality, flowPCSRF (2005)Floodplain/channel structure, estuaries, riparian conditions, largewoody debris, sediment, water quality, flow, and predationGSRO - Governor’s Salmon Recovery OfficePCSRF - Pacific Coastal Salmon Recovery FundPage 4PART 1: Project Planning and Management
One of the important needs fordetermining salmon recovery is theability to describe, with known certainty, what changes have occurredin the status and trends of habitatconditions affecting watershed healthand salmon recovery statewide. Thestatus and trends program describedin this document proposes to addressthese information needs by implementing a monitoring design using arandomized, site-selection approachmodeled after the U.S. EnvironmentalProtection Agency’s (EPA) Environmental Monitoring and AssessmentProgram (EMAP) at the SRR and WRIAgeographic scales.EMAP has been developed and usedto report on the state of the waters in theUnited States. EPA has partnered withstate agencies in order to pass on thetechnology to state and local governments. Extensive work with the EMAPexperimental design, protocol development, data management, and development of indicators has been completed.This site-selection and samplingapproach had been examined andendorsed in the ComprehensiveMonitoring Strategy (Monitoring OversightCommittee, 2002a, 2002b, 2002c). Other,related programs (AREMP, ISEMP)sample in similar ways, and we candraw from these also.Figure 1: Eight large monitoring regions based on Salmon Recovery Regions (SRRs); and 62 smaller monitoring regions:Water Resource Inventory Areas (WRIAs). This plan addresses non-federal portions of these regions. Names andinformation for WRIAs are available at this Internet link: T 1: Project Planning and ManagementPage 5
Participation in the ProgramMany monitoring participants have apotential interest in becoming a part of astatewide effort. However, most of thegroups currently involved in monitoringprograms need to collect site-specificinformation to support their local management decisions and funding requirements.The list of participants who attended the workshops used to developthis plan might provide a beginning listof organizations that could contributeto the sampling effort. These includemembers of counties, municipalities,volunteer groups, tribes, and federaland state agencies.Although there is interest inparticipating in a status and trendsprogram, local governments andvolunteer groups would requiresufficient funding to maintain aminimal program.A limited number of entitieshave been assessing fish and habitatconditions using probabilistic siteidentification and unique samplingmethodologies (Table 2).Table 2: Some of the historical and ongoing probability surveys in Washington StateSurveyRegionLeadLinkISEMPWenatchee isions/cbd/mathbio/isemp/index.cfmOBMEPOkanogan BasinColville st Range EcoregionDept. of Ecologywww.ecy.wa.gov/programs/eap/fw benth/emap-remap.htmlREMAPCascades EcoregionDept. of Ecologywww.ecy.wa.gov/programs/eap/fw benth/emap-remap.htmlREMAPYakima BasinDept. of Ecologywww.ecy.wa.gov/programs/eap/fw benth/emap-remap.htmlREMAPUpper Chehalis BasinDept. of Ecologywww.ecy.wa.gov/programs/eap/fw benth/emap-remap.htmlEMAP-WStreams of WA, Western Dept. of Ecology/U.S.EPAwww.ecy.wa.gov/programs/eap/fw benth/emap-remap.htmlEMAP-WEstuaries of WA,Western U.S.EPAhttp://tinyurl.com/nqh7rWSAU.S. ex.htmlSHMPSkagit CountySkagit CountyPublic Workshttp://tinyurl.com/nsc9sAREMPNorthwest Forest PlanFederal LandsUSDA x.htmPIBOUpper ColumbiaFederal LandsUSDA /WLSLow-alkalinity Lakes /napap/wls.htmlNLFTSU.S. PSAMPPuget APISEMPNLFTSOBMEPPIBOPSAMPPSATREMAPSHMPWLSWSAPage 6Aquatic and Riparian Effectiveness Monitoring ProgramEnvironmental Monitoring and Assessment ProgramIntegrated Status and Effectiveness Monitoring ProgramNational Lake Fish Tissue StudyOkanogan Basin Monitoring and Evaluation ProgramPACFISH/INFISH Biological Opinion Effectiveness Monitoring ProgramPuget Sound Assessment and Monitoring Program (previously the Puget Sound Ambient Monitoring Program)Puget Sound Action TeamRegional Environmental Monitoring and Assessment ProgramSalmon Habitat Monitoring ProgramWestern Lakes SurveyWadeable Streams AssessmentPART 1: Project Planning and Management
Program DescriptionProgram GoalsBenefitsThe goal of this status and trendsmonitoring program is to providequantitative, statistically valid estimatesof status and trends in the physical,chemical, and biological conditions ofWashington’s rivers and streams. Thisincludes status and trends of limitingfactors identified for listed salmonidfishes.The “status” of a river or streamsystem is the condition of its physical,chemical, and biological characteristicsat a single point in time. Thesemeasurements made at different timeintervals into the future can be usedfor “trend” analysis.The specific indicator (or limitingfactor) results will be useful for discerning whether the cumulative effects ofall habitat restoration and pollutantreduction efforts in each region arebeneficial. If some aspects of cumulative restoration activities are notresponding as desired, then knowledgeof specific indicators will allow formaking changes through adaptivemanagement.A status and trends framework(i.e., broad-scale evaluation with consistent/comparable protocols) is the onlyway to realistically determine re
Watershed Health and Salmon Recovery Quality Assurance Monitoring Plan December 2006 Ecology Publication No. 06-03-203. . Project Manager Glenn Merritt, Technical Lead Robert Plotnikoff Chad Wiseman Washington State Conservation Commission: . These indicators can also ad-dress factors affecting distinct popula-tion segments (DPSs) of bull .