Transcription
How to Map A Sales ProcessThat Your Customers (and Salespeople!)Will FollowSales Process Improvement SeriesVolume 3, Version 2.1byMichael J. WebbPresidentSales Performance Consultants, Inc. 2004 by Michael J. Webb All rights reserved.If you did not receive this file directly fromSales Performance Consultants, Inc., it is an illegal copy!
DedicationTo Leslie, who’s unwavering support and commitment has always enabled me to pursue myquest.
Volume 3, Version 2.1How to Map a Sales Process that Your Customers(and Salespeople) Will FollowContentsINTRODUCTION TO VOLUME 3, V2.1 . 1PURPOSE AND STRUCTURE OF THIS BOOK . 2WHO SHOULD READ THIS BOOK . 3MAJOR BENEFITS OF SALES PROCESS MAPPING . 4OVERVIEW OF SALES PROCESS MAPPING . 6TYPICAL PROBLEMS AND “SOLUTIONS” IN SALES ORGANIZATIONS . 7REASONS TO MAP THE SALES PROCESS . 10KEY CONCEPTS BEHIND SALES PROCESS MAPPING . 12TWO CASES IN POINT . 16THE FUNDAMENTAL “FIX”. 18PREPARING FOR SALES PROCESS MAPPING INITIATIVE. 20GOALS OF A PROCESS MAPPING SESSION . 20IS YOUR ORGANIZATION READY? . 21SET THE RIGHT EXPECTATIONS . 23PREPARING TO LEAD THE PROCESS MAPPING SESSION. 25MORE POINTERS FOR FACILITATING THE PROCESS MAPPING SESSION . 28CONDUCTING THE SALES PROCESS MAPPING SESSION. 31ENSURE THAT EVERYONE UNDERSTANDS THE PROCESS APPROACH . 34STEP 1: IDENTIFY AND GROUP ACTIVITIES . 40STEP 2: CREATE A BASIC PROCESS MAP . 44STEP 3: REFINE THE PROCESS MAP . 55STEP 4: INTEGRATE THE PROCESS INTO THE ORGANIZATION . 57STEP 5: IMPLEMENT THE PROCESS . 59SALES PROCESS MEASUREMENT, REVISITED . 60CHARACTERISTICS OF STRONG AND WEAK PROCESS MAPS . 63APPENDIX I EXAMPLES OF SALES PROCESS MAPS . 65APPENDIX II AVOIDING THE FOUR MOST COMMON. 77APPENDIX III PROCESS MAPPING PRESENTATION TEMPLATES . 88APPENDIX IV FOR MORE INFORMATION . 89
Introduction to Volume 3, V2.0This is the third of three volumes in the Sales Process Improvement Series, which applyprinciples and practices of quality improvement to sales and marketing. This volume—How to Map a Sales Process that Your Customers—and Salespeople—Will Follow—shows you how to do exactly that. It shows you how to develop a sales process thatcreates value for customers as well as for your company.When a sales process creates value for customers, your customers will follow it. Whenyour customers follow the sales process, so will your salespeople. Sales processes arerarely designed to create value for customers. Usually, they aim to create value for thecompany doing the selling. That’s the major reason that customers don’t follow the salesprocess. It’s also why salespeople ultimately don’t follow it. Instead, they figure out forthemselves how to work around the sales process in order to make their numbers andmake a living.This workbook explains what I mean by the term “sales process” and provides ways ofcreating value for customers at every step of the process. The key tool in all of this, asthe title of this book indicates, is Sales Process Mapping. In this book I will first discussprocess mapping in general and then show how to map the sales process. (Incidentally, Igenerally use the term “sales process” in this volume to include marketing, sales, andservice, not just the sales department.)Process mapping is a visual way of identifying the activities and tasks in a business orwork process. Process mapping defines what gets done in a process, who does what, andwhat is produced at each stage. A process map resembles a flow chart and, like a flowchart, it can be drawn from a “35,000-foot altitude” to show only the major parts of aprocess, or from a more detailed, “lower altitude” perspective.In sales, the 35,000-foot altitude might cover activities such as Qualify Prospect, ConductSales Call, Submit Proposal, Close, and Set Up Account. Or the process map can zoomVolume 3: Sales Process MappingPage 1 of 90
in on a single part of the process. For instance, for Set Up Account, it could show CreateNew File, Assign Account Number, Establish Billing Cycle, and so on.There are different kinds of process maps for different types of processes, which youneedn’t worry about. For instance, I won’t burden you with ways of documentingtechnological processes, such as defining software system requirements. Instead, I’ll giveyou just what you need to map your sales process. Our goal here is to identify,coordinate, measure, and improve your marketing and selling activities.Specifically, we will use Sales Process Mapping to: Identify the best ways to create value for your customers and yourorganization Clarify working relationships between marketing, sales, andcustomer service Establish goals, priorities, and metrics to enhance the performanceof sales and marketing people Make the most of support functions, such as training anddevelopment, performance evaluation, and CRM software Establish a common language for focusing on the customer.In mapping your sales process, people in your marketing, sales, and service areas willlearn how what they do fits together and how it contributes to the organization. I havefound that this generates teamwork and energy in ways that pep talks and even financialincentives cannot.Purpose and Structure of this BookThe purpose of this book is to help marketing, sales, and general managers boost theperformance of marketing and sales. The last thing I want you to think is that salesprocess mapping is an end in itself. It is a tool that will give you a better grasp of yourmarketing and sales process than any other single initiative you could undertake. But itVolume 3: Sales Process MappingPage 2 of 90
does more than just improve your understanding. It also shows how to improve theresults generated by specific activities in the marketing and sales process and establishesongoing efforts to improve the overall process.Here’s how I’ve structured this book:Part 1 introduces you to process mapping in general and to sales process mapping inparticular. I explain these techniques, discuss reasons to map the sales process, and showwhy and how it improves sales results.In Part 2, you will learn how to judge your organization’s readiness for a sales processmapping initiative, how to prepare for such an initiative.Part 3 shows you how to conduct a sales process mapping session and includes a scriptedpresentation (complete with exhibits) for you to use in facilitating the session.Appendix I provides examples of Sales Process Maps for organizations in variousindustries.Appendix II discusses the four most common mistakes in sales process mapping andhow to avoid them.Appendix III provides a template for a sales process map and for process mappingsession exhibits. At the end of the book you will also find resources for moreinformation and a note on the author.Who Should Read This BookThis workbook is intended for people who want to lead a sales process mapping initiativein their sales organization. The book will guide you through the process of planning andconducting a five-step sales process mapping workshop.This is not a book for one person to use in isolation. Sales process mapping constitutes ateam effort, and that effort requires leaders. Thus this book is for:Volume 3: Sales Process MappingPage 3 of 90
Marketing and sales managers who want to improve the operationand results of their departments General managers with responsibility for their organization’s salesand marketing function Marketing and sales people who are preparing for managementroles and who want to understand sales as a process Quality and process improvement professionals who want to leador support a Sales Process Improvement or process mapping effortin their organization Management, sales, and marketing consultants and sales trainers,who want a deeper understanding of the sales process and whowant to help their clients develop such an understandingA sales process mapping session enables you, in a structured way, to set up an effectivesales process. An effective sales process demands collaboration across departments. Theinterconnectedness of process mapping helps people achieve that collaboration in a verylogical, unforced way.Major Benefits of Sales Process MappingIf you implement the recommendations in this workbook, you and your group will: Learn “who’s doing what” in your marketing, sales, and servicefunctions and how those activities mesh, or fail to mesh Create a map that shows how each step of your sales process candeliver value to your customers Identify and prioritize metrics that accurately portray the performanceof sales and marketing activities Develop the consensus needed for serious efforts to improve yourmarketing and sales activities—and their results—permanentlyVolume 3: Sales Process MappingPage 4 of 90
First, however, a few words of caution regarding things that this workbook does and doesnot do.This workbook does:This workbook does not: Enable you to develop anorganizational process map, anessential component in an overall SalesProcess Improvement initiative Provide everything you need to launcha change management, CRM, or globalre-engineering initiative. Help you identify your business’s valuefrom your customer’s perspectiveDeal with mapping detailed systemsrequirements (e.g., for softwaresystems) or operating procedures. Help you align marketing and salesefforts with those of quality or ITpeople Assume basic familiarity with flowcharting.Cover technical issues, such SADT andother mapping methodologies. (SADT,or Structured Analysis and DesignTechnique, is a graphical approach todescribing a system.) Provide detailed instruction on flowcharting techniques.Thus this book is for hands-on use by people who will work directly with sales andmarketing people to map and improve the sales process. The resulting map will identifyeach activity in the sales process, and its relationship with other activities, as well as theresults it produces. That’s essential knowledge if you are going to improve your salesprocess. In other words, without a sales process map, you won’t know the territory andwill probably wind up lost. With such a map, you can chart a clear path to salesimprovement.Volume 3: Sales Process MappingPage 5 of 90
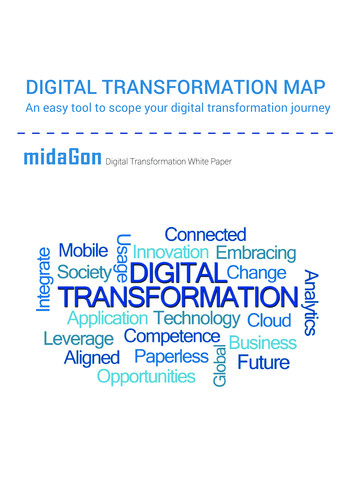
Part IOverview of Sales Process MappingSales Process Improvement assumes that sales is a process, and that you can improve aprocess by identifying its parts and individually improving each one. That’s also theassumption of process improvement: A work process comprises certain activities andeach of those activities can be improved, which will improve the results that they, and thewhole process, produce.Figure 1 shows a simple sales process map. Note that one of the key features is that themap shows how one activity feeds into the next. As you’ll see later, more complex mapsdetail each key activity, along with the results they produce. (A diamond-shaped boxdenotes a point where a decision must be made.)Draft Process llingInformationInformation Prepare osalCollateralCollateralGainAccessAsk for lationshipRelationshipPresentationPresentation2003 Copyright Sales Performance Consultants, Inc.Figure 1: A Simple Sales Process MapVolume 3: Sales Process MappingPage 6 of 90Orders27
A business process, such as a production process, takes inputs and by working on them,usually with machinery, converts them to outputs. Inputs are raw materials; outputs areproducts. The raw material of sales is people in the market for what you sell. Morespecifically, it is people who have the problems that your organization solves, or theopportunities that your organization helps them leverage. (This idea is covered in detailin How to Develop Qualification Criteria that Help You Find and Win Customers, whichis Volume 2 in the Sales Improvement Series.) The sales process converts those people tocustomers.So, people in the market with certain problems or opportunities (i.e., prospects) are the“input” and customers are the “output” of the sales process. Every marketing, sales, andservice activity plays a part in that conversion process. Each has a
Process mapping is a visual way of identifying the activities and tasks in a business or work process. Process mapping defines what gets done in a process, who does what, and what is produced at each stage. A process map resembles a flow chart and, like a flow chart, it can be drawn from a “35,000-foot altitude” to show only the major parts of aFile Size: 246KBPage Count: 17