Transcription
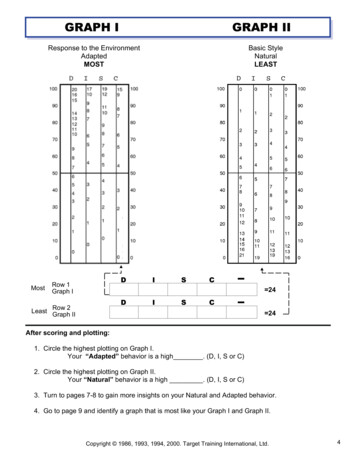
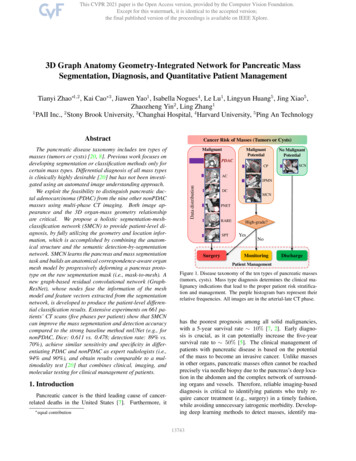
3D Graph Anatomy Geometry-Integrated Network for Pancreatic MassSegmentation, Diagnosis, and Quantitative Patient ManagementTianyi Zhao 1,2 , Kai Cao 3 , Jiawen Yao1 , Isabella Nogues4 , Le Lu1 , Lingyun Huang5 , Jing Xiao5 ,Zhaozheng Yin2 , Ling Zhang11PAII Inc., 2 Stony Brook University, 3 Changhai Hospital, 4 Harvard University, 5 Ping An TechnologyAbstract1. IntroductionPancreatic cancer is the third leading cause of cancerrelated deaths in the United States [7]. Furthermore, it equalcontributionMalignantMalignantPotentialNo MalignantPotentialPDACCPSCNACIPMNData distributionThe pancreatic disease taxonomy includes ten types ofmasses (tumors or cysts) [20, 8]. Previous work focuses ondeveloping segmentation or classification methods only forcertain mass types. Differential diagnosis of all mass typesis clinically highly desirable [20] but has not been investigated using an automated image understanding approach.We exploit the feasibility to distinguish pancreatic ductal adenocarcinoma (PDAC) from the nine other nonPDACmasses using multi-phase CT imaging. Both image appearance and the 3D organ-mass geometry relationshipare critical. We propose a holistic segmentation-meshclassification network (SMCN) to provide patient-level diagnosis, by fully utilizing the geometry and location information, which is accomplished by combining the anatomical structure and the semantic detection-by-segmentationnetwork. SMCN learns the pancreas and mass segmentationtask and builds an anatomical correspondence-aware organmesh model by progressively deforming a pancreas prototype on the raw segmentation mask (i.e., mask-to-mesh). Anew graph-based residual convolutional network (GraphResNet), whose nodes fuse the information of the meshmodel and feature vectors extracted from the segmentationnetwork, is developed to produce the patient-level differential classification results. Extensive experiments on 661 patients’ CT scans (five phases per patient) show that SMCNcan improve the mass segmentation and detection accuracycompared to the strong baseline method nnUNet (e.g., fornonPDAC, Dice: 0.611 vs. 0.478; detection rate: 89% vs.70%), achieve similar sensitivity and specificity in differentiating PDAC and nonPDAC as expert radiologists (i.e.,94% and 90%), and obtain results comparable to a multimodality test [20] that combines clinical, imaging, andmolecular testing for clinical management of patients.Cancer Risk of Masses (Tumors or oringDischargePatient ManagementFigure 1. Disease taxonomy of the ten types of pancreatic masses(tumors, cysts). Mass type diagnosis determines the clinical malignancy indications that lead to the proper patient risk stratification and management. The purple histogram bars represent theirrelative frequencies. All images are in the arterial-late CT phase.has the poorest prognosis among all solid malignancies,with a 5-year survival rate 10% [7, 2]. Early diagnosis is crucial, as it can potentially increase the five-yearsurvival rate to 50% [5]. The clinical management ofpatients with pancreatic disease is based on the potentialof the mass to become an invasive cancer. Unlike massesin other organs, pancreatic masses often cannot be reachedprecisely via needle biopsy due to the pancreas’s deep location in the abdomen and the complex network of surrounding organs and vessels. Therefore, reliable imaging-baseddiagnosis is critical to identifying patients who truly require cancer treatment (e.g., surgery) in a timely fashion,while avoiding unnecessary iatrogenic morbidity. Developing deep learning methods to detect masses, identify ma113743
lignancies, provide diagnoses and predict cancer prognosishas the potential to revolutionize pancreatic cancer imaging[4, 2, 8, 36, 27, 32, 30].Multi-phase computed tomography (CT) is the first-lineimaging modality for the diagnosis of pancreatic diseases.Differential diagnosis of pancreatic masses is challengingfor several reasons. (1) The same type of mass may appear in different textures, shapes, contrasts, and differentenhancement patterns across CT phases. (2) Pancreaticductal adenocarcinoma (PDAC) accounts for most cases inpancreatic cancer specialized hospitals, causing a long-tailproblem. (3) Masses, at times, are surrounded by inflamedtissues and thus cannot be easily identified. The pancreatic diseases in our database encompass ten types of masses(Fig. 1): PDAC, ampullary cancer (AC), bile duct cancer(DC), pancreatic neuroendocrine tumor (PNET), rare neoplasm (RARE), solid pseudopapillary tumor (SPT), chronicpancreatitis (CP), intraductal papillary mucinous neoplasm(IPMN), mucinous cystic neoplasm (MCN), and serous cystic neoplasm (SCN). To this end, we develop anatomyaware 3D deep graph networks to automatically segment,detect, and perform differential diagnosis of the underlyingdiseases.We tackle two main problems with strong clinical indications: 1) PDAC versus nonPDAC differentiation and2) clinical management of patients. PDAC is a uniquegroup with the most dismal prognosis. DistinguishingPDAC from nonPDACs is always the primary question toanswer. Patient management includes three recommendations: surgery, monitoring, and discharge (lower pannel inFig. 1) [20]. Patients with malignant masses require cancertreatment (e.g., surgery). Those with potentially malignantmasses require surgery if they are invasive or high-gradedysplasias, or monitoring otherwise. Those with nonmalignant masses could be safely discharged. Fine-grained classification of ten classes of masses using multi-phase CT isa very difficult long-tail problem.Existing automatic pancreatic mass image analysismethods [34, 36, 33, 35, 27, 32] focus on segmentationof certain types of tumors or cysts and thus cannot exploitthe full-spectrum taxonomy of pancreatic mass/disease diagnoses. For pancreatic disease diagnosis, both texture andgeometry cues are clinically useful. For instance, sometypes of masses appear at specific locations of the pancreas: AC and DC appear only at the pancreas head whileMCN rarely appears at the head. Others spread over theentire pancreas, such as CP and IPMN. Additionally, somesecondary signs of diseases are informative for diagnosis.Parenchymal atrophy and pseudocyst are observed in CP,causing a significant change in the shape of the pancreas.Most pancreatic cancers lead to dilatation of the pancreaticduct, with IPMN in particular abruptly modifying its caliber.To integrate such prior knowledge/correspondence intothe model, (1) we propose a segmentation based detection network which can segment and identify pancreaticdisease regions simultaneously. Our segmentation networktakes multi-phase CT scans as input and outputs segmentation masks of the pancreas (as the studied organ) and mass.We also develop a weak-supervised segmentation methodfor cases when we have all pixel-level PDAC annotationsbut only nonPDAC labels. (2) A mask-to-mesh algorithmis used to build a 3D correspondence-aware mesh from thepancreas segmentation output. The geometry of the pancreas, as well as the location, shape, and distributions ofthe detected mass can all be captured/encoded by the meshmodel. We present a mesh-based feature pooling methodthat extracts features from the segmentation network andpreserve the anatomic structure (each vertex of the meshhas its anatomic meaning). Based on a fixed vertex indexlist, the pancreas can be automatically divided or parsed intofour major sections: head, ventral body, dorsal body, andtail. (3) A geometry-integrated graph classification network utilizes the 3D anatomy correspondence-aware meshbased deep feature pooling to predict the pancreatic masstype. The network consists of graph-based residual convolutional blocks and an anatomy-based graph pooling layer.All the networks can be trained end-to-end via gradientbased optimization based on a loss function combining thesegmentation loss, mesh vertex classification loss, andglobal graph classification loss.Our main contributions are three-fold. (1) To the best ofour knowledge, this is the first work to propose a multiphase CT imaging analysis method for the full-spectrumtaxonomy of pancreatic mass/disease diagnosis. (2) We arethe first to integrate the 3D geometry-aware mesh model foreffective pancreatic mass (tumor or cyst) imaging analysis(Sec. 3.2, Sec. 3.3), explicitly capturing the anatomy-massintegrated geometry and texture cues. (3) We have extensively evaluated our models on 661 patients (five-phase CTscans per patient). We achieve a new state-of-the-art PDACsegmentation accuracy (Dice: 0.738) and a substantiallybetter nonPDAC segmentation (Dice: 0.611 vs. 0.478) anddetection accuracy (detection rate: 89% vs. 70%) comparedto the strong baseline method nnUNet. Our imaging-onlyautomated approach demonstrates comparable performancelevels with (a) expert radiologists in the differentiation ofPDAC versus nonPDAC who combine the analysis on clinical factors, imaging, and blood tests, and (b) a state-ofthe-art machine learning-based clinical patient managementsystem (i.e., surgery, monitoring, discharge) using the multimodality tests [20].2. Related WorkDeep Mesh Learning. Deep 3D reconstruction hasbeen extensively studied in the computer vision and graph123744
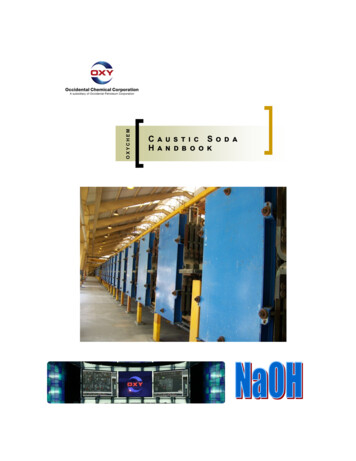
(a) 3D Deep NetworkSegmentation Loss(b) Mask-to-Mesh𝐹(𝑥)𝑥DeformationMask(c) Graph-ResNetVertex Classification LossVertex poolingvbH(ℎ𝑣𝑝 )hPrototypeFeature poolingℎ𝑞0G(ℎ0 )MeshRendert𝑑𝑏Global Classification Lossℎ𝑙 ZonesFigure 2. Flowchart of our proposed Segmentation-Mesh-Classification Network (SMCN). SMCN has three components: the pancreasmass segmentation network, the mask-to-mesh 3D anatomy modeling, and the global mass classification network. The mesh model is thebridge between the segmentation network and the classification network, who pools the features from the segmentation network into thevertex feature vectors in the graph classification network.ics fields [1, 12, 22, 25], and various methods have beenproposed to learn 3D shapes of organs from medical images [17, 29, 26]. The key component of mesh learning methods is the graph convolutional neural network(GCN) [15], typically used for graph-structured data processing. A liver mesh modeling method, inspired by thePixel2Mesh algorithm [22], is proposed in [29], which simultaneously generates the mesh model and segmentationmask with improved geometry and segmentation accuracies. Voxel2Mesh [26] learns the mesh of the liver directlyfrom 3D image volumes with a new mesh unpooling operation for better mesh reconstruction. However, all of thesemethods are designed specifically for organ segmentation,and it is not clear how their segmentation and mesh resultscould be used for diagnosis.Pancreatic Image Analysis. When manual segmentations of masses are available, radiomics schemes are commonly used to classify disease types [3, 6, 4]. However, heavy reliance on hand-annotated masks can makeradiomics models less reproducible and scalable. Toachieve automation, researchers have used detection-bysegmentation networks [35, 36, 27, 33] with U-Net as acommon backbone network [18]. More recently, nnUNet [13] (a self-adapting framework based on vanilla UNets) and its self-learning version have achieved competitive accuracy on PDAC segmentation [19, 23, 32]. Shapeinduced information, e.g., tubular structure of dilated duct,has been exploited along with the PDAC segmentation task[16, 27, 23] to improve diagnosis. Existing studies mainlyfocus on PDAC [36, 27, 27, 33, 3, 24] or PNET [35], whichcannot fully meet routine clinical needs on the full taxonomy of pancreatic tumor diagnosis. A comprehensive tax-onomy for pancreatic diseases has been clinically definedto help managing/treating patients [20] where a machinelearning model is built on top of clinical factors, imagingcharacteristics, and molecular biomarkers. These complexmeasurements require intensive labor costs and manual intervention, with reduced generalization and reproducibility.3. MethodsOur segmentation-mesh-classification framework is illustrated in Fig. 2, with three main components as below.3.1. Anatomy-Mass Segmentation NetworkThe inputs X of the segmentation network are multi(5)phase 3D CT scans, which are concatenated into a 4Dinput, X R5 W H D . The input Y is the label/annotation including the auto-segmented pancreas (byan ensemble nnUNet [13] model trained on a public pancreas dataset [19]) and radiologist-segmented PDAC andnonPDAC masses. It is represented by the one hot encodingY RK W H D . The numbers of labels K can differ bytask, i.e. PDAC vs. nonPDAC or patient management. Ourbackbone network is nnUNet.The pixel-level segmentationloss combines the cross-entropy and Dice losses:KX XLCE yk,w,h,d log(F (x)k,w,h,d ),w,h,d kLDC 2KXkPPF (x)k,w,h,d yk,w,h,dP,w,h,d yk,w,h,dw,h,d F (x)k,w,h,d w,h,dLSeg LCE LDC .(1)313745
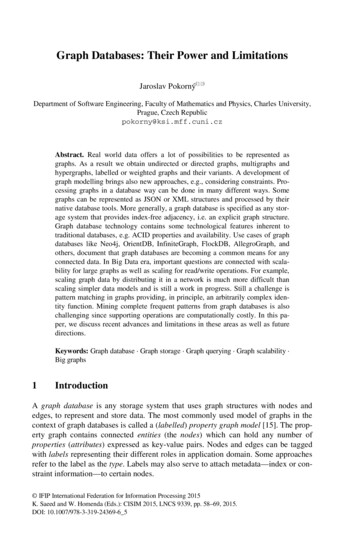
(a) Epoch 0(b) Epoch 20(c) Epoch 40(d) Epoch 60(e) SegmentationFigure 3. The 3D mesh deformation process. The mesh is initialized as the pancreas prototype (a). Given the pancreas-mass segmentationmask (e), the geometry of the mesh is deformed gradually to fit the surface of the segmentation mask, as in (b-d). Red: the head of pancreas;Blue: the ventral body of pancreas; Yellow: the dorsal body of pancreas; Green: the tail of pancreas.where F (x) is the softmax output of the network, F (x) RK W H D .NonPDAC labels are usually more difficult to obtain thanPDAC due to their diversified appearance in a long-tail distribution. As such, we can perform the PDAC vs. nonPDAC task using only the PDAC mask annotations (whennonPDAC ones unavailable) as follows. First, we train asegmentation model on the PDAC data alone, focusing onPDAC segmentation. Next, we apply the final PDAC segmentation model to the nonPDAC data. A large portionof the nonPDAC masses are solid tumors that can possibly be misdetected as PDAC. All raw detections from thenonPDAC dataset by the PDAC segmentation model arecollected as pseudo nonPDAC labels. Finally, we train anew segmentation network by using both original PDACand pseudo nonPDAC labels.3.2. 3D Mesh-based Anatomy RepresentationUnlike existing mesh learning methods [22, 26] that areinitialized by a randomized ellipsoid mesh, we encode theprior knowledge into our initial anatomy mesh by fitting itto the pancreas shape with anatomical meanings.Pancreas Anatomy. We first create a prototype meshbased on the average pancreas shape from the training fold.Afterwards, we place 156 vertices that are equally distributed on the surface of the prototype to build an anatomicstructure. In particular, we separate them among the fouranatomical regions of the pancreas, namely the pancreashead, ventral body, dorsal body and pancreas tail. The first48 vertices belong to the pancreas head, denoted as red dotsin Fig. 3. The 49-90th vertices belong to the ventral bodyof the pancreas, depicted by blue dots. The 91-135th vertices correspond to the dorsal body of the pancreas, shownin yellow dots. The last 21 vertices compose the tail of thepancreas, illustrated by green dots.Mask-to-mesh Process. The next step is to deform themesh to pancreas mask of each patient as the target (Fig.3-(e)). The geometry of the mesh can be deformed gradually to fit the surface of the segmentation mask, as in Fig.3(a-d), so as to preserve the true anatomy of the pancreas.In this way, our mesh could maintain the anatomical meaning after deformation. To guide this deformation process,we define a loss function composed of three terms: pointloss and two edge regularization terms. We define p to bethe vertex in the mesh and q the voxels of the surface inthe segmentation mask. Point loss, intuitively, measuresthe distance of each point to theP nearest point at the surfaceof the segmentation. Lpt p minq p q 22 . With thepoint loss, the pancreas mesh can be driven to fit the segmentation mask. Then we propose the first edge regularization Pterm in order to preserve the geometry of the mesh:Le1 e e mean(e) 22 , e p p′ 2 , p′ N (p)where N (p) is the neighboring vertices of p. Next, to penalize the flying vertices (i.e. abnormal vertices randomly updated during the deformation process, resulting in structureflaws), we propose the second edge regularizationloss toPsimply minimize the edge length: Le2 e e. Finally, theoverall loss isLmeshf it Lpt λ1 Le1 λ2 Le2(2)Note that mesh vertices can keep their anatomic meaningeven after the deformation process. The mesh fitting process can automatically parse the head, ventral body, dorsalbody, and tail of the pancreas and could better preserve theanatomical-aware information in the mesh deformation.Rendering. Based on the coordinates of the mesh vertices, we divide the pancreas into zones Z(p). Each voxelof the segmented pancreas volume is defined in a zone by itsnearest vertex, as shown in Fig. 2(b). The rendering methodto define the zones from the each vertex includes the following steps: 1) The vertex in a 3D volume A RW,H,D islabeled by its index, i.e., the ith vertex at (w, h, d) is labeledas i, Aw,h,d i. All the other voxels of A are set to zero. 2)The 3D volume A is dilated by one voxel as A′ . Each zerovoxel in A with a corresponding non-zero voxel in A′ thatbelongs to the pancreas in the segmentation output F (x) issubstituted with the corresponding voxel in A′ . 3) Repeatthe step 2) until all voxels have been updated.3.3. Global Mass Classification NetworkVertex Feature Pooling. Given a deformed mesh and itsrepresentative vertex zones, we integrate them into the deepnetwork for shape-constrained detection and segmentation.We encode the anatomical structure of the pancreas, as wellas the tumor’s texture and geometry into the feature vector.As such, the feature vector can be viewed as an anatomical143746
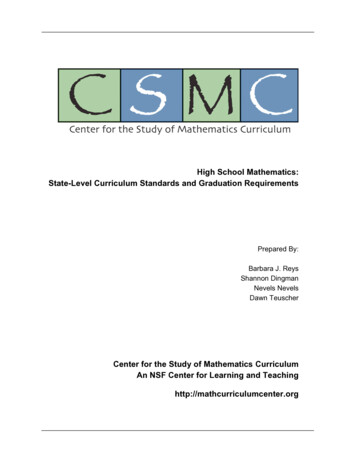
(a)(b)3D Deep Network(xi , yi , zi)levels. Each graph-based convolutional layer is defined as:Xhl 1 w0 hlp w1 hlp′(3)pp′ N (p)(c) ℎ𝑝0 :(e)(d)eijdiFigure 4. Illustration of the feature vector hi for the ith vertex.xi , yi , zi represents the location of the ith vertex. ei is the averageof all edge lengths eij (i.e., the distance from every neighboringvertex j of to i). di denotes the shortest distance from the ithvertex to the tumor surface.where hlp is the feature vector attached on vertex p at layerl of the Graph-ResNet. w0 and w1 are learned parameters,with w1 being shared by all edges. The graph-based convolutional layer accounts for the way in which vertices neighboring a given vertex regularize the vertex-to-neighbor exchange of information. We use two classification traininglosses: the vertex-level classification loss and the globalclassification loss. The vertex classification loss is definedas the cross-entropy loss and is applied to each vertex asLV ertex representation of the pancreas and tumor of interest. We define h0p as the initialized feature vector attached to vertex pof the pancreas mesh, as shown in Fig. 4(a,c). The anatomical feature representation contains the vertex coordinates(xp , yp , zp ), the average edge length to its neighbours ep ,the distance from p to the nearest tumor surface point dp ,and the local and global feature vectors pooled from prediction probability mapsP of the segmentation network. Morespecifically, ep p′ N (p) epp′ / N (p) (Fig. 4(d)) anddp minr p r 22 , where r is the point at the surface ofthe mass (Fig. 4(e)). The zone Z(p) then acts as the receptive field within which we pool the prediction probabilitymaps of the 3D segmentation network (F (x)) to obtain alocal feature vector, as shown in Fig. 4(b). The probabilitymaps within the receptive field can be represented as a list offeature vectors F (x)w,h,d RK , where (w, h, d) Z(p).In addition to Mesh-based Feature Pooling, we also perform global average pooling to get a global feature vectorfrom the probability map of the 3D segmentation Networkin Fig. 4 (b). We then concatenate the meta information,the local feature vectors of each individual vertex, and theglobal feature vector of the entire mesh to create the feature vector h0p . We explicitly encode the pancreas-to-tumorgeometry, the tumor’s location in the pancreas, and its texture in the mesh-based anatomy representation. This improves the model’s ability to learn anatomy-aware features,which will ultimately improve its performance in pancreaticmass/disease diagnosis based on the full-spectrum pancreatic disease taxonomy.Graph-ResNet. After obtaining feature vectors hi foreach vertex, we feed them into the graph-based residualconvolutional network (Graph-ResNet) which has provento be successful in a recent deep mesh learning application [22]. We reduced the original Graph-ResNet to asmaller network containing six graph convolutional layersand shortcut connections between every two layers to perform the tumor classification task under three granularityKXXpvyk,plog(G(h0 )k,p ),(4)kwhere G(h0 ) denotes the softmax output of the graph network at every vertex. The vertex label y v is inferred fromthe labeled mask. Background voxels are labeled as 0,pancreas voxels as 1, and voxels for all mass types withlabels greater than 1. The vertex q is labeled using themaximum value of the voxels in its corresponding zoneZ(p), ŷpv max(w,h,d) Z(p) ŷw,h,d . y v is the one-hotencoding of ŷ v . Considering that some mass types mayhave blurry boundaries and the mass neighbor Z(p) mayalso contain relevant cancer-related information, this labeling strategy and the propagation/smoothing property of theGraph-ResNet makes our approach robust to the quality ofsegmentation annotations or labels and increase the detection rates of masses.Global Mass Classification. After running GraphResNet, we pool four features from all four pancreatic regions according to the vertex indices (1-48, 49-93, 94-135,136-156), as shown in Fig. 2. These four global feature vectors and 156 local feature vectors are concatenatedinto one vector hvp , and fed into the final mass classification layer. The final global classification layer is a fullyconnected layer. The global classification loss is the crossentropy loss:KXLGlobal ykg log(H(hvp )k ),(5)kvpwhere H(h ) is the softmax output of the classificationlayer, and y g the patient-level mass/disease label. The overall loss function is the combination of three losses:L LSeg η1 LV ertex η2 LGlobal .(6)where η is a hyperparameter used to balance the three losscomponents. LSeg is the pixel-level segmentation loss , andLV ertex is the vertex classification loss (Eq.4). All networks, namely the 3D segmentation network and the classification Graph-ResNet, can be trained end-to-end by leveraging this global loss function.513747
Image4. ExperimentsLabelnnUNet [13]SMCNPDACData and Preprocessing. Our dataset contains 661 patients with surgical pathology-confirmed pancreatic masses(366 PDACs, 46 ACs, 12 DCs, 35 PNETs, 13 RAREs, 32SPTs, 43 CPs, 61 IPMNs, 7 MCNs, and 46 SCNs). Eachpatient has 5-phase CT scans: non-contrast (NC), arterialearly (AE), arterial-late (AL), venous (V), and delay (D).The median voxel size is 0.419 0.419 3mm. The manual annotations of masses was performed by an experiencedpancreatic imaging radiologist on the AL phase; CT scansfrom the other four phases are registered to AL by DEEDS[11]. Data augmentation is performed on-the-fly. This includes spatial transforms, Gaussian blur, and contrast shifting [13]. The hyper-parameters are set as λ1 10 4 ,λ2 10 2 , and η1 η2 0.1 based on preliminary experiments. All experiments are performed using nested threefold cross-validation. In each fold, the network is trainedfor 1000 epochs. The best model is selected based on itsperformance on the validation set. It is then applied to thetest set to generate the final experimental results.4.1. Evaluation on Mass SegmentationQuantitative Evaluation. Segmentation accuracy ismeasured using the Dice coefficient. Dice scores and detection rates of PDACs and nonPDACs (10 disease classes intotal) are provided in Table 1. A detection is considered successful if the intersection (between the ground truth and segmentation mask) over the ground truth is 10% (countedas 1); otherwise, it is considered a misdetection (countedas 0). Our SMCN network is compared to a strong baseline, 3D nnUNet [13], trained from scratch on our dataset.We find that integrating the 3D mesh-based anatomy representation into Graph-ResNet significantly improves masssegmentation and detection accuracies, especially for nonPDAC, as determined by Wilcoxon signed-ranks test (Dice:0.611 vs. 0.478; Detection rate: 88.7% vs. 69.3%).Qualitative Evaluation. Fig.5 illustrates the segmentation results for qualitative comparison. SMCN can guidethe segmentation network by integrating geometry cuesand achieve more complete segmentation results, especially for harder and relatively rare nonPDAC classes. InFig.5, nnUNet misdetects an AC (malignant) completelybecause the tumor is outside of the pancreas head. OurSMCN model instead detects this AC finding. For anIPMN case (malignant potential), our model provides morecomplete segmentation including the clinically-critical secondary signs of pancreatic duct dilatation, than the 3DnnUNet model [13]. For SCN (benign), SMCN segmentsthe full tumor surface. All demonstrate that our anatomygeometry-aware SMCN network produces superior segmentation results against the state-of-the-art 3D nnUNet[13], being widely used in medical imaging applications.PDAC Segmentation under Different CT Phases. WeACIPMNSCNFigure 5. Examples of pancreas-mass segmentation results. Lightred: pancreas. Green: surgery mass. Blue: monitoring mass. Yellow: discharge mass.(a) PDAC(b) AC(c) CP(d) IPMN(e) SCNFigure 6. Examples of 3D meshes generated from pancreas segmentation under various scenarios. Top: red denotes the head ofpancreas; blue the ventral body; yellow the dorsal body; and greenthe tail. Bottom: light red depicts the pancreas; green the surgerytumor; blue the monitoring tumor; and yellow the discharge tumor.compare our method to three other state-of-the-art methodsof [32], DDT [23], and [27] which are applied to Venousphase. For ease of comparison, we implement/evaluate ourmodels using only one or a few CT phases (in Table 2). TheAL phase outperforms all other individual phases due to itshigher voxel resolution and imaging contrast; the secondbest is Venous phase, widely adopted in clinical settings.The fusion/concatenation of multiple CT phases as the network’s input yields better results than any single phase.The combined five phases yield the best segmentation Dicescore of 0.738, which noticeably improves upon the previous state-of-the-art result of 0.709 [32]. Note that in [32]PDACs are mostly small in size and are only located at thepancreas head. In our dataset, by contrast, PDACs appearin various sizes and span the entire pancreas. The fusion ofall four phases but AL as input yields better results than anysingle phase as well (Dice scores 0.696 vs. 0.562 0.675).613748
Table 1. Segmentation and detection results over the ten types of pancreatic masses. Note that in this experiment, networks are trained withfour labels: background, pancreas, PDAC, and nonPDAC. micro: result for all patients; macro: average of the metrics of the ten classes.nnUNet[13]SMCN(Ours)MetricAverage DiceDetection rateAverage DiceDetection 0.887AC0.4230.70.4380.8CP0.5330.7780.6680.889Table 2. PDAC segmentation under different CT phases: noncontrust (N), arterial (A), arterial-early (AE), arterial-late (AL),venous (V), and delay (D).MethodsCT PhasesAverage DiceReported from their original papersZhang et al. [32]N A V0.709V0.634DDT [23]Xia et al. [27]A rsN AE V D0.696OursN AE AL V D0.7384.2. 3D Anatomy Mesh Quality EvaluationQualitative results of our generated mesh model areshown in Fig. 6. Our method can effectively and accuratelymodel the diseased pancreases under various scenarios, e.g.,PDAC at the neck (Fig. 6(a)), AC at the head with pancreaticduct dilatation (Fig. 6(b)), pseudocyst at the tail (Fig. 6(c)),IPMN on the full pancreatic duct (Fig. 6(d)) and large tumor and parenchymal atrophy (Fig. 6(e)). As described inSec. 3.2, our 3D mask-to-mesh algorithm can automaticallydivide the pancreas into four parts: head, ventral body, dorsal body and tail, which are color-coded as red, blue, yellow and green. The distributions of anatomic locations of10-class pancreatic masses in our dataset are described inthe supplementary material. AC and DC only appear at thehead; MCN does not appear on the head; CP and IPMNappear mostly on the head; PDAC, PNET and RARE aredistributed over the entire surface of the pancreas. Cysticmasses (SPT, SCN and MCN) are distributed over the entire pancreas with the majority being located at the dorsalbody. These observed distributions verify the prior knowledge of different masses’ spatial locations and motivate ourgeometry-aware mass diagnosis framework.From the generated 3D mesh model, we can accuratelymeasure the shape and location of the mass against the pancreas, as shown in Fig.4, at a human-readable level (156is a suitable number for the clinical expert’s perception).Our proposed mask-to-mesh algorithm and SMCN modelscan be generalized to other important organs with specificanatomical structures (like liver), which can potentially improve the underlying imaging-based mass able 3. Average values of PDAC vs. nonPDAC across 3 folds.PV: pixel voting; VV: vertices voting; GC: global classification.MethodsRadiomics [21]DeepTexture [28]ResNet3D [9]SMCN w PVSMCN w VVSMCN w GCExpert radiologistsAccuracy0.8570.7700.7200
causing a significant change in the shape of the pancreas. Most pancreatic cancers lead to dilatation of the pancreatic duct, with IPMN in particular abruptly modifying its cal-iber. To integrate such prior knowledge/correspondence into the model, (1) we propose a segmentation based detec-tion network which can segment and identify pancreatic