Transcription
VOL. 10, NO 19, OCTOBER, 2015ISSN 1819-6608ARPN Journal of Engineering and Applied Sciences 2006-2015 Asian Research Publishing Network (ARPN). All rights reserved.www.arpnjournals.comPERFORMANCE EVALUATION OF VOICE OVER IP USING MULTIPLEAUDIO CODEC SCHEMESL. Audah1, A. A. M. Kamal1, J. Abdullah1, S. A. Hamzah1 and M. A. A. Razak21OpticalCommunication and Network Research Group, Faculty of Electrical and Electronic Engineering, Universiti Tun Hussein OnnMalaysia, Parit Raja, Batu Pahat, Johor, Malaysia2Faculty of Electrical Engineering, Universiti Teknologi Malaysia, Johor Bahru, MalaysiaE-Mail: shipun@uthm.edu.myABSTRACTThe evolution of Voice over IP (VoIP) has made it one of the most popular applications over the wired/wirelessInternet system due to its flexibility in technology integration and low cost of services. Telco and service operators haveused the communication resources to optimize the VoIP architecture in order to provide better quality of service (QoS) toend consumers. The VoIP is a delay-sensitive traffic which requires minimum delay for general applications and minimumloss ratio for specific applications as the key QoS performance parameters. This paper compares the end-to-end (e2e) QoSperformance parameters of VoIP codec schemes against multiple traffic connections transmitted over the Internet system.Background traffics are included in the simulations to closely match the real-world Internet scenario. Simulations analysisof bidirectional VoIP communications are done from the network layer perspective to compare the QoS performances ofG.711, G.729A, G.723.1 and GSM.AMR codec schemes against the incremental of active connections in the networksystem. The results show that the G.729A produces at least 2.81% better in term of average accumulative e2e delay. TheG.711 produces at least 21.89% better in term of average accumulative e2e jitter but produces the worst e2e packet lossratio. In addition, GSM.AMR shows the best e2e effective transmission rate ratio ranges between 42.67% and 89.82%.This study has investigated the QoS performance variations of VoIP codecs so that the results could be used as guidelinesto estimate the optimal network resources for various traffic requirements as early as in the design stage. As for futureworks, this study suggests the adaptive priority queue and packet scheduling at Internet getaway to regulate the trafficbased on per flow QoS requirements.Keywords: VoIP, audio codecs, QoS, internet, simulation, NS-2.INTRODUCTIONVoice over IP (VoIP) applications has been verypopular among the millions of Internet users for audiocommunications. The packet based framework of VoIPand low cost of packet data usage have made it the mostpreferable choice of future Internet communications toreplace the conventional circuit switch telephone network.The flexibility of VoIP application to be implemented assoftware/hardware based and the ability to connectmultiple devices simultaneously through wired/wirelesschannels have become one of the hot topics in the realm ofInternet of Things (IoT). Big players from the telcooperators and service providers have participated in thebillion dollars market opportunities of VoIP applicationsfor future smart-home and smart-cities.In order to optimize the VoIP applications infuture communications, various research works have beendone from the physical to application layers. Previousresearch paper by (El-brak et al., 2011) has compared theVoIP performance over small mobile as-hoc network(MANET) using a pair of source and destination nodes.Besides that, (Ashouri et al., 2014) has analyzed theperformance of VoIP using different encryption methodsover a local wireless network. Moreover, (Kim et al.,2014) has studied the performance of VoIP QoS over longterm evolution (LTE) system from the user perspective byvarying the speed, distance and number of mobile nodes.In addition, research by (Cocker et al., 2014) has analyzedfrom the transport layer perspective for the bufferrequirements over time and path taken by VoIP trafficover the Internet system. None of the related research hascompared the QoS performance of VoIP codec schemesfrom the network layer perspective and its robustnessagainst various competing traffics.This paper analyzes and compares the e2e QoSperformance parameters of bidirectional VoIP (i.e. delay,jitter, loss ratio and throughput) using different types ofaudio codecs mainly used for VoIP applications (i.e.G.711, G.729A, G.723.1 and GSM.AMR). Simulationsanalyses have been done from the network layerperspective using multiple connections of VoIP andbackground traffics to closely match the real-worldInternet system scenario. The simulation results provideinsight on the performance comparison of each VoIPcodec used for audio communication over the Internetsystem. The remainder of this paper is organized asfollows: Section II explains the NS-2 simulationconfiguration. The results and analysis are discussed onSection III. Finally, Section IV concludes the findings andsuggests future research works.8912
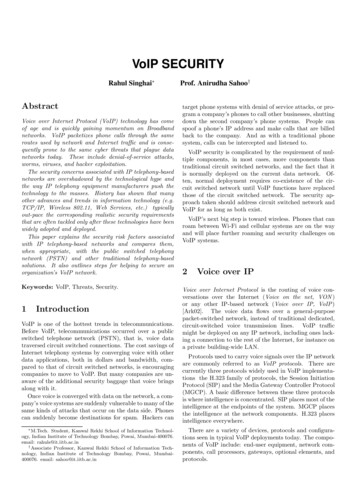
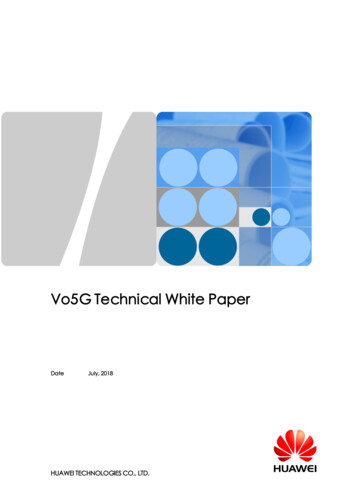
VOL. 10, NO 19, OCTOBER, 2015ISSN 1819-6608ARPN Journal of Engineering and Applied Sciences 2006-2015 Asian Research Publishing Network (ARPN). All rights reserved.www.arpnjournals.comSIMULATION SETUPThe simulation setup characterizes a simpleubiquitous e2e Internet system as depicted in Figure-1.The network simulations are done using NS-2.34 andAWK programming tools. The next subsections explainthe details of network elements parameters involved in thesimulations.Network configurationThe NS-2 network configurations consist of 2VoIP remote LANs and 2 background traffics remoteLANsFigure-1. NS-2 network simulation scenario.connected via the Internet. Each remote LAN is connectedto the Internet getaway router via 1 Mbit/s full-duplex linkwith 5 ms of link delay. The Internet network cloud isrepresented with a 512 kbit/s full-duplex link and also 5ms of link delay. Each link interface contains a simpleDroptail queue with a 50 packet buffer size.The link bandwidths are set to such small scalevalues to represent a much larger broadband networksystem because of the computer hardware/software andNS-2 simulations time limitations. The network systemdesign does not include the bit-error-rate (BER) for linkerror model because it is assumed that the BER for wiredbroadband network is very low and could be neglected.APPLICATION MODELLINGThere are 2 types of application services used inthe NS-2 simulations which are the bidirectional VoIPwith multiple codec schemes and also the backgroundtraffic. Multiple connections are generated from eachtraffic type during 500 s of a simulation time. Thesimulations are done separately for 4 different VoIP codecwhich are the GSM.AMR, G.711, G.723.1 and G.729A.Simulations for each VoIP codec are done for 10 timeswith incremental of VoIP and background trafficconnections. The VoIP connections are increased by 50between 50 and 500 connections while the backgroundtraffic increased by 5 between 5 and 50 connections forthe simulations of each VoIP codec type. Details of VoIPand background traffic configurations will be explained inthe next subsections.Bidirectional VoIPThe bidirectional VoIP application system modelas in (Bacioccola et al., 2007) and (Andreozzi et al., 2010)is used for the simulations in NS-2. Standard codec typelike GSM.AMR (Sjoberg et al., 2007), G.711 (ITU-TG.711, 1988), G.723.1 (ITU-T G.723.1, 2006) andG.729A (ITU-T G.729, 2012) are used at the source sideto encode the Voice Activity Detection (VAD) (e.g.talkspurt and silence events) into a few chunk of bytesbefore sending the data over the Internet network usingUDP transport protocol (Schulzrinne and Casner, 2003).The talkspurt and silence events between thecommunicating VoIP clients are not independent andmodelled using modified Brady’s model.The bidirectional audio streams between callerand lister can be in in any of four states which are singletalk, double talk, short silence and mutual silence(Bacioccola et al., 2007) and (Andreozzi et al., 2010).Table-1 shows the codec’s sample size and bitrate used in the simulations as suggested in (Schulzrinneand Casner, 2003). The VoIP sample size data areexcluding the IP/UDP/RTP headers size whichapproximately 40 bytes. At the receiver side, thetransmitted audio packets are demultiplexed and insertedinto a H.323 playout buffer to ensure that the packets aredecoded at the same interval at which they are generatedby the encoder. The H.323 protocol provides real-timeaudio communications on point-to-point, multipoint orbroadcast network configurations (ITU-T H.323, 2009).Background trafficMultiple connections of the background trafficare used in the NS-2 simulations to represent the othertypes of Internet applications that shared the networkresources with VoIP application. The background traffic ismodelled as in (Harfoush, 2000) by using a Pareto On/OffUDP source. The Pareto shape parameter (α) is set to 1.2.The traffic is generated using constant packet size of 200bytes with 2 s of burst time and 1 s of idle time. Thepackets are transmitted at 3.6 kbit/s bit rate.RESULTS AND ANALYSISEach NS-2 simulation is carried out for theduration of 500 s. The simulations are done 10 times (i.e.10 average values of new VoIP connection inter-arrivaltime) for each VoIP codec. The simulations results andanalysis are divided into 4 QoS categories which are theaverage e2e delay, jitter, packet loss ratio and throughput.The QoS parameters are calculated based on eachsimulation output trace file using AWK programming8913
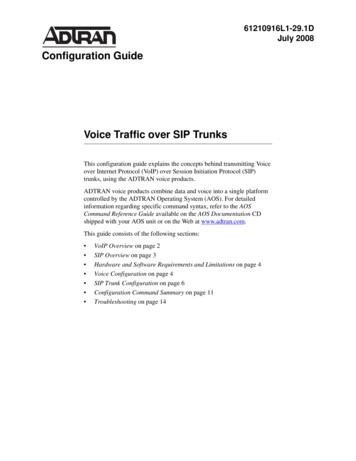
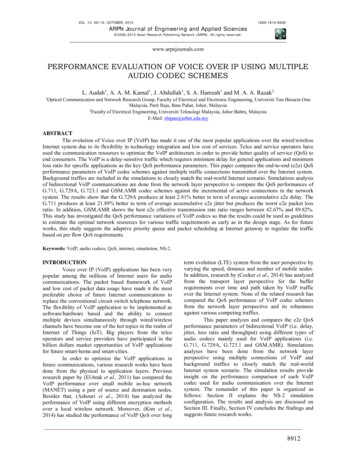
VOL. 10, NO 19, OCTOBER, 2015ISSN 1819-6608ARPN Journal of Engineering and Applied Sciences 2006-2015 Asian Research Publishing Network (ARPN). All rights reserved.www.arpnjournals.comscript and then presented in the form of graphs as shown inthe next sub-sections.Average end-to-end delayAverage e2e delay is the common QoS parameterused to describe the level of service interactivity andsmooth playback. The estimated e2e delay (one-way) for aVoIP connection could be estimated using equation (1).parameter) during the simulation time as shown inequation (3).Dt Dp Dq DnFigure-2 shows the average end-to end delayagainst average number of established VoIP connectionsin a simulation. The lower the delay the better would bethe transmitted voice quality across the network system.The delays are proportional to the increment of averageVoIP connections. The more new connections establishedbetween caller and receiver, the higher would be the delayfor each type of VoIP codec. The average delays for allVoIP codecs except G.711 remain below 25 ms if theaverage generated VoIP connections within the networksystem are between 50 and 150. After that, the delaysincreased and reach the maximum for approximately 121ms. In contrast, the maximum delay for G.711 VoIP codecis 244 ms.The average accumulative delays for GSM.AMR,G.723.1, G.711 and G.729A codecs are 81.92 ms, 69.16ms, 196.7 ms and 67.22 ms respectively as shown inFigure-3. All VoIP codecs satisfy the InternationalTelecommunication Union (ITU) delay recommendationto be less than 150 ms for best audio reception qualityexcept G.711 codec (Demichelis and Chimento, 2002).One of the main reasons is that the sample size for G.711is 80 bytes excluding the 40 bytes of IP/UDP/RTPheaders.This codec sample size is approximately 2.5times more than the others. The other reason is that theG.711 codec utilizes A-law/µ-law companding algorithmwith low compression rate which eventually accommodatelarger link bandwidth fraction compared to the othercodecs.(1)where Dt is the one way packet delay from VoIPcaller to receiver, Dp is the one way propagation time, Dqis the queuing delay and Dn is the additional delay due totraffic and other network factors.Table-1. VoIP codec sample size and bit rate.Codec TypeSample Size(Bytes)Bit Rate (kbit/s)GSM.AMR324.75 – 12.2;Toll quality speech 7.4G.723.1246.3G.7118064G.729A208The one way propagation delay (Dp) could beestimated by summing up all links delays from caller toreceiver. Based on the simulation scenario in Figure 1, theone way propagation delay from caller to receiver is 15 ms(i.e delay from caller to Internet getaway propagationdelay within the Internet network cloud delay from theinternet getaway to receiver). The queuing delay in thiscase mainly occurs at the Internet getaway which iscalculated using equation (2).Dq N P 8Bli nD (D )t ii 1(3)n(2)Average Delay vs Average VoIP Connectionswhere N is the current total number of packets in queuebuffer, P parameter refers to the packet size in bytes whileBl is the link bandwidth measured in bit per second (bit/s).Dq parameter for each of the Internet getaway is 1.56NP x10-5 second depending on codec types for N and Pparameters if we includes the Internet link bandwidth of512 kbit/s. In addition, the Dn parameter is the delay due tothe packet transmission time and also the networkdynamic factors like congestion and link failure.The average e2e delays for all VoIP connectionsin a simulation, D is then calculated by summing up all ofthe one way connection delay and then divides with thetotal number of established VoIP connections (i.e. nAverage Delay erage VoIP ConnectionsGSM.AMRG.723.1G.711G.729AFigure-2. Average e2e delay.8914
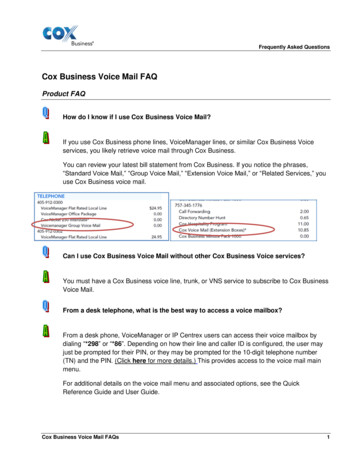
VOL. 10, NO 19, OCTOBER, 2015ISSN 1819-6608ARPN Journal of Engineering and Applied Sciences 2006-2015 Asian Research Publishing Network (ARPN). All rights reserved.www.arpnjournals.comAverage end-to-end jitterJitter is the e2e one way delay variation betweenpackets transmitted from caller to receiver by ignoring anylost packets (Szigeti and Hattingh, 2014). Jitter causes thepackets to arrive at different timing and possibly indifferent order. At certain level, jitter may cause audioanomalies like stuttering, uneven audio and abnormalspeech rhythm. Equation (4) is the general equation usedto calculate jitter per connection.J (i 1) J (i ) R (i 1) S (i 1) R (i ) S (i ) (4)whereS(i) – Time at which packet ‘i’ is transmitted from thecaller.R(i) – Time at which packet ‘i’ is received at the receiver.The average e2e jitter for all VoIP connections ina simulation, J is then calculated by summing up all of theone way connection jitter and then divide with the totalnumber of established VoIP connections (i.e. n parameter)during the simulation time as shown in equation (5).i nJ ( J ( x))i 1i(5)nThere are no specific VoIP jitter limitationspecified by the ITU but it is strongly advisable to be lessthan 30 ms for one way e2e average jitter when designingthe VoIP communications over LAN, WAN and VPNsystems (ITU-T G.114, 2003). In the simulations results asin Figure-4, the networks becomes congested andsaturated with many competing VoIP and backgroundtraffics after 300 VoIP connections. The decrement ofjitter values for G.711 codec after 300 connections isbecause too many packets have been dropped in congestedlinks as the network moves towards saturation point andthe jitter counted in the simulations ignored the losspackets. In addition, larger packet size as in G.711 codecshas severely affected by network dynamics compare tosmaller packets size like in the other codec types.Although playout buffer is used in this VoIP system todampen the jitter and rearrange the out order packets butthe severity of congestion at the bottleneck link hasdegraded the jitter performance.Average end-to-end packet loss ratioThe average e2e packet loss ratio over theInternet system is another important QoS performanceparameters for VoIP. Packet loss ratio is the ratio of totalpacket loss over total packet sent from caller to receiver.The packet loss ratio for a VoIP connection in a simulationis measured as in equation (6).j yAverage Accumulative Delay for VoIP CodecsL (i ) Average Delay (ms)250196.70200 (P )j 1lj(6)k z (P )k 1s where Pl is the total packets loss and Ps is the totalsending packets from the caller during a VoIP connectionsession. By considering all generated VoIP connections(n) in a simulation run time, the average e2e packet lossratio is calculated as in equation (7).Types of VoIP CodecsThe average jitters shown in Figure-4 are steadilyincreased between 50 and 250 VoIP connections for allcodec types. After that the values maintain between 4.0 msand 5.3 ms except for G.711 which decrease and maintainbetween 2.2 ms and 2.3 ms after 300 VoIP connections.Besides that, the average accumulative jitter forGSM.AMR, G.723.1, G.711 and G.729A codecs are 3.86ms, 3.93 ms, 2.89 ms and 3.70 ms respectively as shownin Figure-5.Average Jitter vs Average VoIP Connections6Average Jitter (ms)Figure-3. Average accumulative e2e delay of VoIPcodecs.54321050100150200250300350400450Average VoIP ConnectionsGSM.AMRG.723.1G.711G.729AFigure-4. Average e2e jitter.8915500
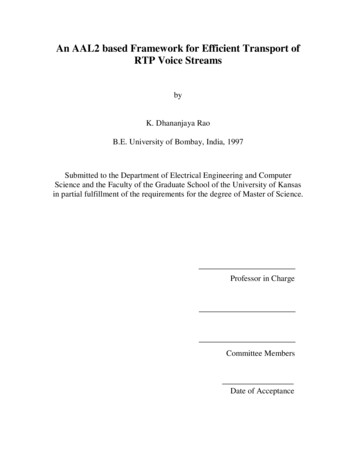
VOL. 10, NO 19, OCTOBER, 2015ISSN 1819-6608ARPN Journal of Engineering and Applied Sciences 2006-2015 Asian Research Publishing Network (ARPN). All rights reserved.www.arpnjournals.com3.863.93Average Packet Loss vs Average VoIPConnections3.70Average Packet Loss (%)Average Jitter (ms)Average Accumulative Jitter for VoIP Average VoIP ConnectionsG.729ATypes of VoIP CodecsGSM.AMRFigure-5. Average accumulative e2e jitter of VoIP codecs.i nL L (i )i 1n(7)Figure-6 shows the average e2e packet loss ratioagainst average VoIP connections generation in asimulation run time for all codec types. The average e2epacket loss ratio is proportional to the increment ofaverage generated VoIP connections in the networksystem. The lower the loss ratio the better would be thetransmitted audio quality. The average e2e packet lossratio for all codec types except G.711 and G.723.1 remainalmost constant below 1.2 % for average connectionbetween 50 and 150 depending on the codec types.Only the G.723.1 codec successfully maintainspacket loss ratio below 1% until 250 connections while theG.711 suffers packet losses between 1% and 64.7%. Afterthat, all codecs shows rapid increment of packet lossbetween 250 and 450 connections and then remains almostconstant between 48.4% and 79.0%. In addition, theaverage accumulative packet loss ratio as shown in Figure7 for GSM.AMR, G.723.1, G.711 and G.729A are27.48%, 20.76%, 56.21% and 23.15% respectively.The packet loss occurs when the queue buffer onnetwork link becomes overflow as the results of networkcongestion. The packet loss event is not a critical factor forthe delay-sensitive traffic like VoIP compared to thethroughput-sensitive traffic. However, in order to transmithigh quality audio over the network system it is necessaryto keep the losses at minimum. The ITU does notspecifically mention the standard of maximum packet lossfor VoIP. However, the ITU has suggested that the lossratio should be less than 1% for a VoIP connection inorder to achieve the best audio quality (ITU-T G.114,2003). If the loss ratio is much higher, the VoIPconnections may experience audio anomaly like echo,stuttering and etc. The G.723.1 could achieve that goal foraverage connections below 250 while the others exceptG.711 only below 150. The G.711 codec transmissionmust maintain below 50 connections in order to achievebest audio quality.G.723.1G.711G.729AFigure-6. Average e2e packet loss ratio.Apart from the network dynamic conditions,packet loss occurs because of the VoIP codec uniquecharacteristics. The good performance of G.723.1 in thisnetwork simulation scenario is also due to high packetcompression ratio, low transmission bit rate and lossycommanding algorithm utilization. In contrast, the lowperformance of G.711 codec might be due to its built inframework design which utilizes the A-law/µ-lawcommanding algorithm in order to deliver precise speechtransmission. The codec also produce higher bit ratecompare to the others which is about 64 kbit/s. However,the codec is more sensitive towards packet losses due topoor packet loss interpolation.Average end-to-end throughputThe e2e throughput concludes the previous QoSperformance parameters as it measures the rate ofsuccessfully received packets at the receiver. Thethroughput might not be as critical as the delay and jitterQoS parameters for the delay sensitive traffic like VoIPbut it may provide references in designing the e2e networksystem with QoS to accommodate high quality voicetraffics.The average e2e throughput in bit/s for all VoIPconnections (n) in a simulation is calculated usingequation (8). Pb 8 i 1 r t c ii nT t(8)n8916
VOL. 10, NO 19, OCTOBER, 2015ISSN 1819-6608ARPN Journal of Engineering and Applied Sciences 2006-2015 Asian Research Publishing Network (ARPN). All rights 1520.762050 and 300 connections not only due to the delay andpacket loss effects but also due to the codec’s uniquespecification with larger codec sample size, short intervaltime between packets and also lossless data compressionmethod utilization. Simulations results have shown thatthose characteristics severely degrade the G.711 codecperformances in certain high density network trafficsystem.100G.723.1G.711Average Throughput vs AverageVoIP ConnectionsG.729ATypes of VoIP CodecsFigure-7. Average accumulative e2e packet loss ratio ofVoIP codecs.where Pb is the total received packets at the receiver inbytes, tr is the packet received time and tc is the packetsending time from the caller for a VoIP connection.Figure-8 shows the average e2e throughput foraverage VoIP connections between 50 and 500. Thethroughput values for all VoIP codecs except G.711remain almost constant between 3.6 kbit/s and 6.6 kbit/sfor average connections between 50 and 250 depending oncodec types. After that, the throughputs slightly decreaseand then remain almost constant again between 2.0 kbit/sand 3.68 kbit/s for average VoIP connections between 400and 500. In contrast, the G.711 codec shows rapiddecrement from 28.0 kbit/s to 7.5 kbit/s between 50 and300 average connections and then remain almost constantbetween 6.0 kbit/s and 6.97 kbit/s. In addition, the averageaccumulative throughput as in Figure-9 for GSM.AMR,G.723.1, G.711 and G.729A codec types are 5.13 kbit/s,2.97 kbit/s, 12.52 kbit/s and 4.34 kbit/s respectively. TheG.711 codec achieved the highest average throughputs forall VoIP connections while the G.723.1 codec achievedthe lowest compare to the others.The average e2e throughput patterns are inverselyproportional to the increment of average VoIPconnections. There are 2 main factors that affecting thethroughput which are the delay and packet losses. Thedelay and packet loss results for all codec types exceptG.711 have shown significant increment after 200 averageVoIP connections generated within the network during asimulation time. Consequently, the throughputs showsignificant decrement and then remain almost constantuntil 500 connections depending on the codec types. Sincethe new VoIP connections are continuously generatedwithout waiting for the previous connections to becompleted, more VoIP connections will compete with thebackground traffic to access the network in best-effortmanner. At certain point of time, the network becomescongested and then the packets need to queue for networkaccess which eventually increases the delay. When thebuffer is full, the packets start to be dropped and reducethe number of successful received packets. As for theG.711 codec, the rapid decrements of throughput betweenAverage Throughput 450500Average VoIP ConnectionsGSM.AMRG.723.1G.711G.729AFigure-8. Average e2e throughput.Average Accumulative Throughput forVoIP CodecsAverage Throughput (kbit/s)Average Packet Loss (%)Average Accumulative Packet Loss forVoIP 711G.729ATypes of VoIP CodecsFigure-9. Average accumulative e2e throughput ofVoIP codecs.Table-2. VoIP codec effective transmission rate ratio.Codec typeEffective transmission rate ratioMin (%)Max 9G.729A38.7268.10This paper also estimates the effectivetransmission rate as the ratio of measured throughput oversource bit rate in term of percentage. Table-2 shows therange of minimum and maximum effective transmissionrate ratios for all codec types. The minimum and8917
VOL. 10, NO 19, OCTOBER, 2015ISSN 1819-6608ARPN Journal of Engineering and Applied Sciences 2006-2015 Asian Research Publishing Network (ARPN). All rights reserved.www.arpnjournals.commaximum throughput data are collected from the NS-2simulations and then compare against the codec source bitrate. The highest range of values is achieved byGSM.AMR codec which are between 46.72% and 89.82%while the lowest is G.711 codec which are between 9.43%and 43.79%. The effective transmission rate does notdictate that certain VoIP codec are the best or the worstbut rather provides information to decide on whichapplication does the codec can be used optimally (e.g.wired or wireless network, high or low audio quality,broadband or narrowband applications, etc.).CONCLUSION AND FUTURE WORKThe simulations study shows the e2e QoSperformances for 4 different VoIP codec types transmittedover the best effort network system. The network scenariois designed with the standard parameters without specificQoS improvement modifications in order to closely matchthe real-world VoIP applications (i.e. multiple VoIP andbackground traffic connections are transmitted over thenetwork system to produce more realistic servicesbehaviors.Firstly, the study shows that the G.729A producesthe best performance in term of lower averageaccumulative e2e delays while the G.711 codec shows theopposite. All codec types except G.711 produce delaysbelow 150 ms for all generated VoIP connections asrecommended by the ITU for high quality audiocommunications. The G.711 mouth-to-ear delays arewithin the acceptable range and below the upper bound of400 ms for general network planning. Secondly, the studyshows that the G.723.1 produce the least jitter at loweraverage e2e VoIP connections and the highest jitter after250 generated VoIP connections while the G.711 showsthe opposite. The jitters for all codec types are below therecommended 30 ms of acceptable audio quality. Thirdly,the e2e loss ratios for all codec types except G.711 are lessthan 1% for average VoIP connections below 150. TheG.723.1 codec shows the lowest of overall losses while theG.711 shows the highest after 50 average connections. Forhigh quality audio quality transmission, it is recommendedto keep the packet loss ratio to be below than 1%.Fourthly, the G.711 codec shows the highest e2ethroughput while the G.723.1 shows the opposite. TheG.711 is mostly affected by the increment of VoIPconnections while others show slow variation. This mightbe due to the differentiation of codec’s source bit ratecharacteristic. In term of average throughput over bit rateratio, the GSM.AMR shows the highest performancewhich is between 46.72% and 89.82% of minimum andmaximum values respectively. Fifthly, the overall QoSperformances of G.729A in term of average e2e delay,jitter and loss ratio are better than the GSM.AMR in mostcases of network dynamics.This paper does not dictate the best VoIP codecfor all types of applications but rather to provide aguideline for future researchers to design better QoSperformances of VoIP system application. The futureworks aims at designing a QoS aware routing, schedulingand queuing schemes for Next Generation Internet (NGI)network system that can adaptively maintains each traffictype QoS requirements at optimum level. In addition, theVoIP protocols could also be enhanced with adaptivecoding and modulation to suite with the network dynamiccharacteristics.ACKNOWLEDGEMENTThe authors would like to thank the Ministry ofEducation Malaysia for the generous financial supportunder Research Acculturation Grant Scheme (R054).REFERENCESAndreozzi, M. M., Migliorini, D., Stea, G. and Vallati, C.2010. Ns2Voip , an adhanced module for VoIPsimulations. Proceedings of 3rd International ICSTConference on Simulation Tools and Technique,SIMUTools ’10, Malaga, Spain, article no. 50.Ashouri, S., Khosraviroshkhari, H., Seno, S. A. H andMoghaddam, M. H. Y. 2014. VoIP performancecomparison in wireless networks with different encryptionmethods. Proceedings of the 4th International Conferenceon Computer and Knowledge Engineering (ICCKE 2014),Mashhad, Iran, pp. 753-757.Bacioccola, A., Cicconetti, C. and Stea, G. 2007. Userlevel performance evaluation of VoIP using ns-2.Proceedings of 2nd Performance Evaluation Methodologiesand Tools, ValueTools ‘07, Nantes, France, article no. 20.Cocker, E., Ghazzi, F., Speidel, U., Dong, M. C., Wong,V., Vink, A. J. H., Yamamoto, H., Yokoo, H., Morita, H.,Ferreira, H., Emleh, A., McFadzein, R., Palelei, S. andEimann, R. (2014). Measurement of buffer requirementtrends for real time traffic over TCP. Proceedings of the15th IEEE International Conference on High PerformanceSwitching and Routing (HPSR 2014), Vancouver. Canada,pp. 120-124.Demichelis, C. and Chimento, P. 2002. IP packet delayvariation metric for IP performance metrices (IPPM). RFC3393.El-brak, S., Bouhorma, M., and. Boudhir, A.A. 2011.VoIP over MANET (VoMAN): QoS & performanceanalysis of routing protocols for different audio codecs.International Journal of Computer Applications, 36(12),pp. 22-26.8918
VOL. 10, NO 19, OCTOBER, 2015ISSN 1819-6608ARPN Journal of Engineering and Applied Sciences 2006-2015 Asian Research Publishing Network (ARPN). All rights reserved.www.arpnjournals.comHarfoush, K., Bestavros, A. and Byers, J. 2000. Robustidentification of shared losses using end-to-end unicastprobe. Proceedings of the 8th IEEE InternationalConference on Network Protocols, ICNP 2000, Osaka,Japan, pp. 22-3
smooth playback. The estimated e2e delay (one-way) for a VoIP connection could be estimated using equation (1). Dt Dp Dq Dn (1) where Dt is the one way packet delay from VoIP caller to receiver, Dp is the one way propagation time, Dq is the queuing delay and Dn is the additional delay due to traffic and other network factors. Table-1.