Transcription
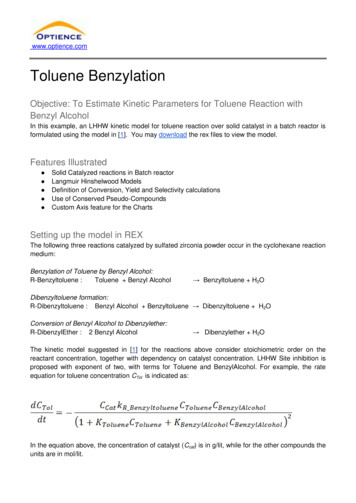
www.optience.comToluene BenzylationObjective: To Estimate Kinetic Parameters for Toluene Reaction withBenzyl AlcoholIn this example, an LHHW kinetic model for toluene reaction over solid catalyst in a batch reactor isformulated using the model in [1]. You may download the rex files to view the model.Features Illustrated Solid Catalyzed reactions in Batch reactorLangmuir Hinshelwood ModelsDefinition of Conversion, Yield and Selectivity calculationsUse of Conserved Pseudo-CompoundsCustom Axis feature for the ChartsSetting up the model in REXThe following three reactions catalyzed by sulfated zirconia powder occur in the cyclohexane reactionmedium:Benzylation of Toluene by Benzyl Alcohol:R-Benzyltoluene :Toluene Benzyl Alcohol Benzyltoluene H2ODibenzyltoluene formation:R-Dibenzyltoluene : Benzyl Alcohol Benzyltoluene Dibenzyltoluene H2OConversion of Benzyl Alcohol to Dibenzylether:R-DibenzylEther : 2 Benzyl Alcohol Dibenzylether H2OThe kinetic model suggested in [1] for the reactions above consider stoichiometric order on thereactant concentration, together with dependency on catalyst concentration. LHHW Site inhibition isproposed with exponent of two, with terms for Toluene and BenzylAlcohol. For example, the rateequation for toluene concentration CTol is indicated as:In the equation above, the concentration of catalyst (Ccat) is in g/lit, while for the other compounds theunits are in mol/lit.
In REX, we can implement the catalyst mass dependency on the reaction rate in the batch reactor intwo ways: Considering the Catalyst as a compoundIn the Compounds node, we could load the catalyst as a compound and define the orders forit in the Parameters node. The Rate Basis should be selected as Volume in theKinetics Units Configuration node, thus the rate units will be, for example in [mol/(min-lit)]. Inthe Experiments Sets node, the values loaded for the catalyst will be in mass units, eventhough the header states that the values should be provided in moles. In all other nodeswhere catalyst is shown, for example, the Results Model Data Comparison node, the unitswill be stated as moles even though it is actually in mass units. Selecting Catalyst Mass as the Rate Basis in the Units Configuration nodeBy selecting this option, we remove the need to enter the catalyst as a compound. Catalystconcentration is removed from the rate expression and the Rate units will be, for example, in[mol/(min-gcat)], where gcat refers to the catalyst mass in grams. In Experiments Sets, theexperimental values for Catalyst Mass can be entered in a straightforward manner.In this example, we choose the most direct implementation: using Catalyst Mass as rate basis. Forthat option, the mass balance for total moles of toluene NTol is given by:where, vTol,r are stoichiometric coefficients of toluene in each reaction r, and Rr are the rates for the rreactions per gram of catalyst mass. The equation above is equivalent to the previous mass balancefrom [1] after multiplying by reactor volume: NTol V CTol represents the toluene total moles and WCat V CCat is the catalyst mass.You may import the Toluene-Benzylation-1.rex file and see the reactions entered, units selected,LHHW site definition and other related issues. For a more detailed description on how to setup LHHWkinetics, you may follow guidelines from other Examples, such as Glucose-to-F6P, or consult theREX help manual.Strategic Solutions through Optimization Science
Experimental DataExperimental conditions correspond to a single liquid batch reactor as entered in the Reactor node.Temperature and reactor volume are specified as Interpolated from Data. There are no inflows oroutflows.Measurements at 45C are reported below from [1]:Strategic Solutions through Optimization Science
In the table above, CM refers to Benzyltoluene concentration and CD to DibenzylTolueneconcentration.Values provided for the compounds are all molar concentrations; we assume the reaction volume tobe 1 lit. Of the two reactants, Toluene is in excess, so the limiting reactant is Benzyl alcohol.Cyclohexane is the solvent. The amount of cyclohexane is not reported in [1]. However, we do notreally need this information. We specify the reactor volume to be 1 lit and use the concentrationsprovided above to enter the experimental mole values into REX as shown below. As the catalystconcentration is reported to be 10 g/lit, we enter the catalyst mass in REX as 10 g.We show below the data loaded for the experimental set above. We entered all data, including thosefor time higher than 270 min that are not used in [1] for the parameter estimation:Measurements at 300 and 330 min are not to be considered for reconciliation in accordance with [1].Thus, we have them un-included above.Parameter EstimationIn the Estimation Parameters node, the pre-exponential factor bounds are open for both the MassAction and LHHW site. Activation energies are kept fixed to zero since tabular data is only availableat one temperature (45 C). In the Weights node, we select the measured compounds: Benzyl Alcohol,Benzyl Toluene, Dibenzyl ether and Dibenzyl Toluene. Hybrid weights are generated for them, unlikethe uniform weights used in [1].After running the Estimation, you may see the solution parameters in the Results Parameters node:Strategic Solutions through Optimization Science
The profiles of the experimental and calculated profiles can be seen in the Model Data Comparisonnode:While the predictions are reasonably close to measurements, the kinetic parameters in this examplediffer somewhat from those in [1] because we used only one experiment for which the tabular valueswere provided. Furthermore, some parameters were fixed in [1] and uniform weights were used intheir work. This model can of course be easily expanded to consider additional data sets if numericStrategic Solutions through Optimization Science
measurement values are available.The carbon traffic for the reaction network may be visualized by selecting the ReactionTraffic Options node:The carbon moles traffic option can be enabled above because the carbon content of compoundswas previously loaded in the Chemistry Compounds Formula node. The arrow widths in thegenerated network show the relative amount of carbon traveling in those paths:Strategic Solutions through Optimization Science
Conversion, Yield and Selectivity DefinitionYou may easily define and display additional variables such as Conversion, Yield and Selectivity.This extra information does not affect the simulation or parameter estimation. We now show how toenable these calculations.In the Estimation Yield Calculations node, you may define the conversion of desired compounds:Strategic Solutions through Optimization Science
You may import the Toluene-Benzylation-2.rex file that has the conversion selected as above. Afterrerunning the project, the conversion values are reported in the Results Yield Conversions node:The line shows the conversion predicted by the model, while experimental conversion values areindicated by triangles. For toluene, the experimental conversion is reported as 100% for the non-initialdata points. This is because in the Experiments Sets node, there are no toluene values (zerosloaded) except for the initial point, resulting in an incorrect calculation of 100% experimentalconversion.In the chart above, it may seem that toluene conversion calculated from the model is always zero.That is not actually the case. As toluene is in excess, its calculated conversion is very small. Thesmall values can be seen in the Values tab of Results Yield Conversion node. You can also see thisin the Charts by enabling Custom Axis, available on right-clicking on the chart:Strategic Solutions through Optimization Science
A grid is then shown in the Select Sets to View tab. There you can change the Min and Max valuesfor the chart axis. For example, if changing the Y axis max to 1, the chart will now be as follows,showing the low toluene conversion values:Selectivity calculations can also be enabled. For example, the selectivity of benzyl toluene withrespect to a basis compound(s) can be enabled as shown in the grid below. Here, Benzyl Alcohol andToluene are both chosen as the basis, and thus the selectivity feature will calculate the moles ofBenzyl Toluene formed divided by the sum of the moles of Benzyl alcohol and Toluene that areconverted, in percentage units(x100).Selectivity of other products can be similarly defined and the values can be seen after running themodel in the Results Yield - Conversion node. By right clicking on this node (or using theicon onthe toolbar), you may enable the Single Set view of variables. This allows you to show more than onevariable for a given set. If we display all selectivities together, we have as shown below:Strategic Solutions through Optimization Science
The Experimental Selectivity values reported are all obtained from the experimental data entered inMeasurements Sets. As we mentioned earlier, values for toluene are not available except for theinitial content, where it is in excess with respect to the other reactant. Thus, the relatively smallexperimental values of benzyltoluene produced when are divided by the (apparently) high amount oftoluene converted, results in a very small experimental selectivity. Therefore, the experimentallycalculated selectivities should be ignored here. Only the calculated values are accurate.The sum of calculated selectivities does not equal 100% because they are based on compoundmoles. A more suitable way to report selectivities would be on a carbon atom basis. Carbon basedselectivity would relate the carbon atoms of a given product with respect to carbon atom lost by thereactants.In order to do that, we first create auxiliary variables in Pseudo-Compounds node that will representthe carbon content of reactants and products. For example, we enter C-Toluene and define it asseven times toluene (C7H8) moles. The pseudocompound is selected as Conserved, so that reportedvalues will correspond to the carbon moles contained in toluene:Similar definitions are are entered for the other compounds, as you can see in Pseudo-ompoundsnode.Strategic Solutions through Optimization Science
Then we go back to Yield-Calculations node and choose the selectivities shown next:We enabled the selectivity of C-Benzyltoluene with respect to C-BenzylAlcohol and C-Toluene. Giventhe definition of those pseudocompounds, the resulting values will represent the selectivity in carbonbasis: carbon moles of Benzyltoluene produced with respect to carbon moles of BenzylAlcohol andToluene consumed.You may notice that after the definition of the new selectivities, a Method for PseudoCompound childnode appears under the Yield Calculations node. This node is used to specify how the experimentalvalues for pseudocompounds are determined when calculating experimental Conversions, Yields orSelectivities.To better understand the options of this node, we have defined the conversion of C-BenzylAlcohol inthe Yield Calculations node. If C-BenzylAlcohol is unselected in the Conversion tab of the Method forPseudoCompounds node, then the reported experimental values for it will be depending on the dataloaded for C-BenzylAlcohol in Experiments Measurements Set node. As they are all zero, theresulting experimental conversion is reported as zero as can be seen in the Results YieldConversion node:If you load other experimental values for C-BenzylAlcohol in Measurements Set node, then afterrerunning the project the experimental values for the conversion will be reported according to the newStrategic Solutions through Optimization Science
experimental values.On the other hand, if you select the Formula checkbox for C-BenzylAlcohol in the conversion tab ofthe Method for Pseudocompounds node, the reported experimental conversion is based on theexperimental values of the compounds involved in the formula that defines the pseudocompound. Inthis case, that means that the experimental values of the BenzylAlcohol compound will be used. Thusyou will see the following chart for C-BenzylAlcohol conversion:You can compare the chart above with the one of BenzylAlcohol conversion and note that they areidentical. This is because the experimental values of C-BenzylAlcohol are internally computed in REXfrom the experimental values of BenzylAlcohol. In all these charts, you can also see that thecalculated values are invariant with respect to the option chosen for the pseudocompound.The above described method for calculating pseudocompound experimental values applies also foryields and selectivities.Coming back to our original goal of calculating carbon based selectivities: we keep the default optionfor them, thus no checkbox is selected for Selectivities in Method for Pseudocompounds node. Thereported experimental selectivity of C Benzyltoluene with respect to C-Toluene and C-BenzylAlcoholis then based on the pseudocompounds values entered in Measurements Sets node. We have allzero values for them; consequently the experimental selectivities for the pseudocompounds areshown as zero.Now, if you display all products selectivity in the chart, you can verify that the sum of the values is100%. This allows you to compare the product formation on a consistent basis:Strategic Solutions through Optimization Science
The above Dibenzyl ether carbon selectivity values imply that close to 80% of all Toluene and BenzylAlcohol carbon that reacts is used to produce Dibenzyl ether.Further StudiesYou may also enable confidence interval calculations in Run Solution Options node to see theuncertainties in the parameters. You can find more information about Pseudo-compound types andabout calculating Conversions, Yields and Selectivities in the REX help. Help is available by pressingF1 key on any REX node.References1. Ardizzone, S.A., Beltrame, P., Zuretti, G., (2006) Kinetics of the Reaction of Toluene with BenzylAlcohol over Sulfated Zirconia. Appl. Catal. A., 314, 240-247.Strategic Solutions through Optimization Science
You may import the Toluene-Benzylation-1.rex file and see the reactions entered, units selected, LHHW site definition and other related issues. For a more detailed description on how to setup LHHW kinetics, you may follow guidelines from other Examples, such as Glucose-to-F6P, or consult the REX help manual.