Transcription
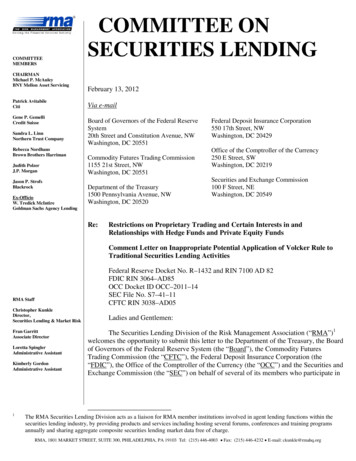
Market Power in Mortgage Lending and the Transmission of Monetary Policy David Scharfsteindscharfstein@hbs.eduHarvard University and NBERAdi Sunderamasunderam@hbs.eduHarvard University and NBERAugust 2016AbstractWe present evidence that high concentration in mortgage lending reduces the sensitivity ofmortgage rates and refinancing activity to mortgage-backed security (MBS) yields. We isolate thedirect effect of concentration in two ways. First, we use a matching procedure to compare highand low-concentration counties that are very similar on observable characteristics and find similarresults. Second, we examine counties where bank mergers increase concentration in mortgagelending. Within a county, sensitivities to MBS yields decrease after a concentration-increasingmerger. Our results suggest that the strength of monetary policy transmission through the mortgagemarket varies in the cross section.* This paper was previously circulated under the title “Concentration in Lending, Refinancing Activity, and MortgageRates.” We are grateful to Zahi Ben-David, Scott Frame, Andreas Fuster, Ed Golding, Laurie Goodman, Erik Hurst,Amir Kermani, David Lucca, Karen Pence, Monika Piazzesi, Amit Seru, Jeremy Stein, Amir Sufi, and seminarparticipants at Berkeley, the Federal Reserve Bank of New York, the Federal Reserve Board, Harvard University, theNBER Corporate Finance Spring Meetings, Ohio State, Stanford, Texas, the UCLA/FRB-San Francisco Conferenceon Housing and the Macroeconomy, and the Urban Institute for helpful comments and suggestions. We thank FreddieMac for data and Toomas Laarits for excellent research assistance. We also thank the Harvard Business SchoolDivision of Research for financial support.
I.IntroductionHousing is a critical channel for the transmission of monetary policy to the real economy.As shown by Bernanke and Gertler (1995), residential investment is the component of GDP thatresponds most strongly and immediately to monetary policy shocks. In addition, housing can bean important channel through which monetary policy affects consumption. An easing of monetarypolicy can reduce mortgage rates, enabling households to refinance their mortgages at lower ratesand reduce their payments. If borrowers have higher marginal propensities to consume thanlenders, as would be the case if borrowers are more liquidity constrained, then refinancing canboost aggregate consumption.Using monetary policy to support housing credit has been a particular focus of the FederalReserve during the Great Recession. The Federal Reserve’s purchases of mortgage-backedsecurities (MBS) in successive rounds of quantitative easing have had the explicit goal ofsupporting the housing market. One of the aims of quantitative easing was to lower mortgage ratesby reducing financing costs for mortgage lenders (Bernanke 2009, 2012). However, thewidespread use of fixed rate mortgages introduces several frictions that may impede thetransmission of these low rates to borrowers. For instance, it has been argued that the efficacy ofmonetary policy may be hampered by the high indebtedness of households with fixed ratemortgages (Campbell, 2012; Calza, Monacelli, and Stracca, 2013). “Underwater” householdswhose mortgage balances exceed the values of their homes have been unable to refinance,potentially reducing the impact of low interest rates on the economy.Others have noted that the reduction in MBS yields from quantitative easing has only beenpartially passed through to borrowers, leading to historically high values of the so-called “primarysecondary spread” – the spread between mortgage rates and MBS yields (Dudley, 2012). Fuster,et al. (2012) consider a number of explanations for the increase in spreads, including greater costsof originating mortgages, capacity constraints, and market concentration, but ultimately do notidentify a single factor as driving the increase.In this paper, we explore in more detail whether market power in mortgage lending canimpede the transmission of monetary policy to the housing sector. We build on the literaturearguing that cost “pass-through” is lower in concentrated markets than in competitive markets –1
when production costs fall, prices fall less in concentrated markets than they do in competitivemarkets because producers use their market power to capture larger profits (e.g., Rotemberg andSaloner, 1987). In the context of mortgage lending, this suggests that when the Federal Reservelowers interest rates, mortgage rates will fall less in concentrated mortgage markets than incompetitive markets. This could dampen the effects of monetary policy in locations wheremortgage lending is more concentrated.In this paper, we use panel data to examine the effects of mortgage market concentrationat the county level. Rather than focus on the level of the spread between mortgage rates and MBSyields, we instead study the relationship between concentration and the pass-through from MBSyields to mortgage rates. We provide evidence that increases in mortgage market concentration areassociated with decreased pass-through at the county level.Using the yield on GSE-guaranteed MBS as a proxy for the costs of mortgage financing,we find that mortgage rates are less sensitive to costs in concentrated mortgage markets. A onestandard deviation increase in county concentration reduces the impact of a decrease in MBS yieldson mortgage rates by 17%. Moreover, when MBS yields fall, the quantity of refinancing increasesin the aggregate. However, a one-standard deviation increase in county concentration reduces theimpact of a decline in MBS yields on the quantity of refinancing by 15%. The effects on mortgagerates and the quantity of refinancing compound each other. In a high-concentration county, fewerborrowers refinance, meaning that fewer households see their mortgage rates reduced at all. Andof the borrowers that do refinance, the rates they are paying fall less on average. The magnitudeof the combined effect is substantial: a one-standard deviation increase in concentration reducestotal monetary policy transmission through the mortgage market by 29%.Of course, mortgage market concentration is not randomly assigned, so it is difficult toascribe causality to these results. We address endogeneity concerns in a variety of ways. First, wefollow Hurst, Keys, Seru, and Vavra (2016) and use a nonparametric approach to purge mortgagerates of variation due to credit scores and loan-to-value ratios. In addition, our basic results arerobust to a battery of controls including county and time fixed effects, population, wages, houseprices, and county demographics. Moreover, we control for the interaction of changes in MBSyields with these characteristics. Thus, our results show that market concentration reduces thesensitivity of mortgage rates to MBS yields even after controlling for the possibility that this2
sensitivity can vary with county characteristics. Second, we use a matching procedure to ensurethat the counties we study are similar on observable dimensions. This does not affect the results.Third, we use bank mergers as an instrument for mortgage market concentration.Specifically, we examine a sample of counties where mortgage lending concentration is increasedby bank mergers, but the counties in the sample were not the key motivation for the merger. Inparticular, we focus on counties where the banks involved in a merger have a substantial presence,but the county itself makes up only a small fraction of the banks’ operations. Mergers increase theconcentration of mortgage lending in such counties. However, because the county makes up asmall fraction of each of the bank’s operations, it is unlikely that the county was an importantdriver of the merger. In this sample of counties, we show that the sensitivity of refinancing activityand mortgage rates to MBS yields falls after the merger, consistent with the idea that increasedconcentration causes less pass-through. The exclusion restriction here is that bank mergers affectthe sensitivity of refinancing and mortgage rates to MBS yields within a county only through theireffect on market concentration in that county. For the exclusion restriction to be violated, it wouldhave to be the case that bank mergers are anticipating changing county characteristics that explainour results, which seems unlikely. In examining observable county characteristics, we find noevidence of changes around mergers.Our paper is related to the broader literature examining the pass-through of monetary policyto consumer borrowing rates. Hannan and Berger (1991) and Neumark and Sharpe (1992) showthat pass-through is lower in more concentrated deposit markets. In addition, Scholnick (1996),Mojon (2000), Van Leuvensteijn, Kok Sørensen, Bikker and Van Rixtel (2013), find similar resultson pass-through to both deposit and credit interest rates. Ausubel (1990) documents the impact ofinertial consumer behavior on the effective level of competition in the credit card market, whileKahn, Pennacchi, and Sopranzetti (2005) examine the effect of competition on personal andautomobile loan rates. Our paper builds on this literature by focusing on the transmission ofmonetary policy through the mortgage market. Our key contribution is to identify substantial crosssectional variation in the pass-through of MBS yields to mortgage rates. Our paper is also relatedto Agarwal, Amromin, Chomsisengphet, Piskorski, Seru, and Yao (2015). They study the HomeAffordable Refinance Program (HARP) program, using a program feature that gave borrowers astrong incentive to refinance with their existing lenders, to cleanly identify a market power effect.3
Our paper shows that these kinds of market power effects persist even when consumers do nothave a strong contractual reason to refinance with their existing lender.The remainder of this paper is organized as follows. Section II provides some backgroundon the mortgage market, and Section III describes the data. Section IV presents our results onmortgage rates, and Section V presents our results on the quantity of refinancing. Section VIconcludes.II.BackgroundA. The Conforming Mortgage MarketWe begin with a brief review of the structure of the mortgage market. Our analysis focuseson prime, conforming loans, which are eligible for credit guarantees from the governmentsponsored enterprises (GSEs), Fannie Mae and Freddie Mac. Such mortgages may be put intoMBS pools guaranteed by the GSEs. The GSEs guarantee investors in these MBS that they willnot suffer credit losses. If a mortgage in a GSE-guaranteed pool defaults, the GSE immediatelypurchases the mortgage out of the pool at par, paying MBS investors the outstanding balance ofthe mortgage. Thus, investors in GSE MBS bear no credit risk except for the GSEs’ credit risk,which is generally small. In return for their guarantee, the GSE charges investors a guarantee fee.In addition to the fees charged by the GSEs, borrowers also pay mortgage lenders origination andservicing fees.Conforming mortgages must meet certain criteria. For instance, their sizes must be belowthe so-called conforming loan limit, which is set by the Federal Housing Finance Agency. Inaddition, the mortgages must meet basic GSE guidelines on loan-to-value ratios (LTVs), credit(FICO) scores, and documentation.An important fact for our empirical analysis is that GSE guarantee fees do not varygeographically. Indeed, until 2008, the GSEs charged a given lender the same guarantee fee forany loan they guaranteed, regardless of borrower (e.g., income, FICO), mortgage (e.g., LTV, loantype), and collateral (e.g., home value) characteristics. 1 In 2008 the GSEs began to charge fees thatvary by FICO score, LTV, and loan type, but do not vary by geography or any other borrower1However, there is some relatively minor variation in fees charged across lenders.4
characteristics. 2 Thus, for the loans we focus on in our analysis, the only two dimensions of creditquality that should materially affect rates on GSE-guaranteed mortgages are FICO and LTV. 3,4 Aswe discuss further below, our empirical methodology nonparametrically controls for FICO andLTVs, ensuring that differences in borrower characteristics are not driving our results. Moreover,our results hold in the period prior to 2008, suggesting that borrower-level variation in GSEguarantee fees are not driving the results.B. Definition of the Local Mortgage MarketA key assumption underlying our empirical analysis is that competition in the mortgagemarket is local. Specifically, we are assuming that county-level measures of concentration aregood proxies for the degree of competition in a local mortgage market. The advent of Internetbased search platforms like Bankrate.com and LendingTree.com has certainly improved the abilityof borrowers to search for the best mortgage terms. However, it has been shown that there is stillpricing heterogeneity for homogeneous products listed on the Internet (Dinerstein, Einav, Levin,and Sundaresan, 2014). Moreover, there is substantial evidence that many borrowers still shoplocally for their mortgages. Analyzing data from the Survey of Consumer Finances, Amel,Kennickell, and Moore (2008) find that the median household lived within four miles of its primaryfinancial institution in 2004. They find that 25% of households obtained mortgages from thisprimary financial institution, while over 50% of households obtained mortgages from an institutionless than 25 miles away.In addition, borrowers report that they exert little effort in shopping for lower mortgagerates. According to Lacko and Pappalardo (2007), in a survey conducted by the Federal TradeCommission, the average borrower considered only two loans while shopping. Thus, it is likelythat local market competition could affect loan terms like rates and points charged upfront. It could2Fannie Mae publishes their guarantee fee matrix online at: ix.pdf3Loan type does not affect our analysis of mortgage rates because we restrict our sample to 30-year fixed rate, fulldocumentation loans.4Other determinants of credit quality may have a small effect on the rates of GSE-guaranteed mortgages due toprepayment risk. When a GSE-guaranteed mortgage defaults, the GSEs immediately pay investors the remainingprincipal and accrued interest. From an investor’s perspective, it is as though the loan prepays. If defaults correlatewith the stochastic discount factor, which is likely, this risk will be priced by investors. However, since prepaymentsinduced by default are much smaller than prepayments induced by falling mortgage rates, this effect will be verysmall.5
also manifest itself in other ways. For instance, lenders may advertise more in more competitivemarkets, leading to greater borrower awareness of lower mortgage rates and increased refinancingactivity. Indeed, Gurun, Matvos, and Seru (2013) find evidence that local advertising affectsconsumer mortgage choices, suggesting that local competition is important.Data from RateWatch, a vendor that surveys lenders about the mortgage rates they charge,provides more direct evidence that mortgage markets are partially local. RateWatch surveysdifferent branches of the same lender and, crucially, keeps track of how many rate-setting locationsa particular lender has. For instance, if the lender sets one national rate, it will have one rate-settinglocation. In contrast, if each branch has the authority to set its own mortgage rates, RateWatch willrecord each branch as a rate-setting location. Of the 63,615 surveyed branches, 31,086 (49%) haverate-setting locations in the same MSA. The median rate-setting location covers just four branches,while the average rate-setting location covers 16 branches. While some large lenders set a singlerate nationally, the median rate-setting location covers a single MSA, and the average rate-settinglocation covers two. Within the median MSA, there are eight rate-setting locations, and theaverage MSA has 18 rate-setting locations.Thus, there are good reasons to believe that competition in the mortgage market is local.In the data, county-level concentration is strongly autocorrelated over time. A simple regressionof our main measure of concentration (the market share of the top 4 lenders in a county) yields anannual autoregressive coefficient of 0.87. This implies that a one-standard deviation increase inTop 4 dissipates after eight years. Entry and competition do operate in this market, but at relativelylow frequencies. This slow adjustment may be the product of barriers to entry in mortgage lending.Specifically, mortgage origination requires balance sheet capacity for warehousing loans beforethey are securitized. In addition, regulatory frictions may play an important role. Mortgage lendersmust comply with a variety of regulations, including the Home Mortgage Disclosure Act and theCommunity Reinvestment Act.III.DataThe data in the paper come primarily from two sources. The first is the loan applicationregister data required by the Home Mortgage Disclosure Act (HMDA) of 1975. The data containevery loan application made in the United States to lenders above a certain size threshold. Of6
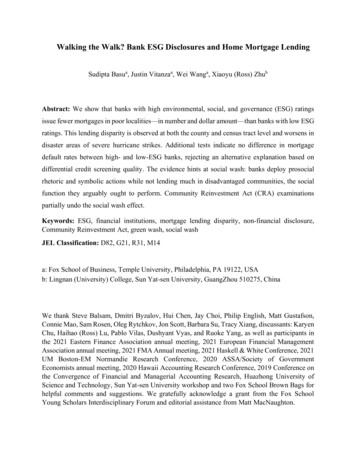
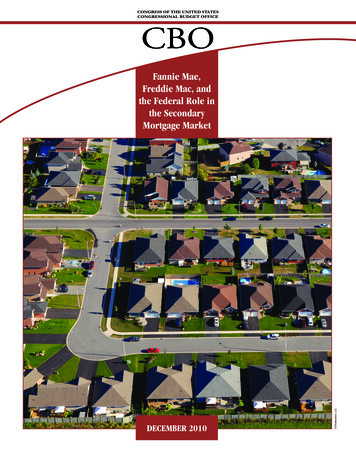
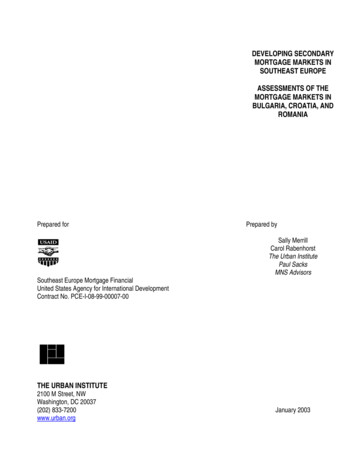
primary interest in this paper, the data contain information on whether the loan application was fora refinancing or a new home purchase, whether the loan application was granted, a lenderidentifier, as well as loan characteristics including year, county, dollar amount, and borrowerincome. We construct an annual, county-level sample of mortgage refinancing using this data over1990-2014. To ensure that we are focusing on comparable markets, we restrict the sample to thetop 500 counties by population.Since the HMDA database includes lender identifiers, we can use it to construct countylevel measures of competition in mortgage lending. The measure of concentration we use in allour baseline specifications is the share of each county’s market served by the top 4 mortgagelenders in the county. In the Internet Appendix, we establish that the results are robust to alternativemeasures of concentration, including using the Hirschman-Herfindahl Index of concentrationcalculated using the same HMDA database and conducting our analysis at the MSA level ratherthan the county level. While these measures of concentration are surely imperfect proxies for thelevel of local competition, it is only important for our analysis that they capture some of thevariation in local competition. 5Fig. 1 shows the geographic distribution of top 4 concentration, both for the entire nationand for our sample of the top 500 counties. To give concrete examples of high and lowconcentration counties, Fig. 2 lists the highest and lowest concentration counties in our sample in2010. The identities of the top lenders, and their dominance across markets, has changed over time.For example, in 2000, the top national lender was Bank of America, which appeared among thetop 4 lenders in 168 of the top 500 counties. In 2010, the top national lender was Wells Fargo,which appeared among the top 4 lenders in 427 of the top 500 counties. Beyond the biggest banks,over 4,000 institutions appear in the top 4 in one of the counties in our sample at least once. Forthese institutions, the median number of counties in which they appear in the top 4 is one, the meanis five, and the 95th percentile is 10.5In addition, in the Internet Appendix results, we show that the results are similar when we exclude county-yearswhere the fraction of loans originated by brokers and correspondents is high. Because HMDA may not account forsales through brokers and correspondents properly, the scope for mismeasuring concentration is greater in thesecounties. The robustness of our results to the exclusion of these counties shows that such measurement error is unlikelyto be driving our results.7
To supplement the HMDA data and analyze the determinants of mortgage rates, we useFannie Mae’s Single Family Loan Performance Data. The data includes the borrower’s credit(FICO) score, the date of origination, the loan size, the loan size relative to the house value (LTVratio), whether the loan is originated for purchase or refinancing, the three-digit zip code of theproperty, and the interest rate on the mortgage. To ensure the loans we study are maximallycomparable, we restrict the sample to loans for refinancing that are 30-year, fully amortizing, fulldocumentation, single-family, conventional fixed-rate mortgages with FICO scores above 660guaranteed by the GSEs between 1999 and 2014. We use the USPS/HUD Crosswalk files to mapthree-digit zip codes to counties and restrict the sample to the 500 largest counties by population.To purge mortgage rates of geographical differences in borrower and loan characteristicsthat may be correlated with market concentration, we follow the procedure used in Hurst, Keys,Seru, and Vavra (2016). Specifically, we run the regressionRateikm α 0,m α1,m Xim ηikm ,where Rateikm is the loan-level mortgage rate on a loan to borrower i in county k in month m, andXim is a series of FICO dummies (620-639, 640-659, . 780-799, etc.) and a series of LTVdummies (50-54, 55-59, .80-84, .95-99, etc.). Note that regression includes time dummiesα 0,m and time-varying coefficients on the controls α1,m . Thus, the regression allows for timevarying distributions and pricing of borrower FICOs and LTVs. This is important because, asdescribed above, the GSEs began to charge fees varying by FICO score and LTV in 2008, andthese price schedules have varied over time.We aggregate the residuals by county-quarter, adding back the time dummies so that wecan estimate the average degree of pass-through across all counties. Specifically, we construct Rkt1N kt (i , m ) {k ,t }(α0, m ηikm )for each quarter t and county k. Rk ,t is the average residual rate faced by all individuals in quartert and county k. It is our main dependent variable when we study pass-through of MBS yields intomortgage rates.8
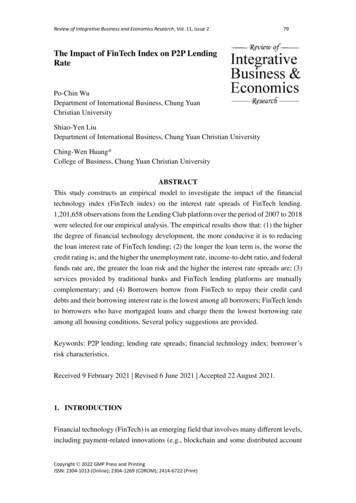
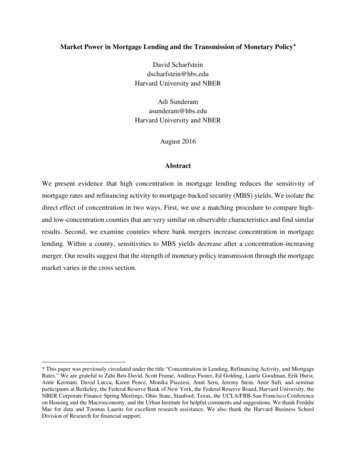
Finally, we supplement these data sources with county-level demographic and wagestatistics from the Census Bureau and historical yields on current coupon Fannie Mae MBS, whichwe obtain from Bloomberg.Table 1 provides summary statistics. The average residualized rate in our sample is 5.98%(it is not zero on average because we add back the time dummies α 0,m ). The average change in theresidualized rate is on average close to zero, as is the average change in MBS yield. The averagecounty in our sample has a population of 283,000, with an average wage of 38,000 per year andan average home price of 157,000.IV.Mortgage Rates ResultsA. Baseline ResultsWe now turn to the results. We begin by studying the pass-through of MBS yields intolocal mortgage rates. We regress the change in our residualized rates on the change in 30-yearFannie Mae current coupon MBS yields over the quarter, 6 county-level top-4 concentration laggedone year, and the interaction of the two. Formally, we run: Rk ,t α β1 MBS Yieldt β 2 Top 4k ,t 1 β3 MBS Yieldt Top 4k ,t 1 γ'X k ,t ε k ,t .We weight the regression by the quantity (volume) of loans originated in county k at time t.Standard errors are clustered by county and time. The coefficient of interest is β3, which measuresthe extent to which sensitivities to MBS yields depend on county concentration.Table 2 shows the results. The coefficient β1 shows that there is positive pass-through ofMBS yields to borrowers. When MBS yields rise, mortgage rates rise as well. The coefficient β3on the interaction between MBS yields and concentration implies that high concentration reducesthe pass-through of MBS yields to borrowers. Fig. 3 presents this result graphically, plotting thechange in residualized rates for high- (top decile) and low- (bottom decile) concentration counties6The current coupon MBS yield is meant to represent the yield on newly issued MBS. It is derived from prices in theforward market for GSE MBS, called the to-be-announced or TBA market, on MBS to be delivered in the currentmonth. In the Internet Appendix, we also find that our results are robust to using the 10-year Treasury yield as a proxyfor funding costs. In addition, in the Internet Appendix, we show that our results are robust to replacing the change inthe MBS yield with the change in the incentive to refinance, measured as the difference between the average couponon existing MBS and the current coupon MBS yield.9
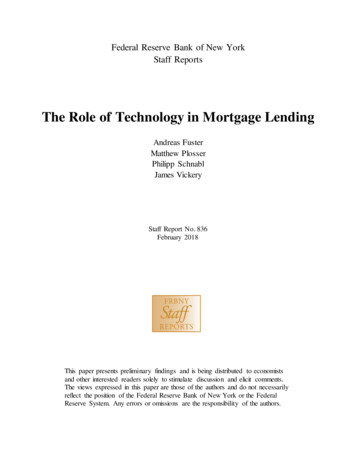
as a function of the change in MBS yields. Fig. 3 also highlights how our results relate to Hurst,Keys, Seru, and Vavra (2016). They show that the average mortgage rate does not varysystematically across county characteristics, including concentration. Fig. 3 shows that this isbecause mortgage rates fall more in low concentration counties when MBS yields fall, but alsorise more in low concentration counties when MBS yields rise. Since the change in MBS yieldsnets out to approximately zero over time, there is no relationship between rates and concentrationon average.Recall that the dependent variable has already been residualized nonparametrically withrespect to borrower FICO and LTV. However, one may still wonder whether the differences inpass-through we are finding are driven by county characteristics other than market concentration.For instance, if some counties have more sophisticated borrowers than others, and these differencesare not captured by FICO and LTV, these counties might experience a larger increase inrefinancing demand when MBS yields fall and thus see their mortgage rates fall less.To examine this possibility, Fig. 4 plots various county characteristics as a function ofconcentration. The first panel of Fig. 4 plots demographic characteristics: population, percentageof the population under 18, percentage of the population over 65, percentage of the population thatis black, percentage of the population with a high school degree, and the homeownership rate. Togive a sense of economic magnitudes, the range of the y-axis is set to be the 10th-90th percentile ofthe dependent variable. As the figure shows, there is not a strong relationship between marketconcentration and homeownership or high school graduation rate. For the other measures, thereare relationships between concentration and demographics. However, many of the relationshipsare relatively small, both in economic terms and relative to the overall amount of variation in thedemographic variable. For instance, as top 4 concentration ranges from 20% to 50%, a change of2.5 standard deviations, the percentage of the population that is under 18 drops from 24% to 22.7%.The second panel of Fig. 4 plots financial variables as a function of market concentration.We plot average wage, loan LTV, borrower FICO, and average house price. There are againrelationships between these variables and market concentration, though with the exception ofFICO, they are not economically large. Table 3 formalizes the results in Fig. 4 using regressions.Specifically, we run univariate panel regressions of demographic variables on concentration. Weinclude year fixed effects so that we isolate the cross-sectional relationships between the variables.10
To ensure that differences in county characteristics are not confounding our results, weinclude a variety of additional controls across specifications in Table 2. We start by adding countyand year fixed effects in the second and third columns of the table. Note that because Top 4k ,t ismeasured annually (because it is from the HMDA data), we only need to add year rather than yearquarter fixed effects to control for any time trends in concentration.In our most stringent specification, we also include a host of controls X k ,t , which includeall the county characteristics discussed above as well as their interactions with the change in MBSyields. This allows the response of mortgage rates to MBS yields to vary across counties forreasons other than market concentration. This specification is presented in the fourth column ofTable 2. For compactness, the levels of the controls are suppressed in the table, but theirinteractions with the change in MBS yields are shown. The fourth column of Table 2 shows thatour main result survives these saturated controls, with the magnitude and significance of theinteraction between market concentration and the change in MBS yields unchanged. 7 This suggeststhat county characteristics other than concentration are not driving our results.One may still worry that time-varying borrower selection could explain these results. Inother words, a high-concentration county may have similar demographic characteristics to a lowconcentration county, but different types of borrowers might take out mortgages in the highconcentration county when MBS yields fall. In the Internet Appendix, we examine this hypothesisby running our baseline specifications but using borrower characteristics, including FICO, LTV,and debt-to-income ratio, as the dependent variable. We find no evidence that these variablesrespond differently in high- versus low-concentration counties to changes in MBS yields. Inaddition, we find no evidence that the share of adjustable rate mortgages changes differentially inhigh- versus low-concentration as MBS yields change.The final column of Table 2 shows that our results persist when we restrict the sample tothe pre-crisis period, 1999-2007. Thus, the results we document here are not solely driven by the7Our house price data is from Zillow and is restricted to a limited number of MSAs starting in 1996, which explainsthe sharp decrease in the number of observations. The results are robust to using MSA house price data from theFederal Housing Finance Agency.11
period during and after the financial crisis. The statistical evidence is somewhat weaker herebecause the time dimension of our data is relatively shor
Saloner, 1987. ) In the context of mortgage lending, this suggests that when the Federal Reserve lowers interest rates, mortgage rates fall less in concentrated mortgage markets than in will competitive markets. This could dampen the effects of monetary policy in locations where mortgage lending is more concentrated.